

【11/1 Morning EURUSD】Moves within the range 1.1136 to 1.1214, ends Friday at 1.116|Viewing market structure and recent targets on LIGHTHOUSE
About LIGHTHOUSE
LIGHTHOUSE (LightHouse) automatically displays the chart's "reading" sectionA discretionary trading aid indicator.
・Displays the direction of the higher timeframe and the current candle in five levels at the top left of the chart
・Automatically displays the updates of highs and lows (HH/HL/LH/LL) and the BOS/CHoCH lines
・Shows pullback and retracement zones, support/resistance reversal zones, and range boxes
・The marks for peaks and valleys are fixed once confirmed, and do not move or disappear later (no repaint)
・Since meanings of terms are shown at the bottom left of the chart, you can learn while looking
The trading decisions are made by you, and this is a tool to grab the basis of your decisions at a glance.
[Highlights] EUR/USD market notes up to the close on Oct 30 (Fri)
・Low on Oct 291.11040then retraced to high in the 4 o'clock period on the 30th1.12141and by 17:00 had pulled back to1.11358.
・The close on Oct 30 (Fri) was1.11566 (high 1.12141, low 1.11358 for that day)
・Above are1.11709・1.12051, the lows below are1.11358・1.11040, which are commonly watched price ranges
1. Recent Market Feel (Weekly/Daily/Hourly)
Weekly: rose in the week of Oct 12, then closed down for two weeks to 1.11566
Weekly closing prices: week of Sep 21 was 1.13899, Sep 28 was 1.12530, Oct 5 was 1.12003, Oct 12 was 1.12381, Oct 19–23 was 1.12023, Oct 26–30 was 1.11566. The week of Oct 26–30 had a high of 1.12259 and a low of 1.11040, ending about 0.0046 lower than the previous week's close.
Daily: from the Oct 29 low of 1.11040, it retraced to 1.12141 on Oct 30 and closed at 1.11566
On Oct 23 (Fri) it moved between 1.11839 and 1.12258, closing at 1.12023. On Oct 26 (Mon) it moved between 1.11727 and 1.12259, closing at 1.11730; Oct 27 (Tue) between 1.11217 and 1.11774, closing at 1.11238; Oct 28 (Wed) between 1.11123 and 1.11687, closing at 1.11518. Oct 29 (Thu) moved from 1.11040 to 1.11849, closing at 1.11792; Oct 30 (Fri) moved from high 1.12141 to low 1.11358, closing at 1.11566.
Hourly: from 1.12141 at 4:00 on Oct 30, down to 1.11358 by 17:00
Oct 28 (Tue) reached a high of 1.11687 at 21:00, Oct 29 (Wed) posted a low of 1.11040 at 16:00 and a high of 1.11849 at 23:00, ending at 1.11792. On Oct 30, after hitting a high of 1.12141 at 4:00, moved to 1.12051 at 13:00 and 1.11358 at 17:00, then traded between 1.11497 and 1.11709 and closed at 1.11566.
Price levels that tend to be watched (chart-based facts)
| 1.12141 | High of Oct 30 (4:00) |
| 1.12051 | High of Oct 30 (13:00) |
| 1.11709 | Evening high Oct 30 (21:00) |
| 1.11566 | Close of Oct 30 (Fri) |
| 1.11358 | Low of Oct 30 (17:00) |
| 1.11040 | Low of Oct 29 (16:00) |
Due to potential large price moves around economic releases and statements from officials, please check the schedule yourself. The numbers in the text are values up to the 23:00 hour server time on Oct 30 (Fri).
2. When you view the same chart with LIGHTHOUSE
From here, we will view the same EUR/USD chart with LIGHTHOUSE applied.
Daily (higher timeframes are weekly): both weekly and daily show a strong sell
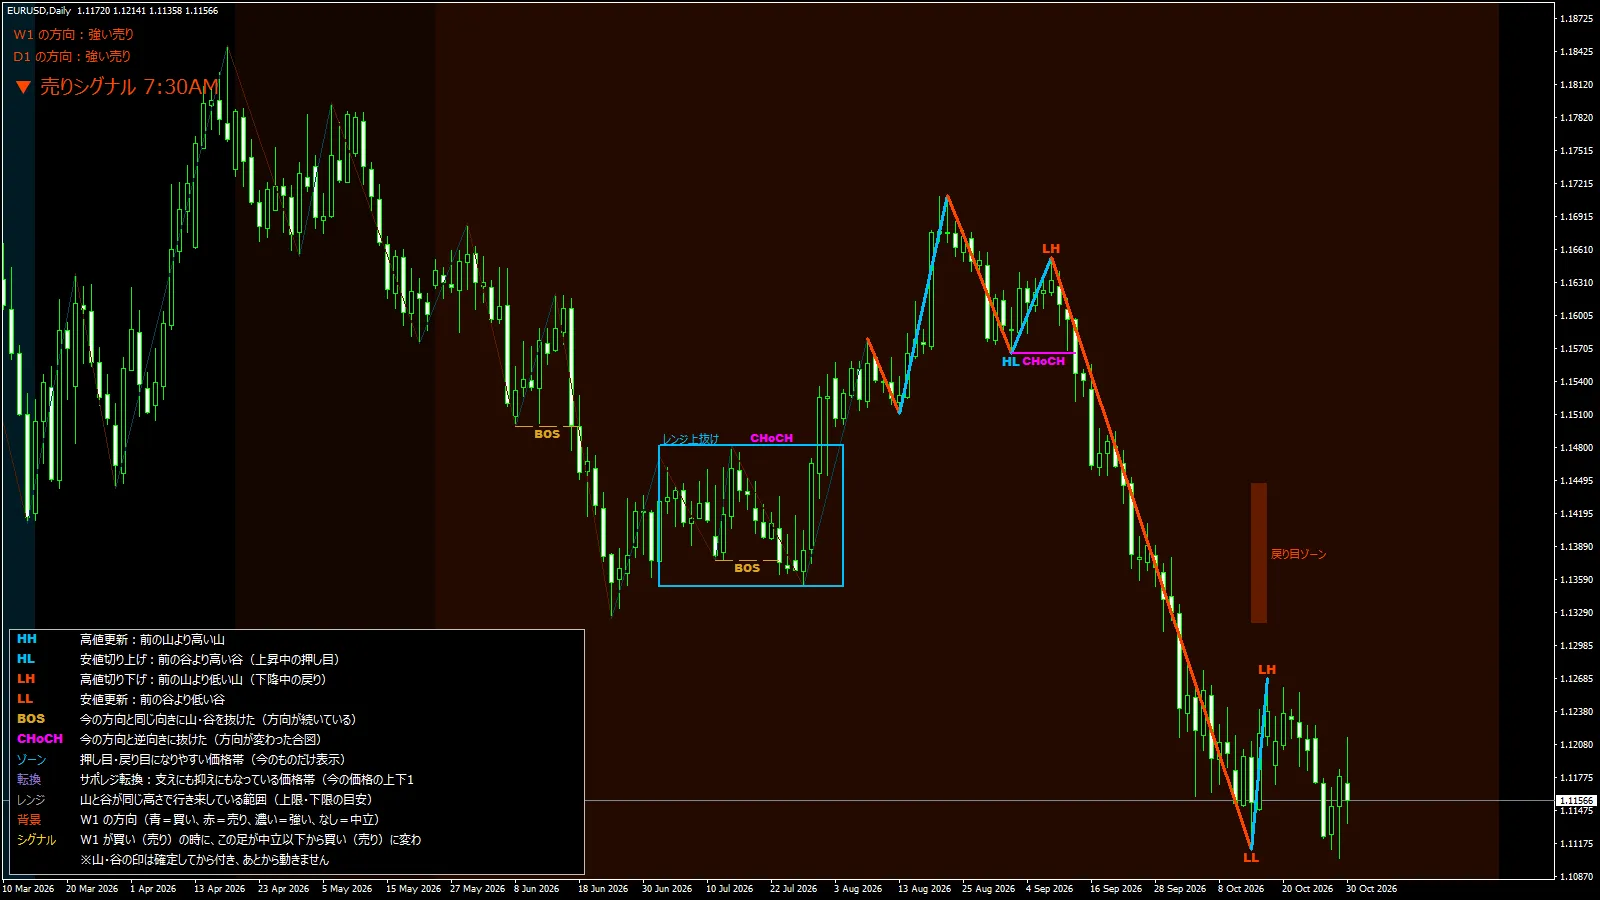
The top left shows the direction of W1: strong sell and D1: strong sell, and a "Sell Signal 7:30 AM" is also displayed. The peaksLH lead to the subsequent lowLLLH is formed, with the price in the low price range shown.
Above price, around 1.133–1.145, aretracement zoneis displayed. The current price is below this zone.
Hourly (Daily is higher timeframe): both daily and hourly show a strong sell
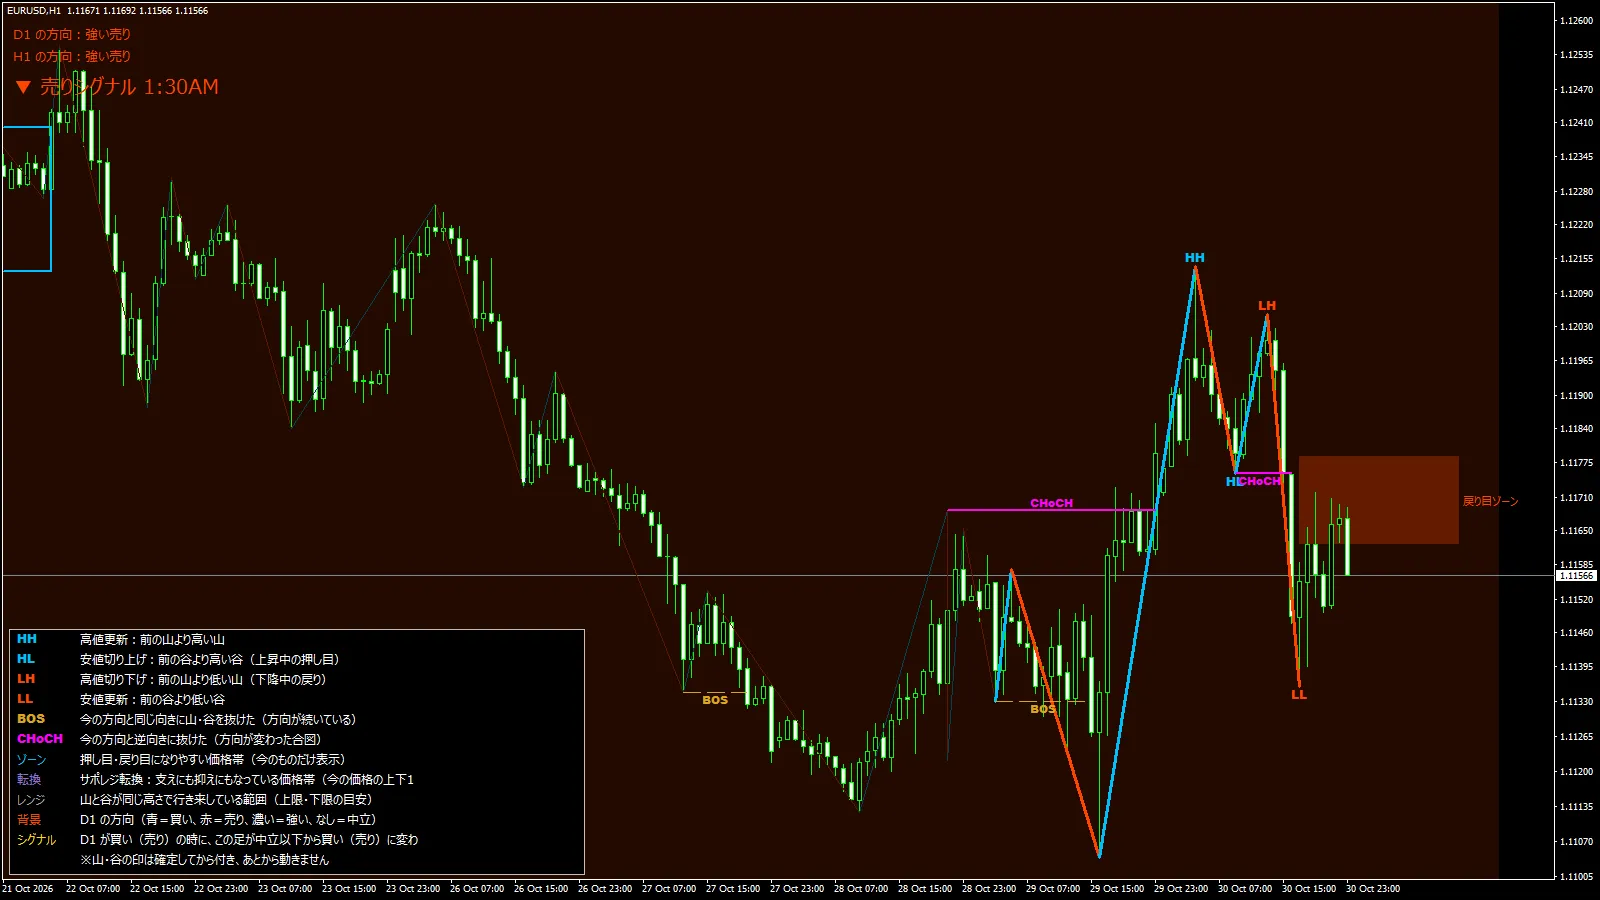
The top left shows the direction of D1: strong sell and H1: strong sell, with a "Sell Signal 1:30 AM" displayed. The peak at 4:00 on the 30th showsHH, the peak at 13:00 showsLH, the trough at 17:00 showsLL, andCHoCH is also present.
Above price, aretracement zoneis displayed near 1.1163–1.1178.
5-minute chart (Hourly is higher timeframe): Hourly is strong sell, 5-minute is neutral
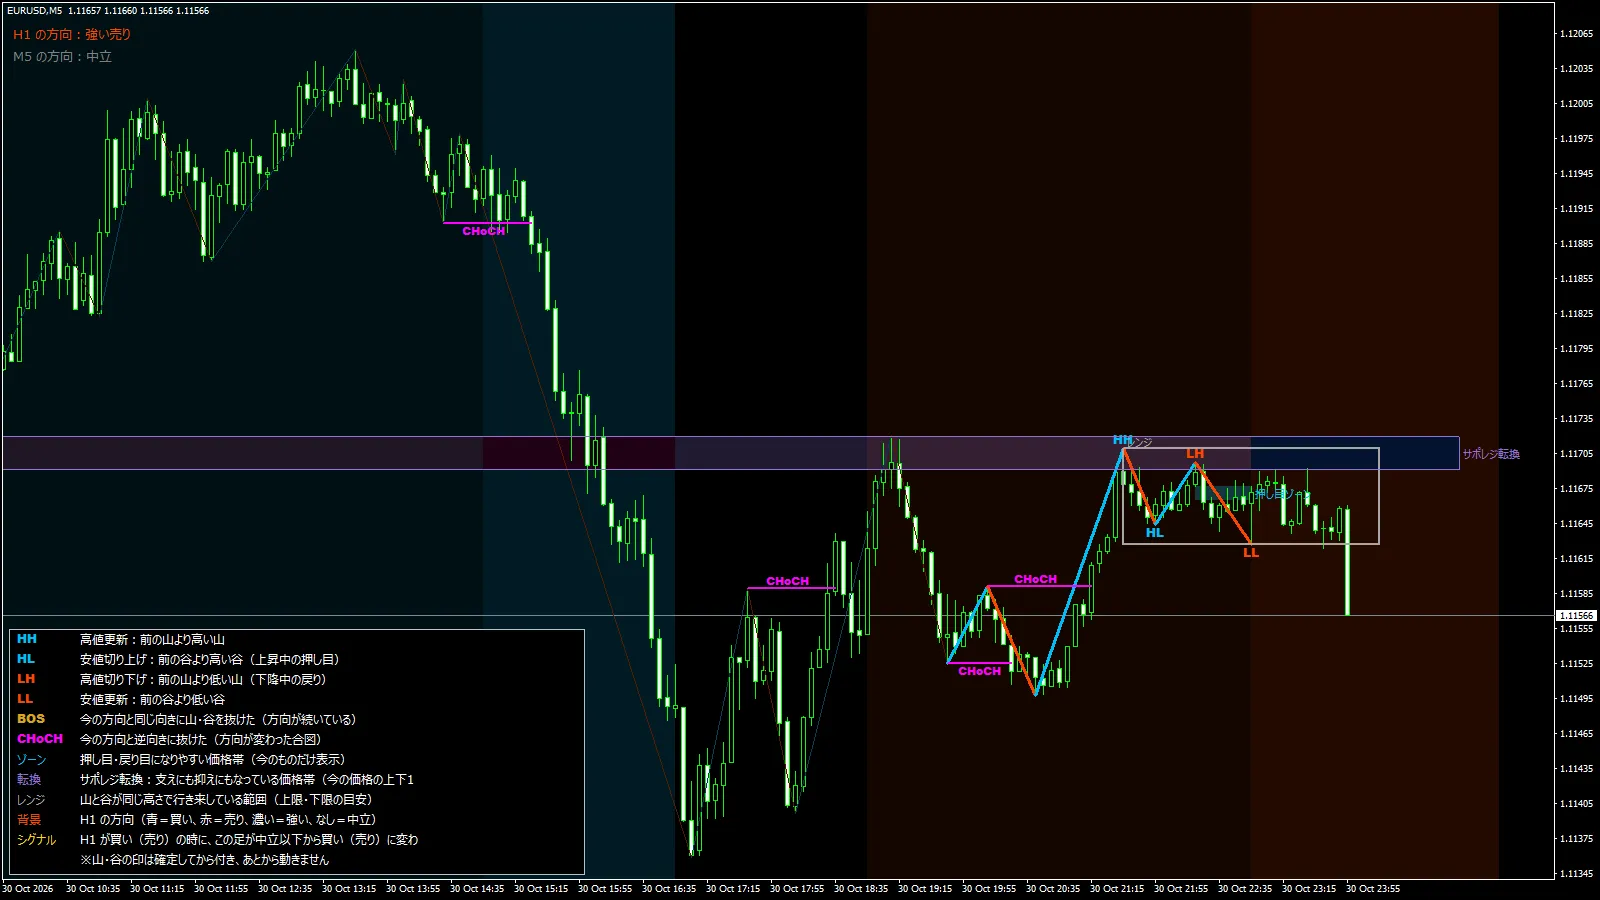
The top left shows H1 strong sell and M5 neutral. On Oct 30 at night, after the high of 1.11709 at 21:00,HH occurred, then a low ofHL, a high ofLH, a low ofLL formed, and it moved within the 1.1162–1.1170 range, finishing at 1.11566 around 23:00.
Above price, asupport/resistance reversal zoneis displayed near 1.1169–1.1172. When the higher timeframe is strong sell and the current candle is neutral, you can watch which timeframe shifts first.