
After CHoCH, what if a range follows?|Interpreting the downward resumption with higher timeframe MA and BOS【DWM Practical Chart Analysis EP.08】
DOWWAVE MARKER | DWM Practical Chart Analysis Series EP.08
After CHoCH, if a range continues?
Reading a range market with upper-timeframe MA and BOS to interpret the decline
Using USDCHF / 15-minute chart as a case, we confirm the long range after CHoCH confirmation and the flow of moving below the mid- to long-term MA on the higher timeframe into a strong drop.
Even though CHoCH is confirmed, price action does not move much afterwards.
In such situations, what should we verify?
DowWave Marker (DWM) Practical Chart Analysis SeriesEpisode 8 isUSDCHF (Dollar/Swiss) 15-minute chart where the higher-timeframe mid-term MA supports a long period of range after CHoCH confirmationand discusses the flow toward a strong drop after breaking the upper-timeframe long-term MA.
We interpret from the range resolution to BOS confirmation, and then to breaking the upper-timeframe long-term MA as one continuous flow.
This episode's theme iswhat to read from price structure and higher-timeframe MA in the midst of a range.
We focus not only on the abrupt drop but also on the preceding consolidation process.
Video: DWM Practical Chart Analysis Series EP.08

If you cannot play the videoView EP.08 on YouTube
If you want to confirm each DWM feature on your own chart,you can try the 14-day free trialfor details.
01 / STRUCTURE CHANGE
Even after CHoCH is confirmed, the trend does not move immediately
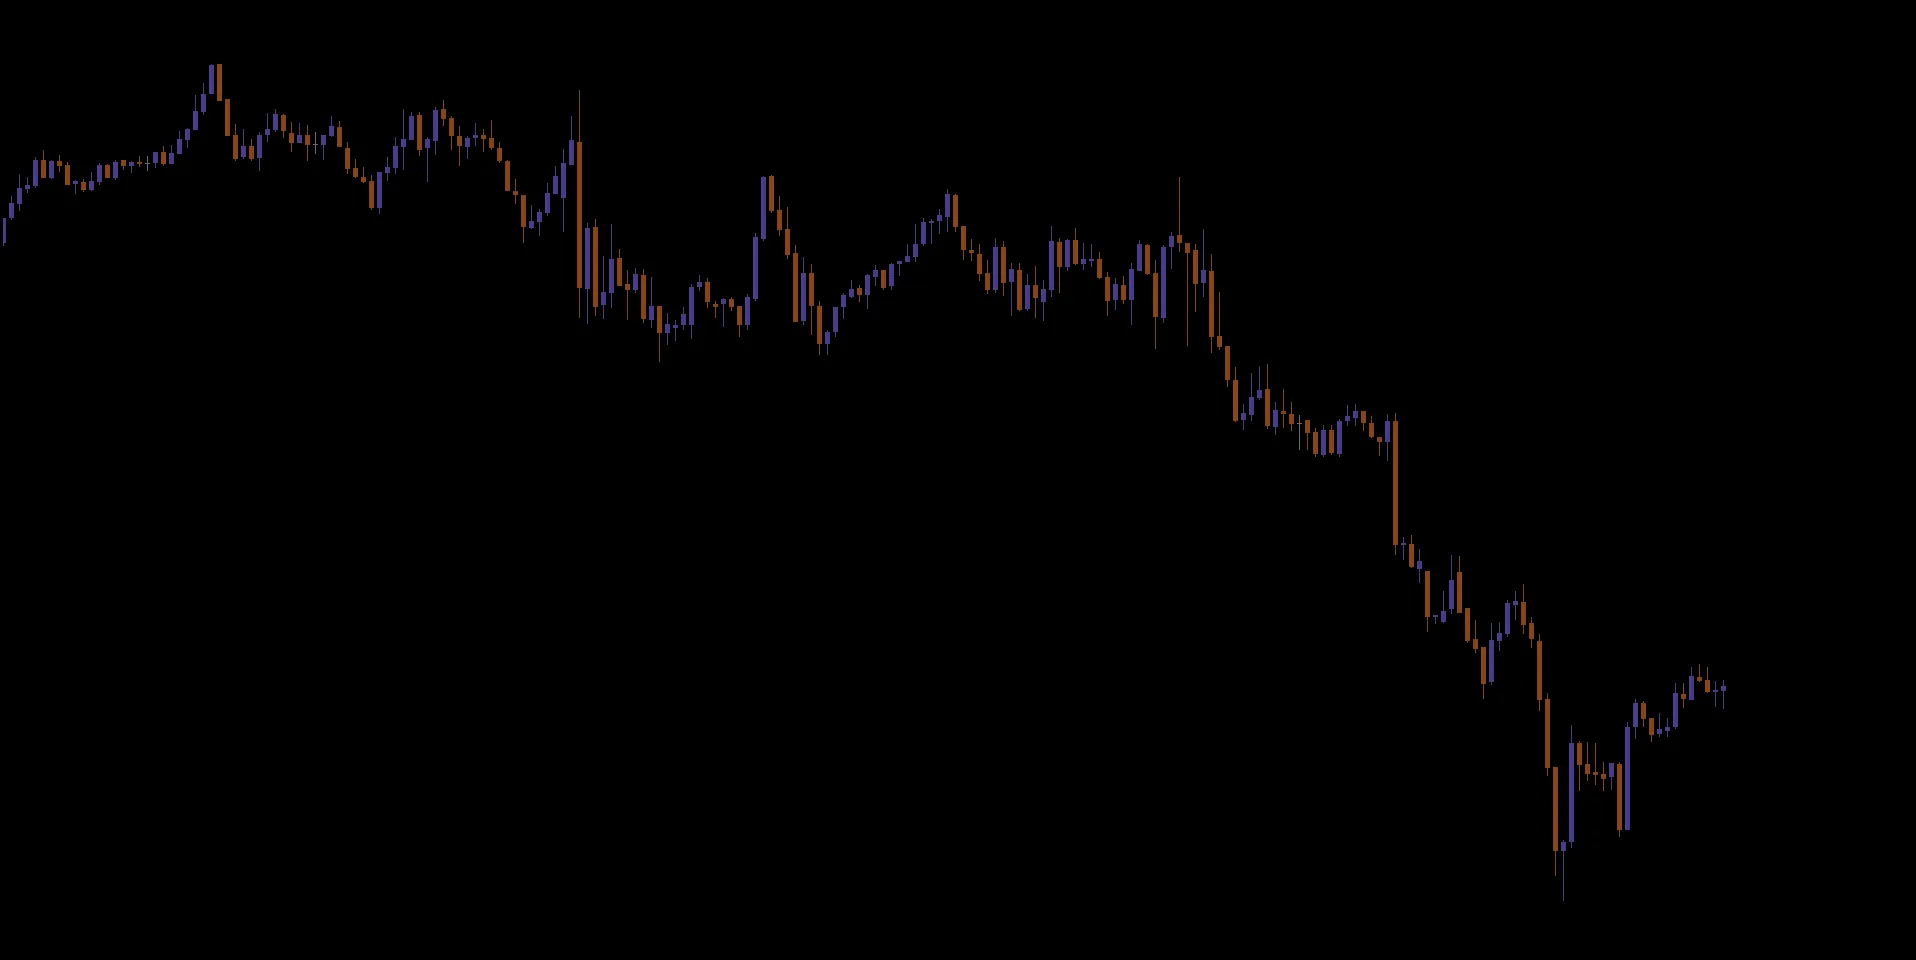
First, the candlestick price movement.
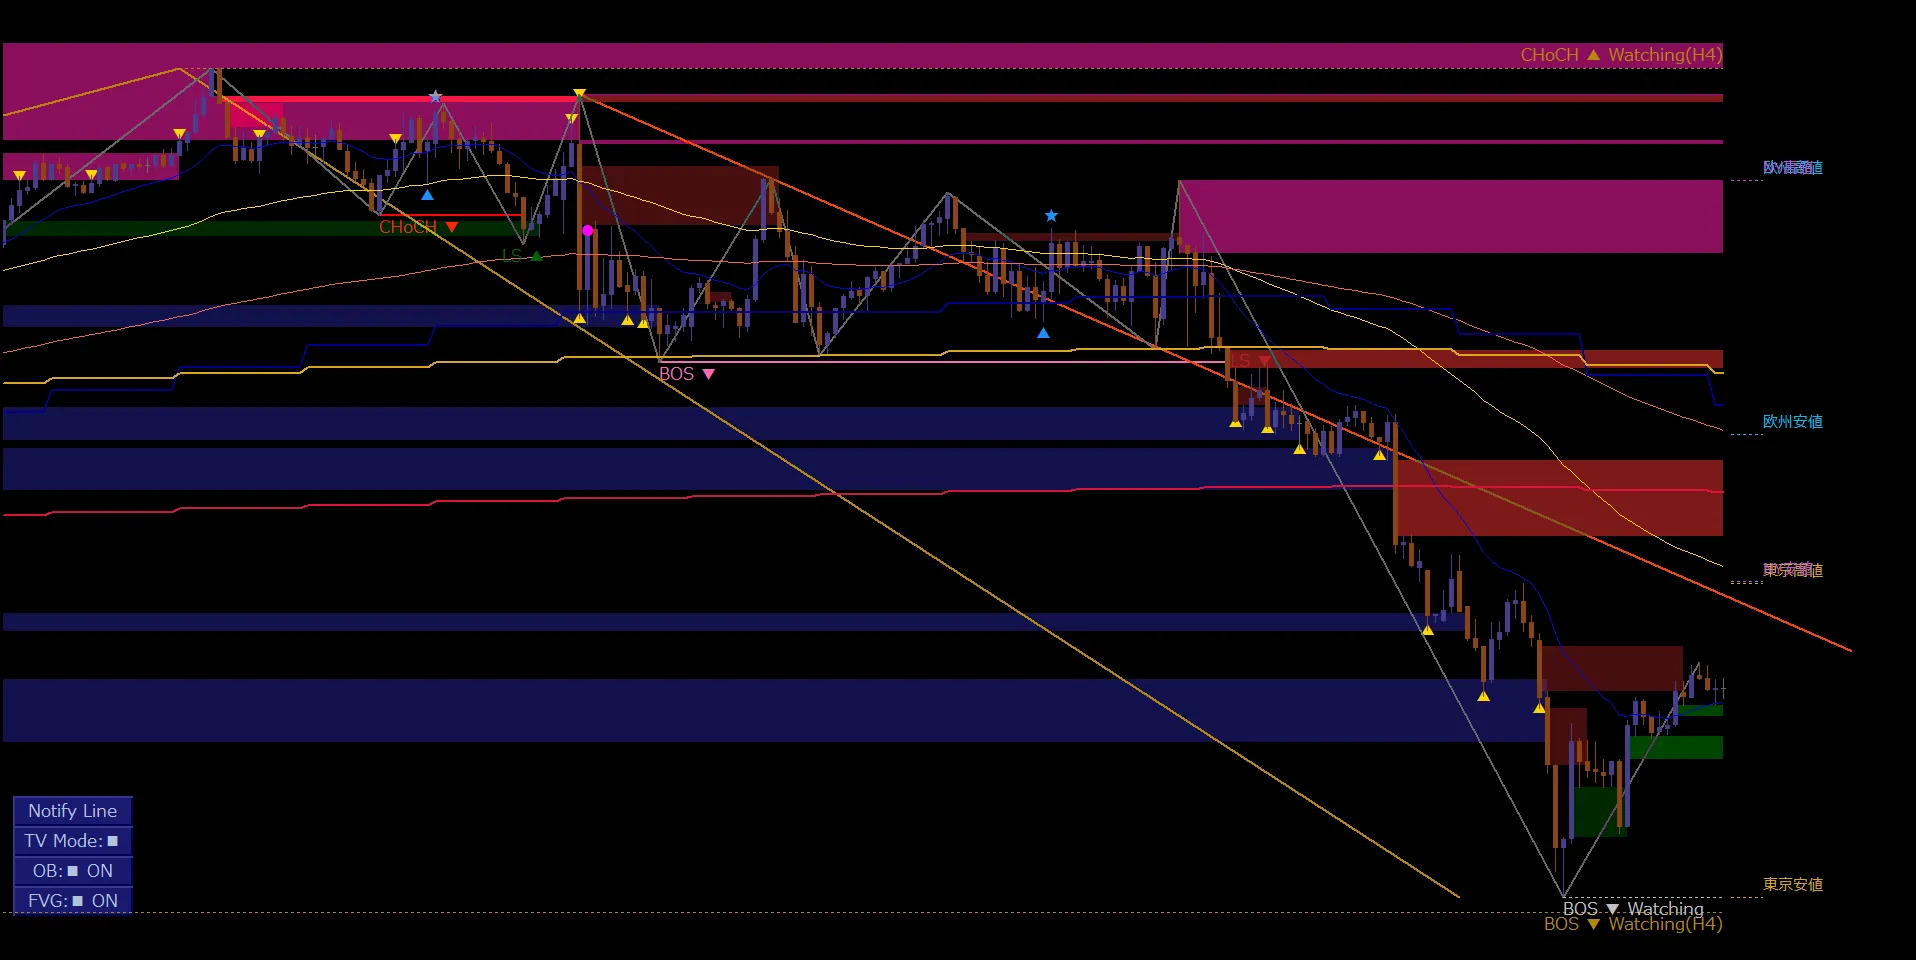
After initial oscillation, CHoCH▼ is confirmed and a structural change toward the downside is indicated.
However, prices do not fall straight down thereafter.
CHoCH is a signal that the structure of the previous highs and lows has been broken.
It is essential to continue watching how price action evolves after confirmation..
02 / RANGE & HIGHER-TIMEFRAME MA
Higher-timeframe mid-term MA supporting the range floor
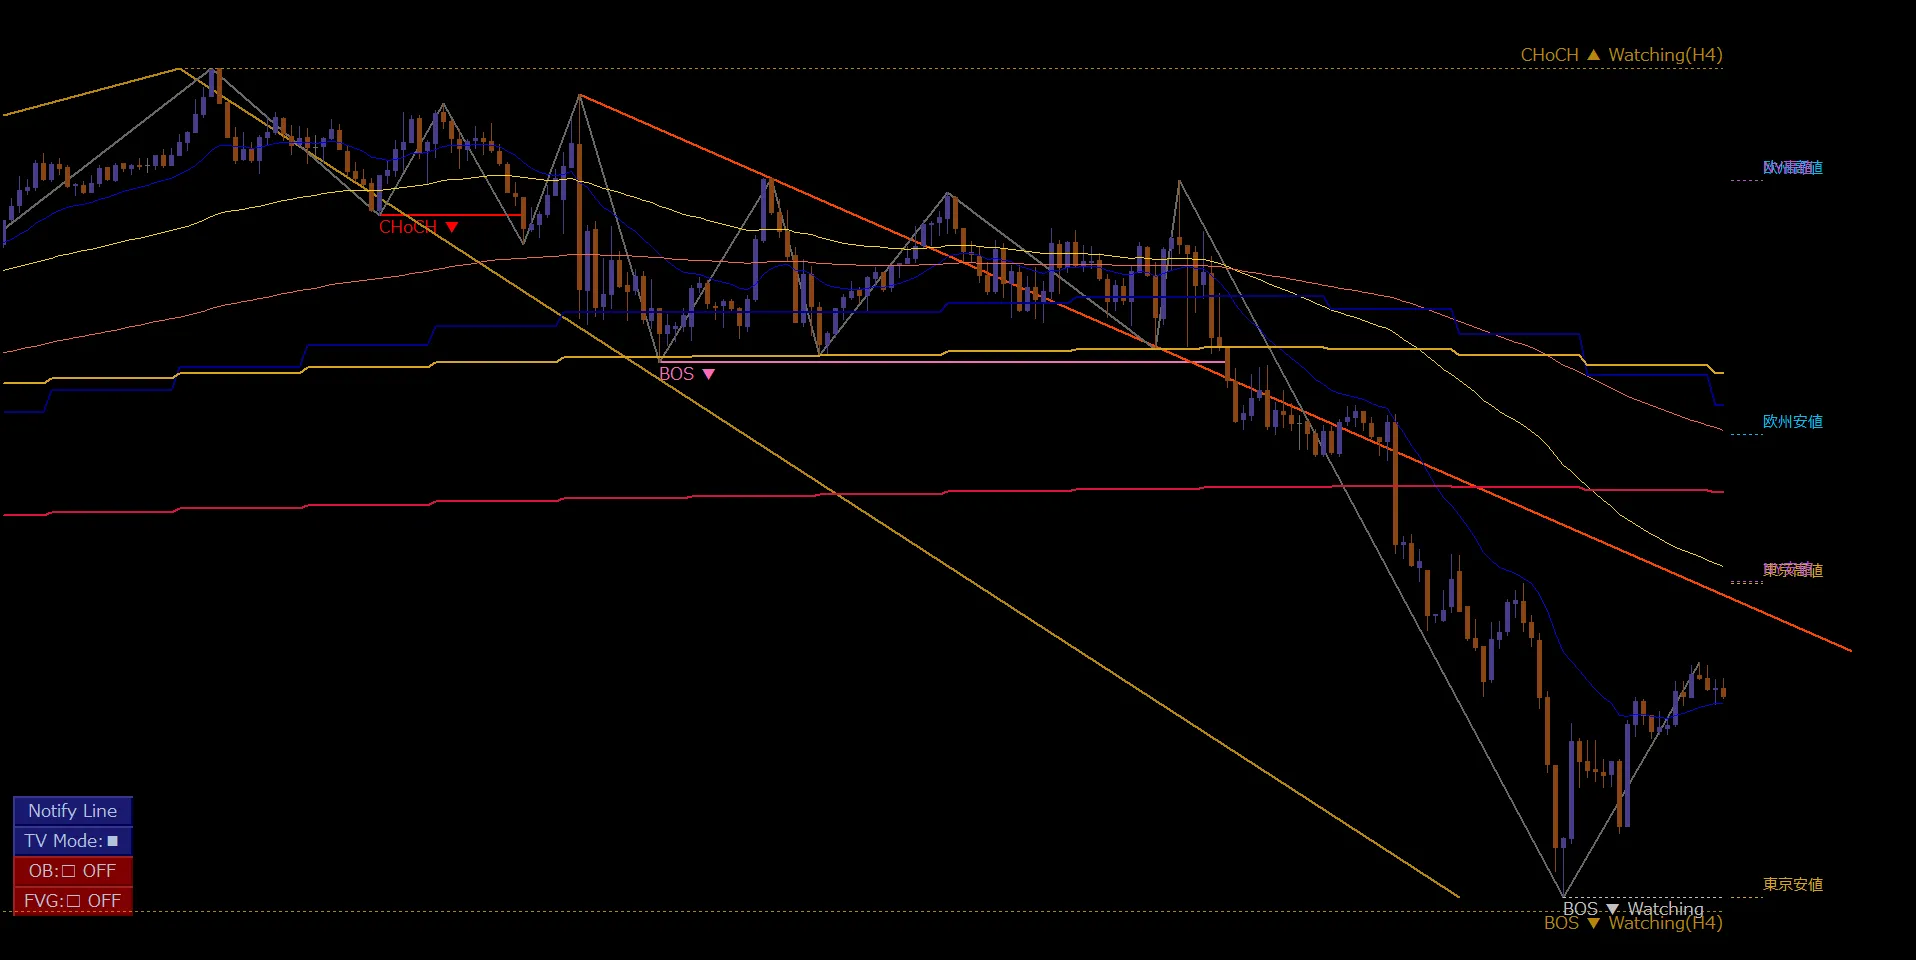
The focus this time is the range period after CHoCH▼ confirmation.
As rebounds and declines repeat,the price tends to stop falling around the 4-hour mid-term MA.
Even if the CHoCH on the 15-minute chart shows a downside structure change, as long as the higher-timeframe mid-term MA supports the lower bound, the decline may stall.
Inside the range, confirm the updates of highs/lows together with their relation to MA.
While supported by the higher-timeframe mid-term MA, the range can still have a breakout to the upside possibility.Do not assume the price will decline; observe which level it breaks
Do not assume the price will decline; observe which level it breaksto establish environmental awareness.
03 / BOS & MOMENTUM
Breaking below the mid-term MA, BOS confirmation, and breakthrough of the long-term MA
Subsequently, price moves toward the range downside and BOS▼ is confirmed after breaking the higher-timeframe mid-term MA.
This is a moment where the CHoCH-induced change allows continued downward structure.
Also noteworthy isthe 4-hour long-term MA located just below the mid-term MA.
Price breaks below this long-term MA with a strong momentum candle and continues to make lower highs and lower lows.
Here, the break below the higher-timeframe MA and BOS confirmation are separate decision points.
This does not mean BOS is defined by an MA break; rather, it is a synthesis of structure continuity by the Dow Wave and price strength against the higher-timeframe MA.
04 / WATCHING ON H4
Higher-timeframe Watching visible in late-stage decline
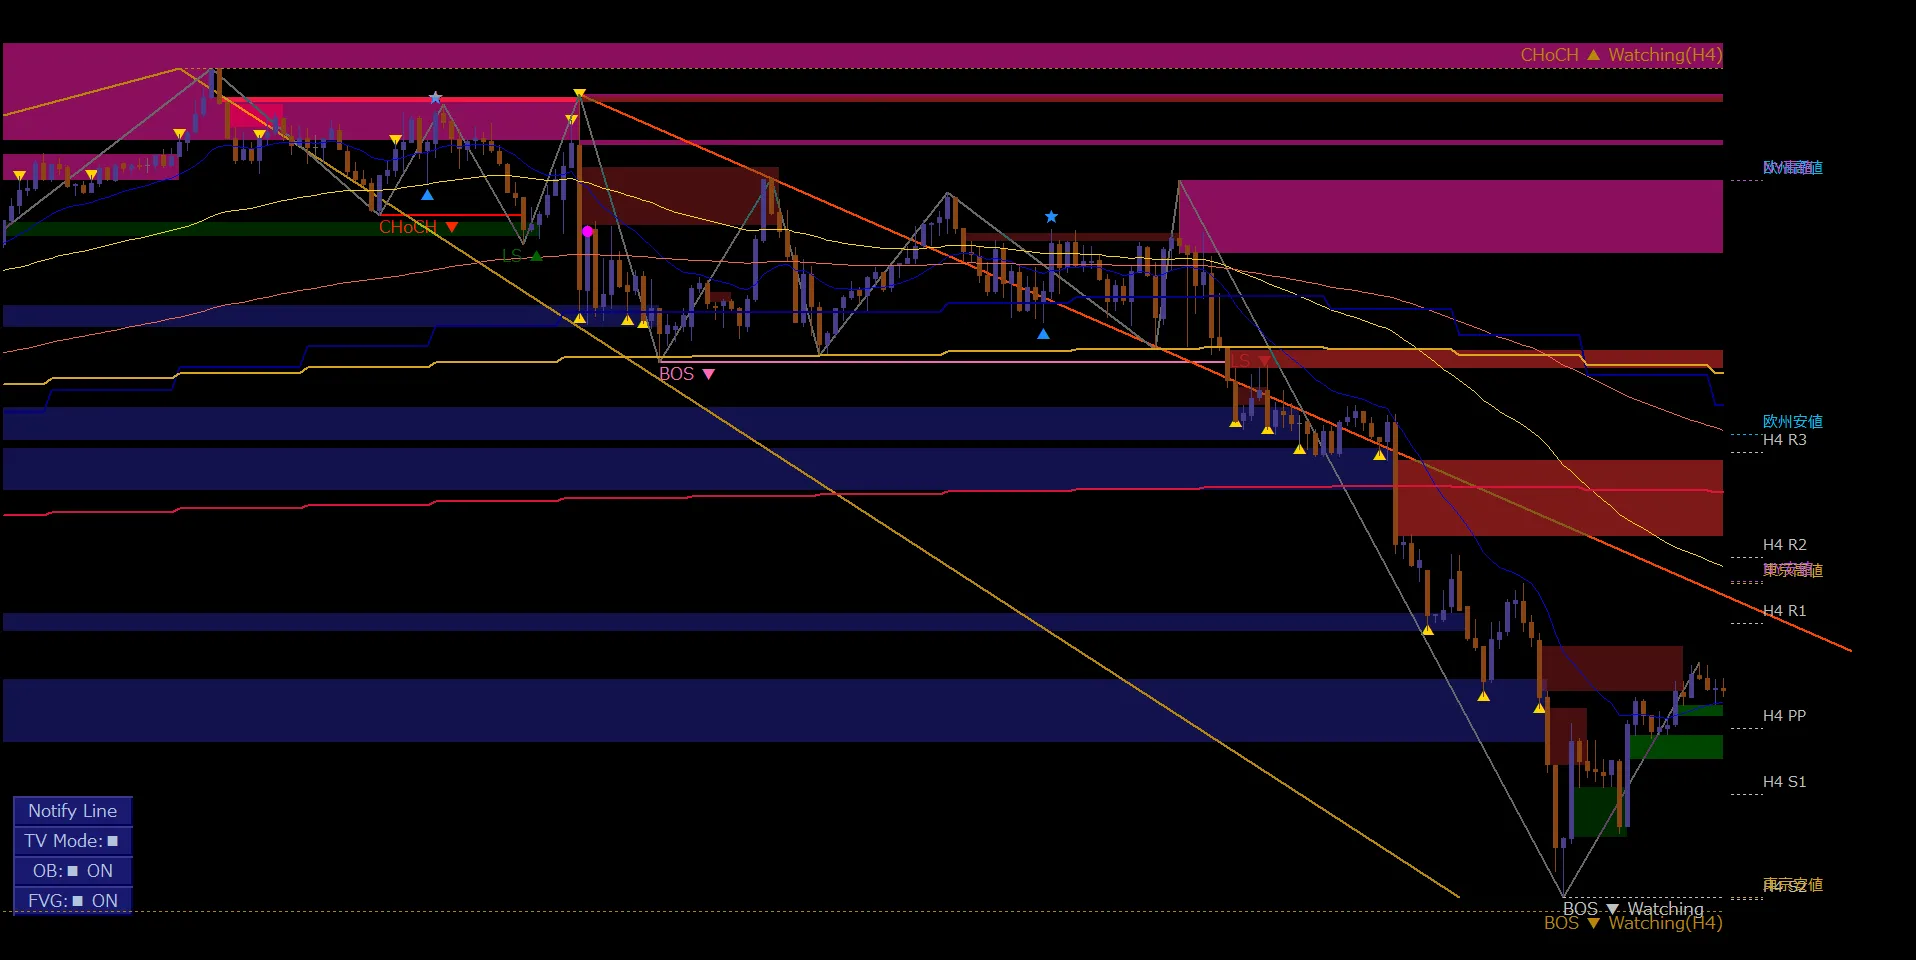
In the late stage of the decline, just below Tokyo’s intraday low, there is a potential level for theBOS▼ Watching on the higher timeframe (H4).
Price rebounds near the higher-timeframe structural level, temporarily halting the strong decline.
Watching is a candidate indicator for monitoring the higher-timeframe structure and is not a confirmed BOS.It is important to separately view the BOS▼ confirmed on the 15-minute chart and the unconfirmed Watching on the 4-hour chart
It is important to separately view the BOS▼ confirmed on the 15-minute chart and the unconfirmed Watching on the 4-hour chart.
Note that the subject of this article is not an exit strategy.
Rather than treating Tokyo low as a pre-set take-profit target,it discusses example levels where the higher-timeframe structural candidates appear near where the decline paused.
05 / PRACTICAL CHECK
Four perspectives to judge a range market
While a range is a time when the direction is unclear,it is also a time to determine which levels provide support/resistance and what break would change the situation.
By combining CHoCH, BOS, and higher-timeframe MA, you can evaluate price movement in stages.
06 / DOWWAVE MARKER
Assess market structure and read inside the range
DowWave Marker (DWM)is a discretionary trader’s environment-recognition indicator that focuses on Dow Theory-based visualization of Dow waves, CHoCH, BOS, and overlays the higher-timeframe and current bars’ moving averages, market highs and lows, prior day/ prior week highs and lows, pivots, FVG, order blocks, etc., all on one chart.
In this USDCHF/M15,structure change → range supported by higher-timeframe mid-term MA → BOS confirmation → break below the higher-timeframe long-term MA for a strong drop is organized on a single screen.
07 / 14-DAY FREE TRIAL
Use the 14-day free trial to learn how to read charts
See how CHoCH, BOS, and higher-timeframe MA appear on your own symbol and timeframe.
You can check this with the 14-day free trial of DWM.
Details of the product version:MT4 version/MT5 version
08 / SUMMARY
Summary: The meaning of a range changes with the relation to higher-timeframe MA
EP.08 focused on the USDCHF/M15 case where CHoCH▼ confirmation allowed the higher-timeframe mid-term MA to support a long-range, and the range persisted for a long time.
BOS▼ confirmed when breaking below the mid-term MA, and continued decline after breaking the long-term MA with a strong momentum candle.
What matters is not a simple rule like “sell when CHoCH appears” or “sell when the range breaks,” butto verify the higher-timeframe MA, Dow Wave structure, and candlestick momentum in order.
See the Structure. Follow the Trend.Assess market structure and align with the trend.
※ The market highs/lows and higher-timeframe Watching shown in the charts are displayed at the right edge of the chart. It does not necessarily mean the same levels or labels appeared at all past times.
※ DowWave Marker is a tool to aid market analysis and does not guarantee future price movement or profits. Please make investment decisions at your own risk.