
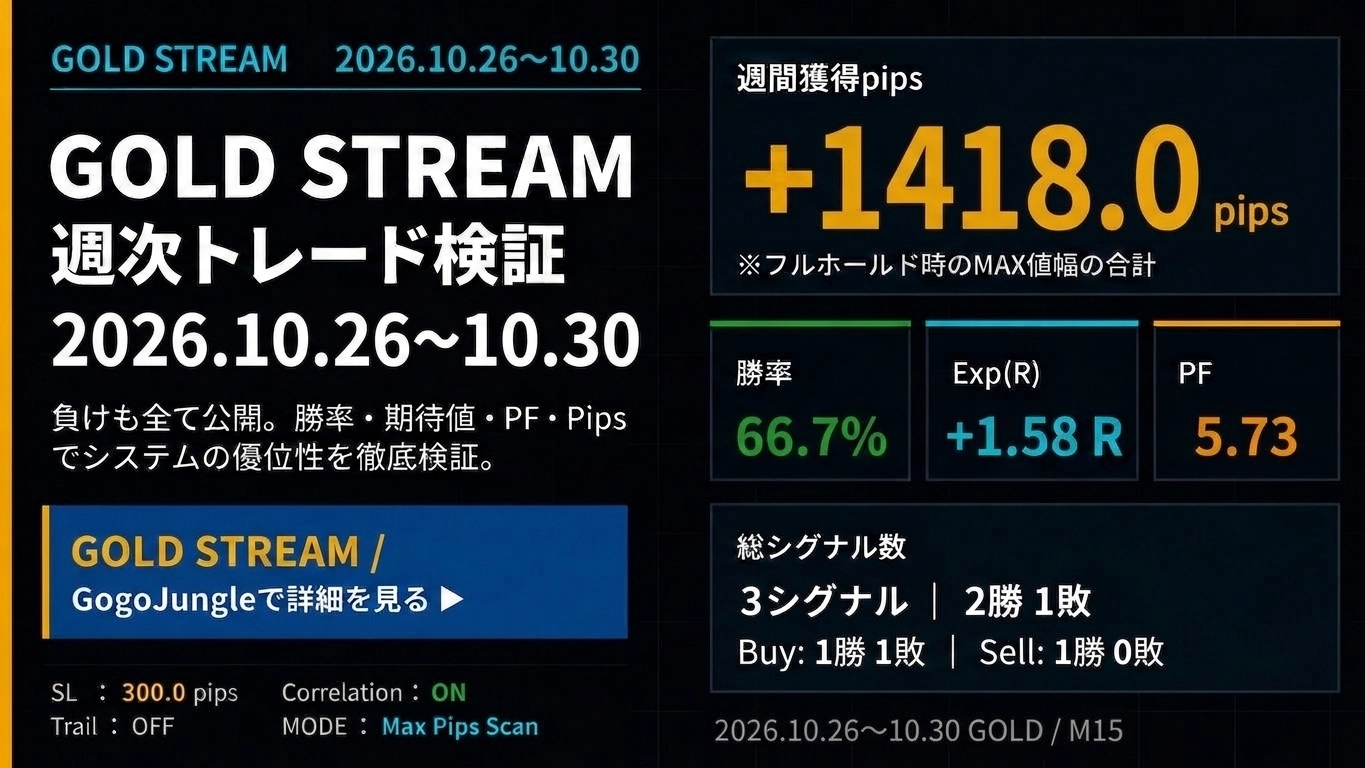
★+1418 pips【Weekly Trade Verification & Distribution History】GOLD Day Trading Specialization "GOLD STREAMv2" 2026.10.26~10.30
+1418pips【Weekly Trade Verification & Delivery History】
GOLD Day Trading Specialization "GOLD STREAMv2" 2026.10.26~10.30
Review GOLD's price movements, strength, and correlations, and verify signal accuracy, range, and expected value weekly. Not only win rate but also PF, Exp(R), and 5-day ADR comparisons are included to evaluate this trading environment.
① GOLD Market Analysis
1. Price Fluctuation
- From the start to the middle of the week, price action remained in a tight range between resistance and support, lacking a clear direction.
- From the latter part of the week to the weekend, selling pressure surged, forming a sharp decline trend that broke major downside support levels one after another.
- The rapid decline toward the weekend created a strong directional move, resulting in a large bearish candle with a dynamic price range in a short period.
5-day ADR618pipswas recorded, making for a highly attractive volatility environment to capture market turning points and trend acceleration.
2. Demand/Supply & Investment Factors
- U.S. Treasury yields and a strong dollar dampened the gold asset with no interest, helping to suppress upside moves.
- Profit-taking and long-position selling accumulated at high prices, shifting the supply-demand balance toward the downside rapidly.
- Central banks' willingness to buy as a medium- to long-term support remains, but short-term funds flowed out in risk-off reversals, favoring selling.
3. Investment Trend
- In gold ETFs and futures markets, price volatility widened, activating short-term traders to adjust or close positions.
- Using the 618pips ADR, capital for breakout-oriented day trades chasing declines surged.
- Contrarian buying on dips was pruned one after another, while momentum-driven selling strategies aligned with objective signals remained favored by market participants.
4. Overall Assessment
This week's GOLD market was“from a range-bound, directionless first half to a dramatic late-week sharp downtrend”.
Ignoring early noise with unclear direction, using proper filters to suppress unnecessary entries, and accurately capturing the late big trend wave was the key factor in determining success or failure.
⑤ SILVER / COPPER Market
SILVER
SILVER market: Silver fully synchronized with GOLD’s sharp decline, with strong selling pressure across precious metals driving downside moves.
COPPER
COPPER market: Copper prices faced resistance due to global economic slowdown concerns and dollar dynamics, showing narrow, directionless moves.
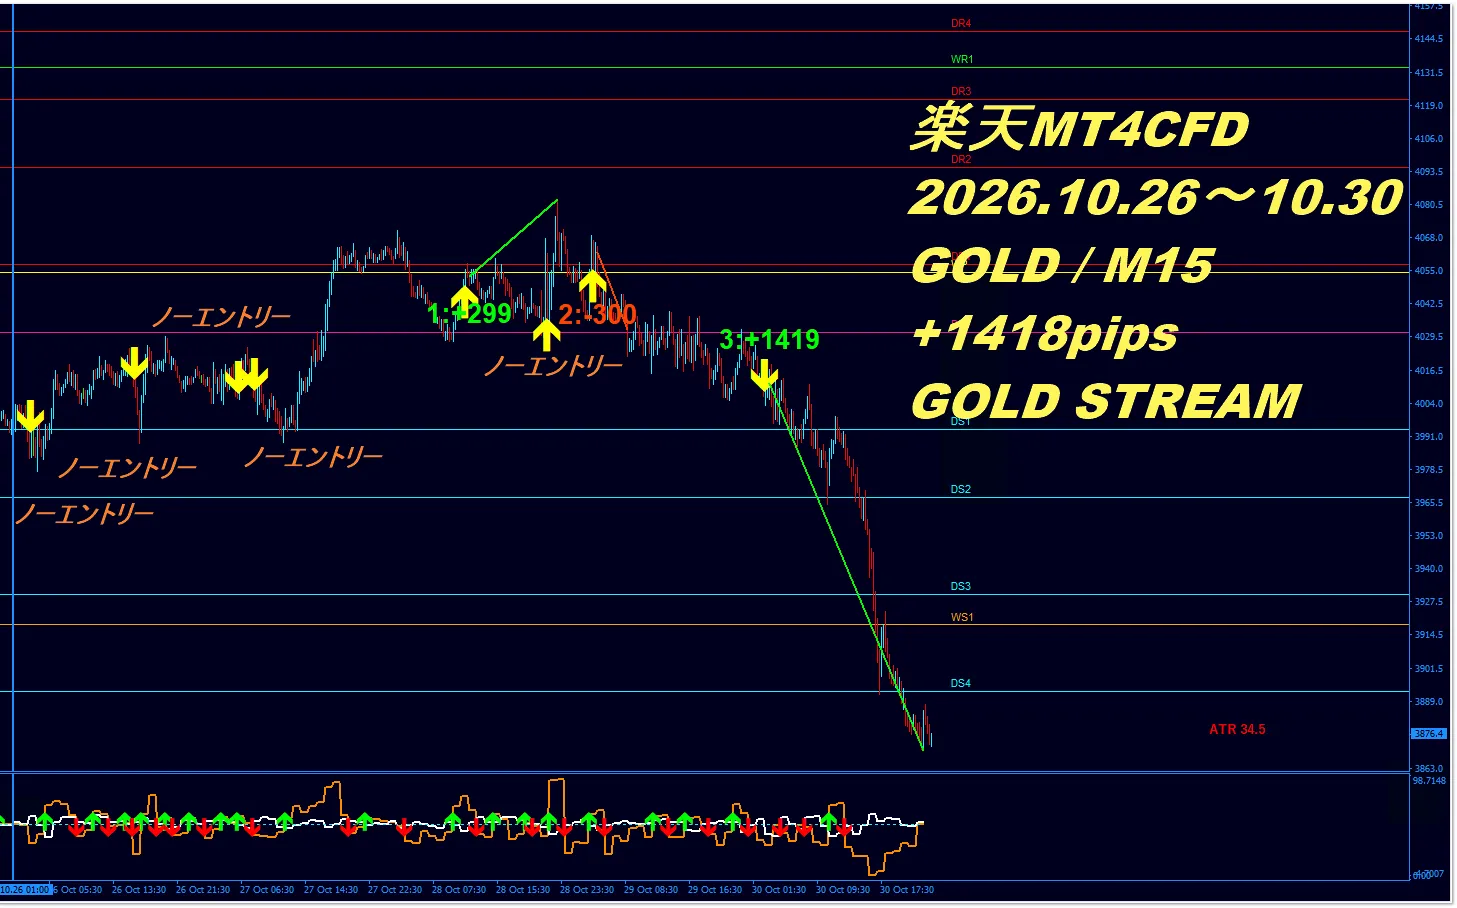
② GOLD STREAM v2 Weekly Trade Verification
Weekly verification results
③ GOLD STREAM v2 Delivery History
Weekly Signal Delivery History
(10/26~10/27 VPS shutdown for security measures, delivery off)

④ Weekly Verification AI Evaluation
This time5-day ADR 618pipsprovided a sufficiently wide range environment to thoroughly evaluate the accuracy of the correlation-filter rejections and the precision of trend-capturing entry signals based on panel and chart data.
■ Signal Judgment and Entry Precision
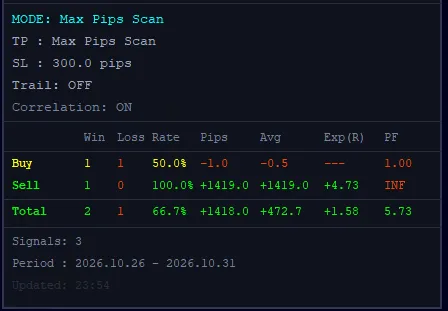
The verification panel (2026.10.26 - 2026.10.31) recorded a total of 3 valid signals (Buy 2 times, Sell 1 time), yielding2 wins, 1 loss; win rate 66.7%.
Breakdown: Buy had 1 win and 1 loss (-1.0pips), Sell had 1 win and 0 losses (+1419.0pips), for a total Mapped Pips of+1418.0pips(average +472.7pips). The strong capture of massive profits by Sell signals was achieved by perfectly catching the huge late-week downtrend with ADR 618pips.
Also, as clearly indicated on the chart, no-entry signals due to correlation mismatch were accurate5 timesand helped prevent unnecessary entries in indecisive situations.
This week's performance showedWin rate 66.7% • PF 5.73 • Exp(R) +1.58Ra superb performance with high profitability and reliability.
Profit Factor (PF) reached5.73due to strictly controlling losses in losing trades with fixed SL, while winning Sell trades earned a massive +1419.0pips, creating an ideal small-loss, large-profit structure.
Also, the expectancyExp(R) +1.58Rdemonstrates robustness as a system that reliably yields 1.58 times return per 1 unit of risk.
■ Strengths, Weaknesses & Correlation Analysis Evaluation
In the early to mid-week period, within a challenging correlation environment with unclear direction, the strength and correlation analysis (Correlation: ON) filter functioned solidly.
In moments of hesitation, the mismatch signals were5 timesappropriately skipped, forming the foundation for avoiding unnecessary stop-outs and achieving a total +1418pips win. This reflects the high accuracy of risk management features.
■ MAX Pips Scan & SL Discussion
The chart used this time isMODE: Max Pips Scan / Correlation: ON.
The displayed pips represent the MAX value when the post-signal price movement was fully held.Therefore, +1418pips does not guarantee actual filled profits.Also, the decision for stop-loss (SL) is based on
the 4-hour chart; SL is not determined solely by short-term movements on the M15 chart.
■ GOLD Market Difficulty
★★★★☆ 4 / 5
Although the 5-day ADR of 618pips provides range, the transition from early-week consolidation to late-week sharp decline required a high degree of discernment to identify trend reversals.
■ GOLD STREAM Weekly Trade Verification Evaluation
★★★★★ 5 / 5
In a market with difficult consolidation and weekend plunge, five rejection signals due to correlation mismatch were applied accurately,Win rate 66.7% • PF 5.73 • +1418.0pips gaineda very high-quality outcome.
The tool's excellent filter performance and explosive profit potential are fully demonstrated, earning the maximum rating (5 stars).
■ AI Comprehensive Commentary
This week's verification results show that GOLD STREAM v2 possesses strong correlation-filtering and trend-capturing capabilities. By skipping unnecessary entries five times in indecisive moments and riding the ensuing trend to over +1,400 pips, an ideal trading outcome was achieved.
Without being swayed by emotions, this tool is the perfect partner for those who want to trade day-by-day with evidence-based system criteria.
With GOLD STREAM v2's superior risk management and outstanding performance, why not elevate your trading results to the next level?
Verification data evidence
Want to ride GOLD's trend?
“It’s rising, but I don’t know if I should enter now.”
“I can’t judge where to enter.”
“Price moves are too volatile; entering feels scary.”
In markets with wide price ranges like GOLD, it’s important to have criteria for entering or staying out by checkingWin rate, PF, Expectancy, Strength, and Correlationinstead of chasing by sensation alone.
GOLD STREAM v2 specializes in GOLD day trading, and supports entry decisions while confirming market strength and correlations.
View GOLD STREAM v2 product page Ask a questionRelated Articles
If you want to learn more about trading concepts and GOLD trading, click here.
- 【Video】Last 3 months performance | GOLD STREAM signals price action 2026 July–Sept
- The only reason why results aren’t coming
- Why trading ends up as “slow and steady wins”
- 【Unveil the tool’s true performance】 GOLD STREAM dedicated win/loss analysis tool verification results
- Conclusion: GOLD (XAU/USD) can be traded in domestic FX accounts.
The verification results and figures presented in this article are reference information based on historical market data and do not guarantee future profits or similar results.
The pips and P/L data shown are based on the maximum price range reached after an entry signal (MAX value) and are calculated with fixed stop loss (SL) settings. These represent the MAX value if post-signal price movements were fully held, not actual filled profits or realized trades.
Actual profit and loss depend on entry and exit timing, spreads, slippage, trading fees, execution environment, position size, take-profit/stop-loss judgments, and market conditions. SL judgments are based on the 4-hour chart and may vary with actual trading conditions.
Additionally, due to differences in trade conditions and price delivery across brokers, exchanges, and trading platforms, actual prices, pips, P/L, and trade results may differ from the published data. Consequently, there may be discrepancies between published data and actual trading performance.
This data serves as a reference for evaluating the edge of GOLD STREAM v2 signals and market analysis accuracy. Final trading decisions should be made by you, considering your financial situation, risk tolerance, and trading environment, and are your responsibility.