

[Oct 31 Night USD/CHF] Moves within the range 0.8193–0.8255 and ends Friday at 0.825 — Market structure and latest targets seen on LIGHTHOUSE
About LIGHTHOUSE
LIGHTHOUSE (Lighthouse) automatically displays the “reading” part of the chartA discretionary trading support indicator.
・Shows the direction of the higher timeframe and the current bar in the upper left of the chart in five levels
・Automatically displays the lines for high/low updates (HH/HL/LH/LL) and BOS/CHoCH
・Displays pullback and retracement zones, support-resistance reversal zones, and the range box
・The marks for peaks and troughs are attached after confirmation and do not move or disappear later (no repaint)
・Since the meanings of terms are displayed at the lower left of the chart, you can learn as you watch
Use this as a tool to assemble the basis for your trading decisions at a glance while you make your own judgments.
【Key Points】Dollar Swiss currency pair market memo up to the close on Friday, October 30
・From the high on October 140.83943to the low on the 22nd0.81909it fell, then retraced to the high on the 28th0.83125to0.83125
・The close on Friday, October 30 is0.82487(high 0.82549 / low 0.81931 on that day)
・Upper targets are0.82549・0.82969, lower targets are0.81931・0.81909, which are the price zones that tend to be watched first
1. Recent market feel (Weekly, Daily, 1-hour)
Weekly: From the week of October 12, close prices at 0.82390, 0.82483, and 0.82487 remain at the same level
Weekly closes were 0.82832 for the week ending September 21, 0.82838 for the week ending September 28, 0.82936 for the week ending October 5, 0.82390 for the week ending October 12, 0.82483 for the week of October 19–23, and 0.82487 for the week of October 26–30. For the week of October 26–30, the high was 0.83125 and the low was 0.81931, ending at roughly the same level as the previous week’s close.
Daily: After retracing to 0.83125 on the 28th, it fell to 0.81931 on the 30th and closed at 0.82487
On October 22 (Thu), it hit a low of 0.81909 and rose to 0.82029; on October 23 (Fri) it moved between 0.81911 and 0.82552 and closed at 0.82483. On October 26 (Mon) it moved between 0.82234 and 0.82781 and closed at 0.82749; on October 27 (Tue) it moved between 0.82598 and 0.82941 and closed at 0.82894; on October 28 (Wed) it moved between 0.82749 and a high of 0.83125 and closed at 0.82795. On October 29 (Thu) it moved between 0.82386 and 0.82969, closing at 0.82419; on October 30 (Fri) it moved from a low of 0.81931 to a high of 0.82549 and closed at 0.82487.
1-hour: From 0.81931 at 4:00 on the 30th, it retraced to 0.82549 by the afternoon
On the 28th, after hitting a high of 0.83125 in the 10:00 hour, it declined; on the 29th, the high was 0.82969 at 3:00 and the low was 0.82386 at 23:00, ending at 0.82419. On the 30th, after the 4:00 low of 0.81931, it fell to 0.82021 by 14:00, then retraced to end at 0.82549 in the evening, with 0.82487 at 23:00. The 0.81909 low on the 22nd was not violated on the 30th either.
Price ranges that tend to be watched (chart-based facts)
| 0.83125 | High on the 28th (10:00 hour) |
| 0.82969 | High on the 29th (3:00 hour) |
| 0.82549 | High on the 30th (18:00 hour) |
| 0.82487 | Close on October 30 (Fri) |
| 0.82021 | Low in the afternoon on the 30th (14:00) |
| 0.81931 | Low on the 30th (4:00 hour) |
| 0.81909 | Low on the 22nd |
Because data releases and speeches from notable figures can cause large price movements, please check the schedule yourself. The numbers in the text are values up to the 23:00 hour server time on Friday, October 30.
2. When you view the same chart with LIGHTHOUSE
From here, we will view the same USD/CHF chart with LIGHTHOUSE applied.
Daily chart (higher timeframes on the weekly): Weekly is a “strong buy,” daily is a “sell”
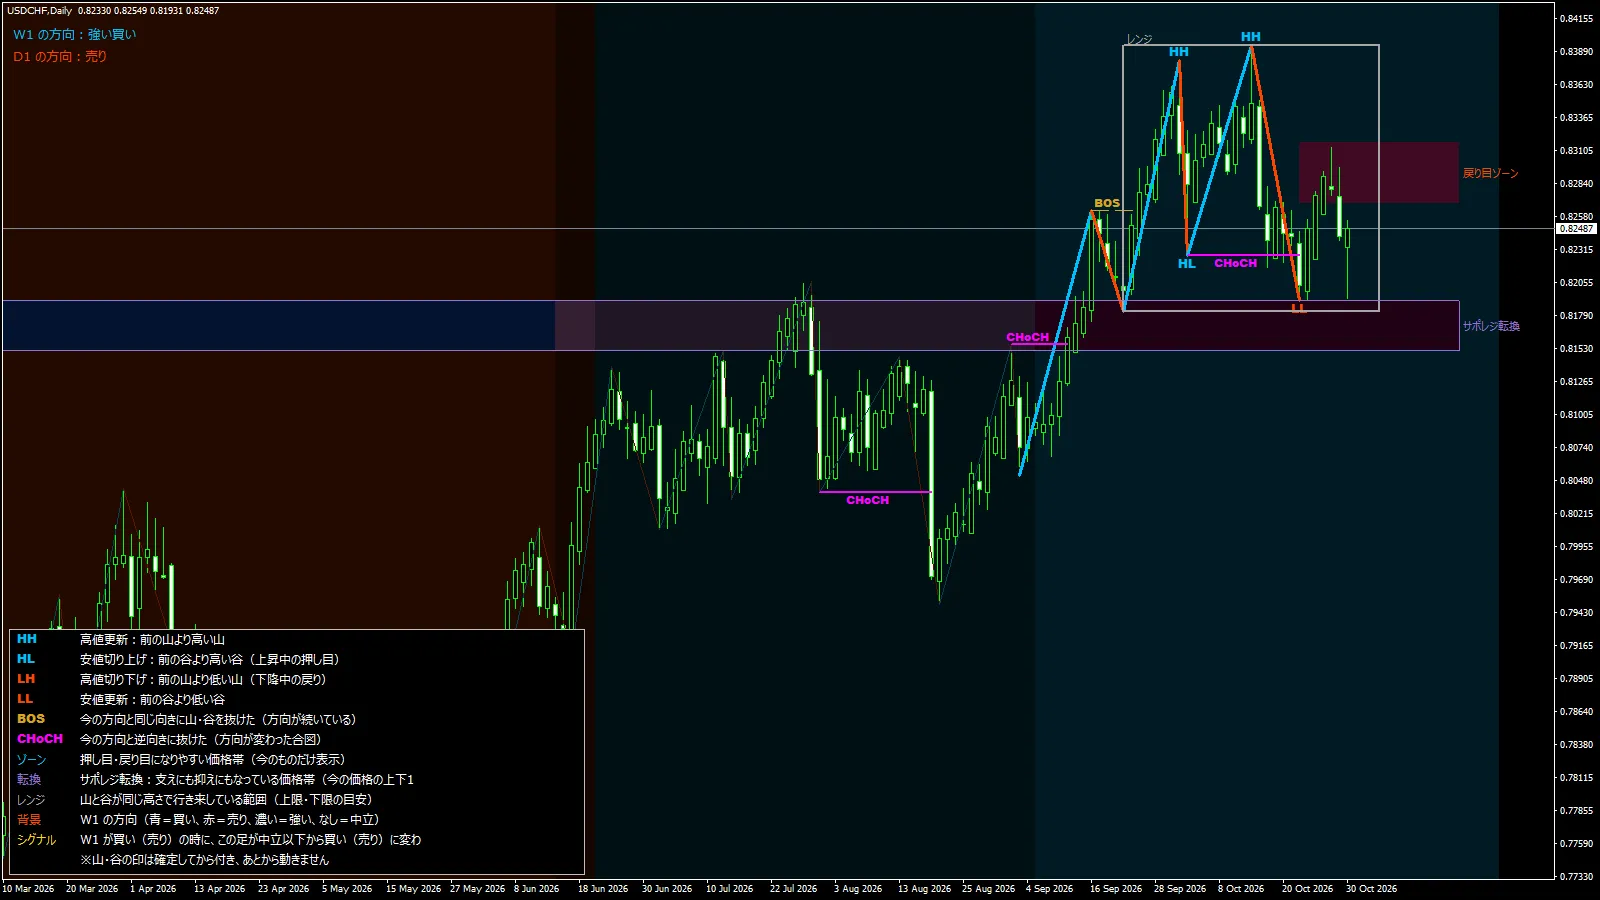
The upper left shows the direction of W1: strong buy and D1: sell. A high was recorded near the end of September and around October 14, withHH, then the low on October 22 showsLL andCHoCH appeared.
Above the price, near 0.827–0.832, there isa retracement zone, and below near 0.815–0.819 isa support/resistance reversal zone displayed. The current price sits between these two zones.
1-hour chart (daily is the higher timeframe): daily is “sell,” 1-hour is “buy”
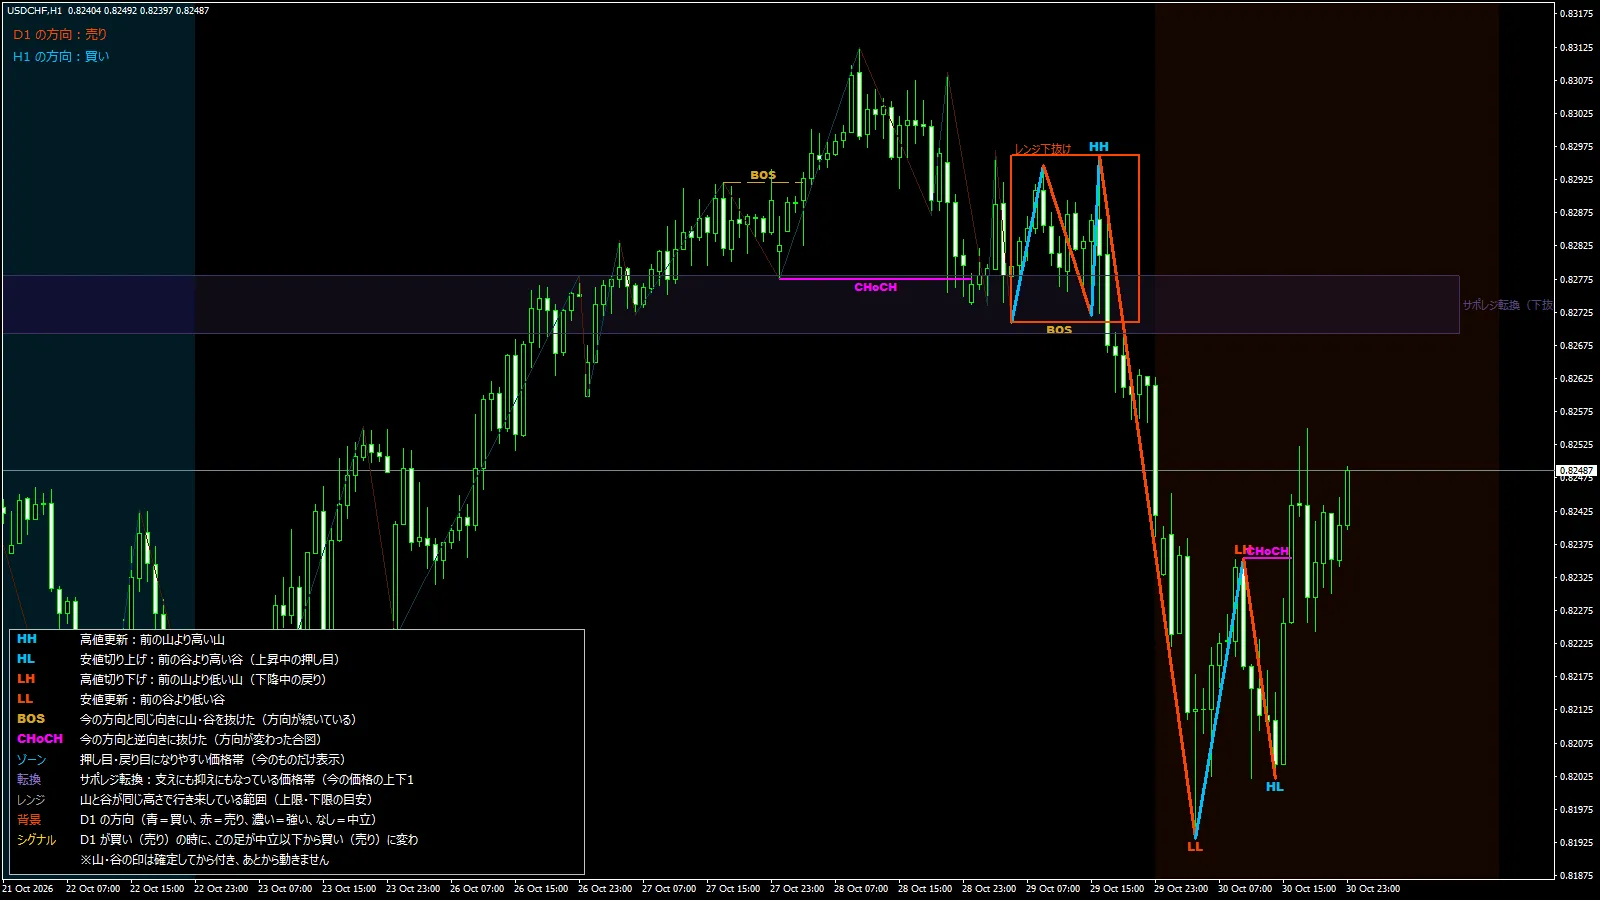
Upper left shows “D1 direction: sell” and “H1 direction: buy.” From the low of 0.81931 on the night of the 29th to the 4:00 hour on the 30th,LL appeared, followed by a peakLH, a troughHL occurred, andCHoCH also appeared.
Above the price, around 0.8270–0.8278, there isa support/resistance reversal zone. This is a situation where the higher timeframe and the current bar’s direction diverge.
5-minute chart (higher timeframe is 1-hour): both the 1-hour and 5-minute charts indicate “buy”
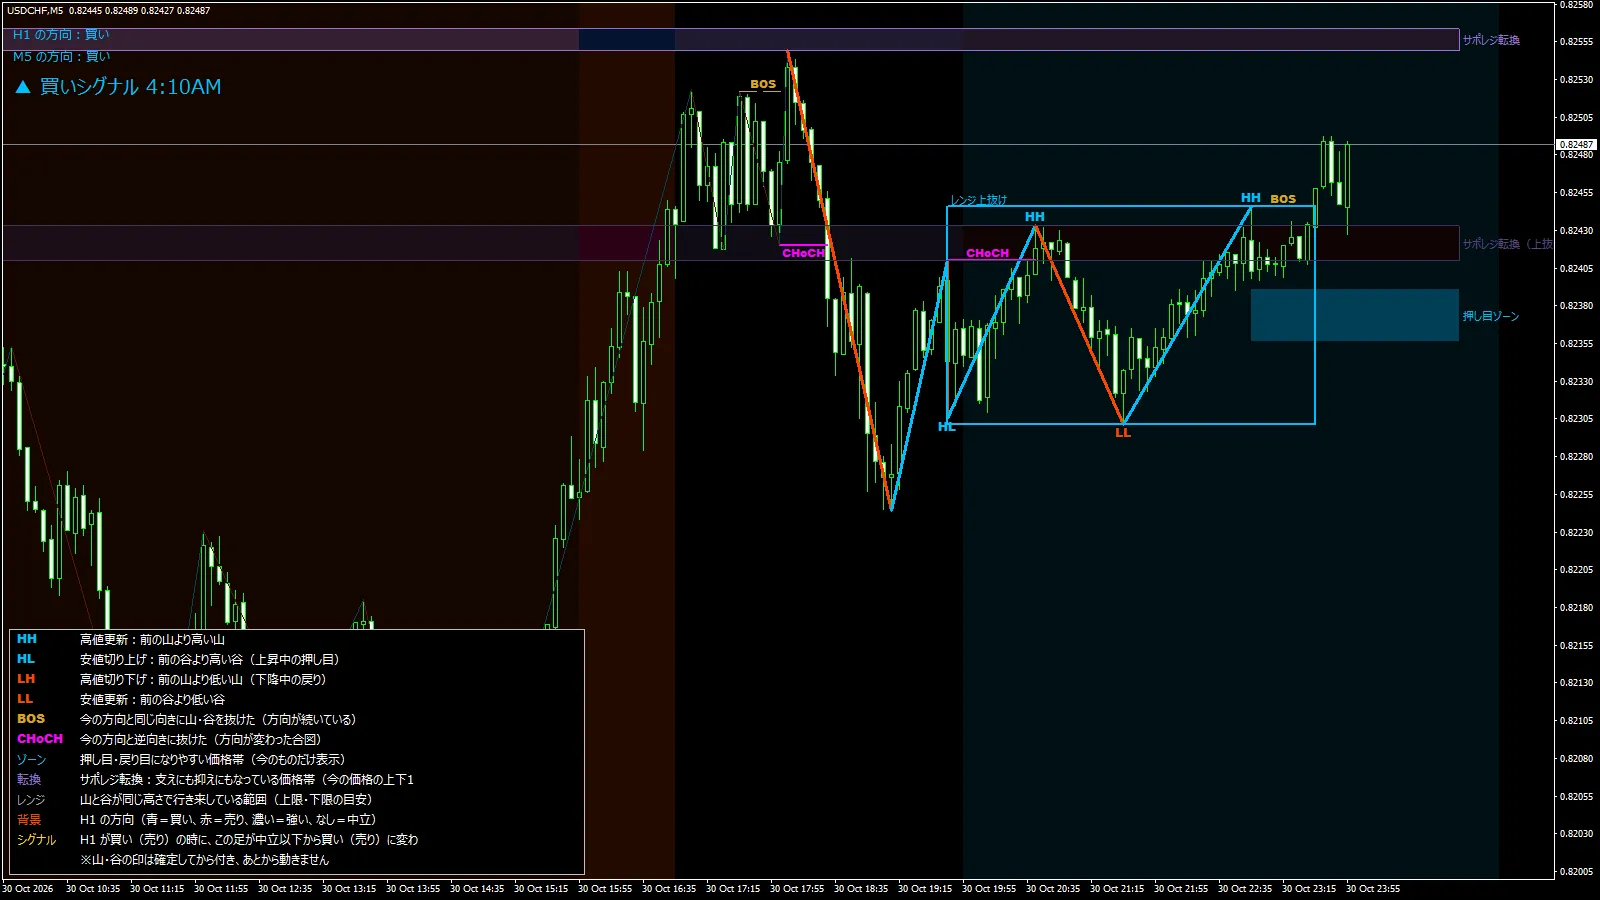
The upper left shows “H1 direction: buy” and “M5 direction: buy,” with a “buy signal 4:10 AM” also displayed. On the night of the 30th, in the trough there isHL andLL, and in the peak there isHH, withBOS also appearing.
Below the price, there are around 0.8241–0.8243 fora support/resistance reversal zone and around 0.8236–0.8239 fora pullback zone, and above around 0.8254–0.8255 there isa support/resistance reversal zone. When the directions of the higher timeframe and the current bar align, you can observe which bar’s movement shifts first.