
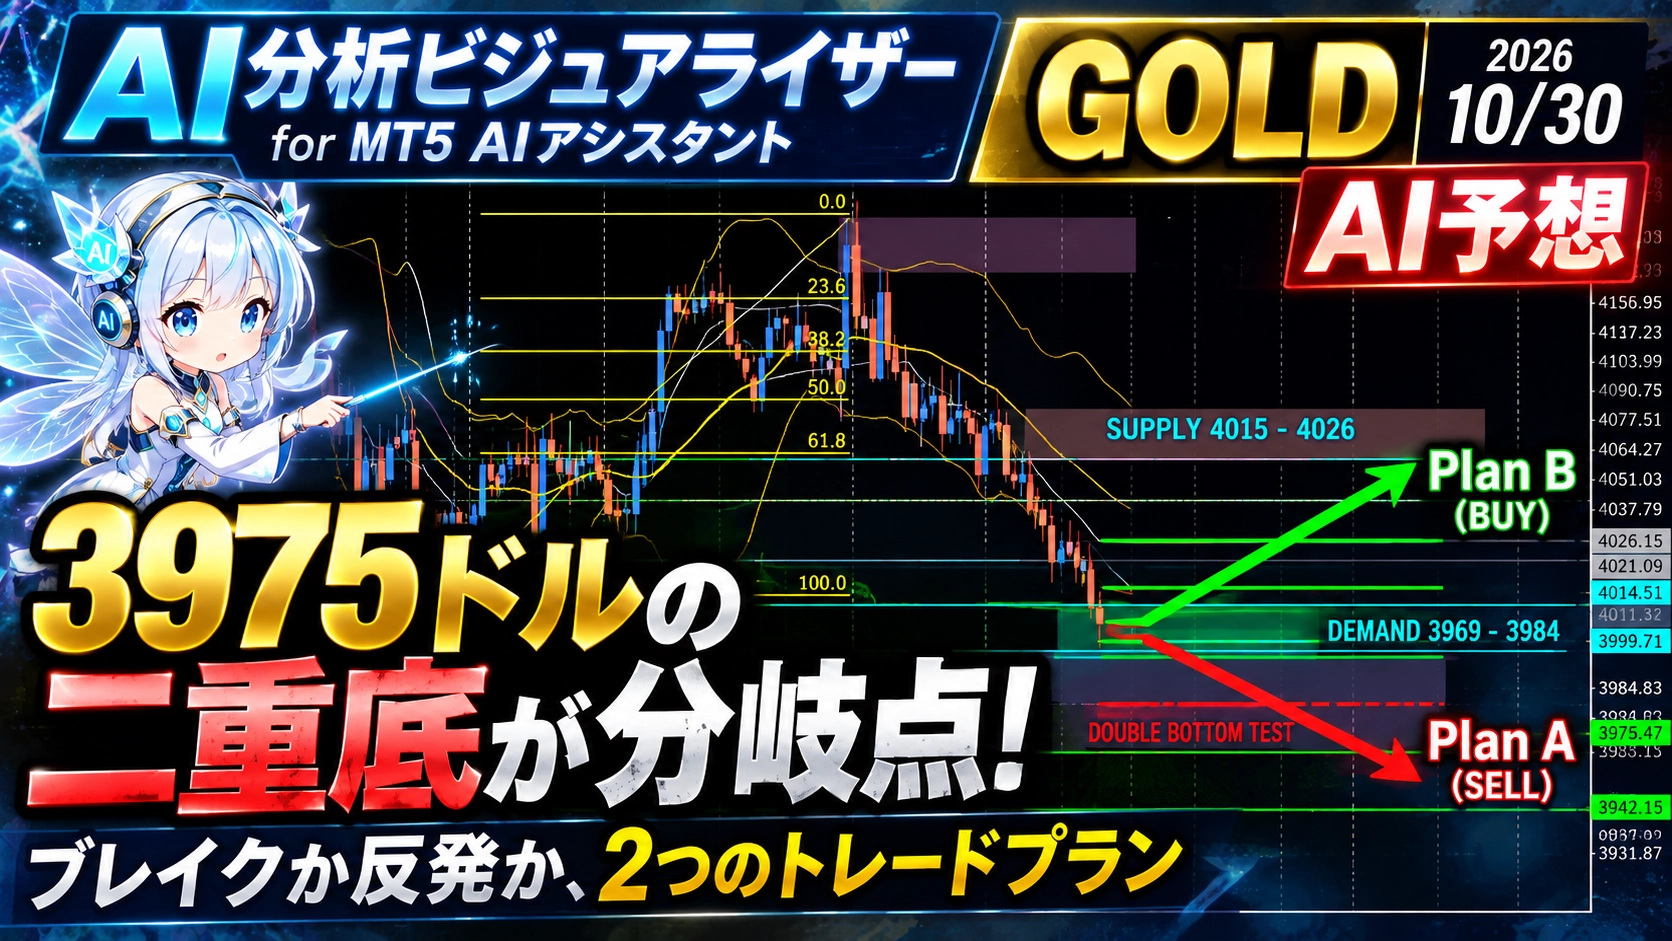
[GOLD AI Forecast] The Double Bottom at 3975 Dollars Becomes the Turning Point! Two Trade Plans: Sell and Buy | October 30
?This article was posted on October 30, 2026 ⇒Latest related articles?
This article introduces the results of visualizing market analysis by MT5 AI Assistant usingAI Analysis Visualizerthrough it. It is an forecast based on AI analysis of chart data at a specific point in time and does not guarantee future prices or profits.

? Analysis Data
- Analysis target:GOLD
- Analysis timeframe:H1
- Analysis date and time:October 30, 2026 08:48 (server time)
- Japan time:October 30, 2026 15:48
- Current value:Bid 3983.80 / Ask 3984.35
- Spread:0.55
1. Current State of GOLD
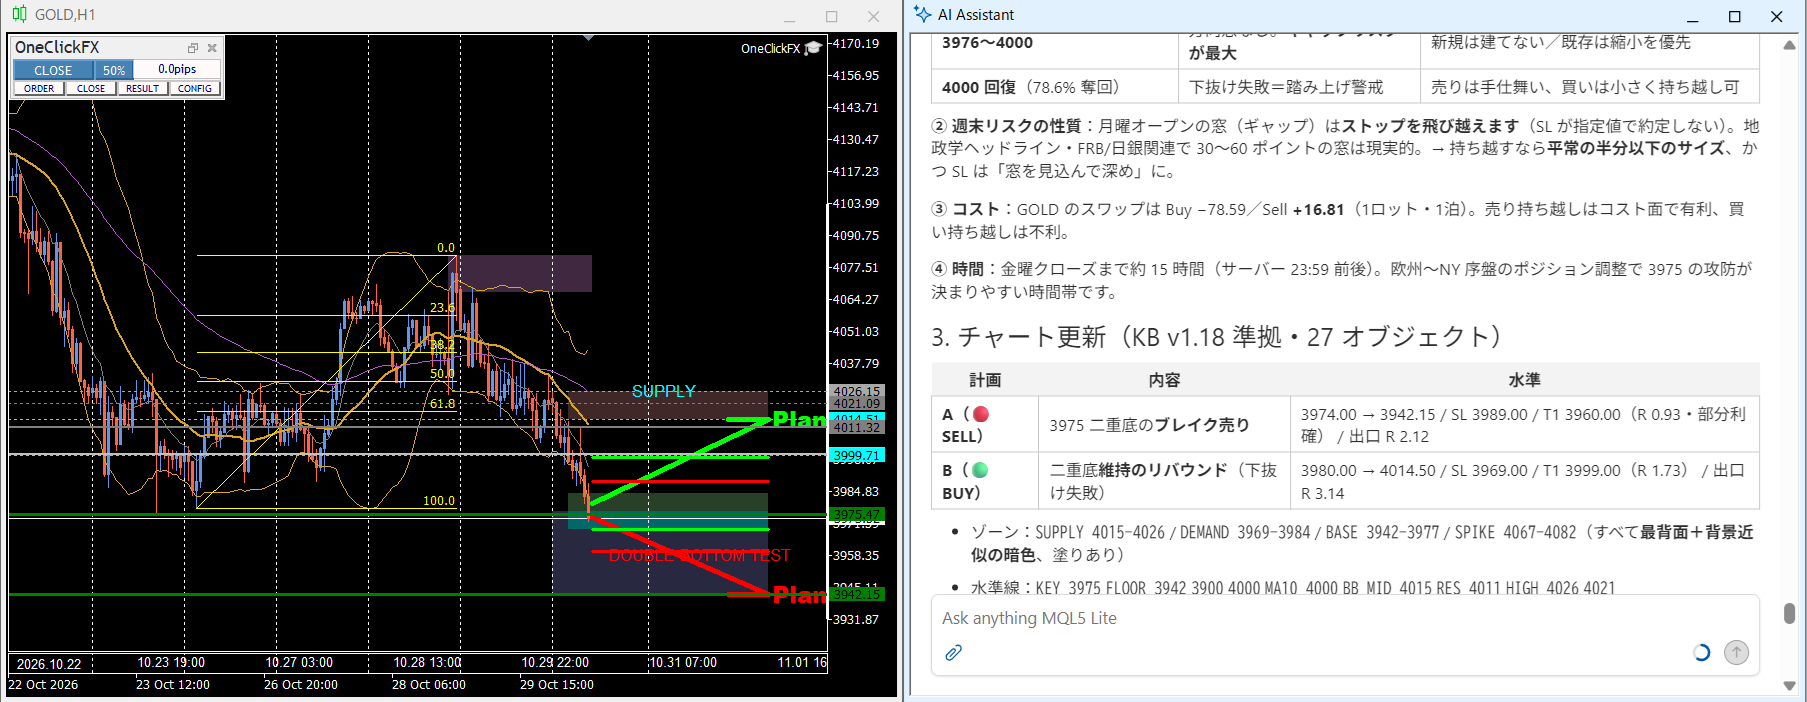
From the high of 4082.49 on October 28, it has fallen for three consecutive days.
On October 29 it dropped from 4069 to 4021.14. Today it has fallen again from 4023.43 to 3979.84.
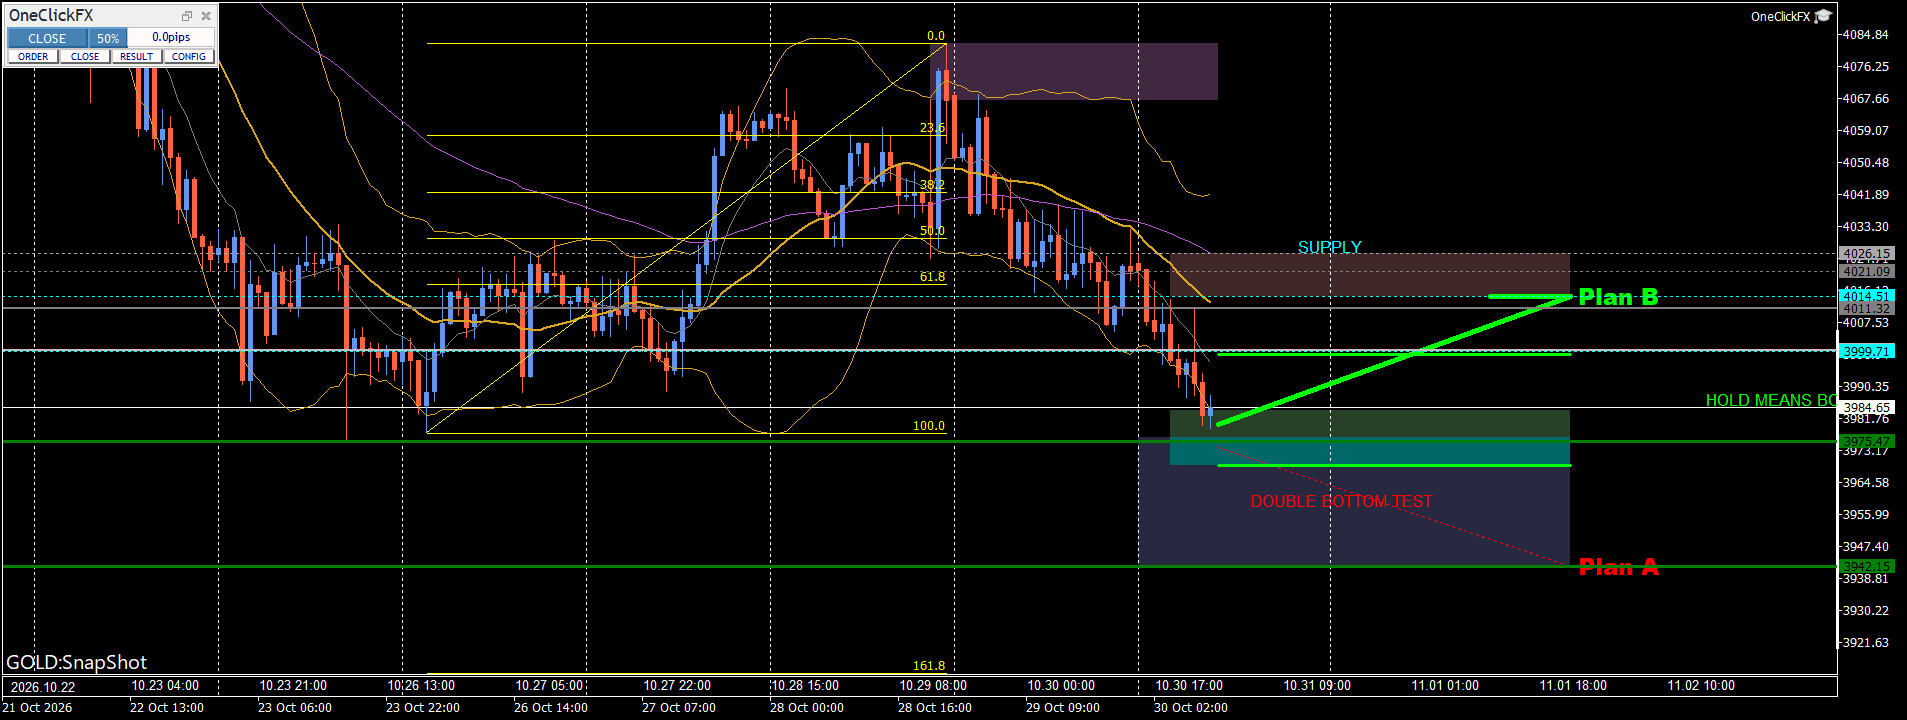
Currently, the double bottom formed by the October 23 low of 3975.47 and the October 26 low of 3977.93 is attracting attention.
The current price is about 4 dollars away from this level.
The 78.6% Fibonacci level at 4000.31 has already been broken below, indicating a bearish structure with the rebound being kept around 4000 dollars.
Also, the lower bound of the Bollinger Band at 3987.77 has been broken below. It is oversold, and be cautious as the initial move up could be fast.
Key Technical Points
- Double bottom candidate: 3975.47–3977.93
- 78.6% Fibonacci: 4000.31
- H1 MA10: 3999.71
- Bollinger Band center line: 4014.51
- Bollinger Band lower: 3987.77
- SUPPLY zone: 4015–4026
- Support targets: 3942.15, 3900
2. AI's Forecasted Trading Plan
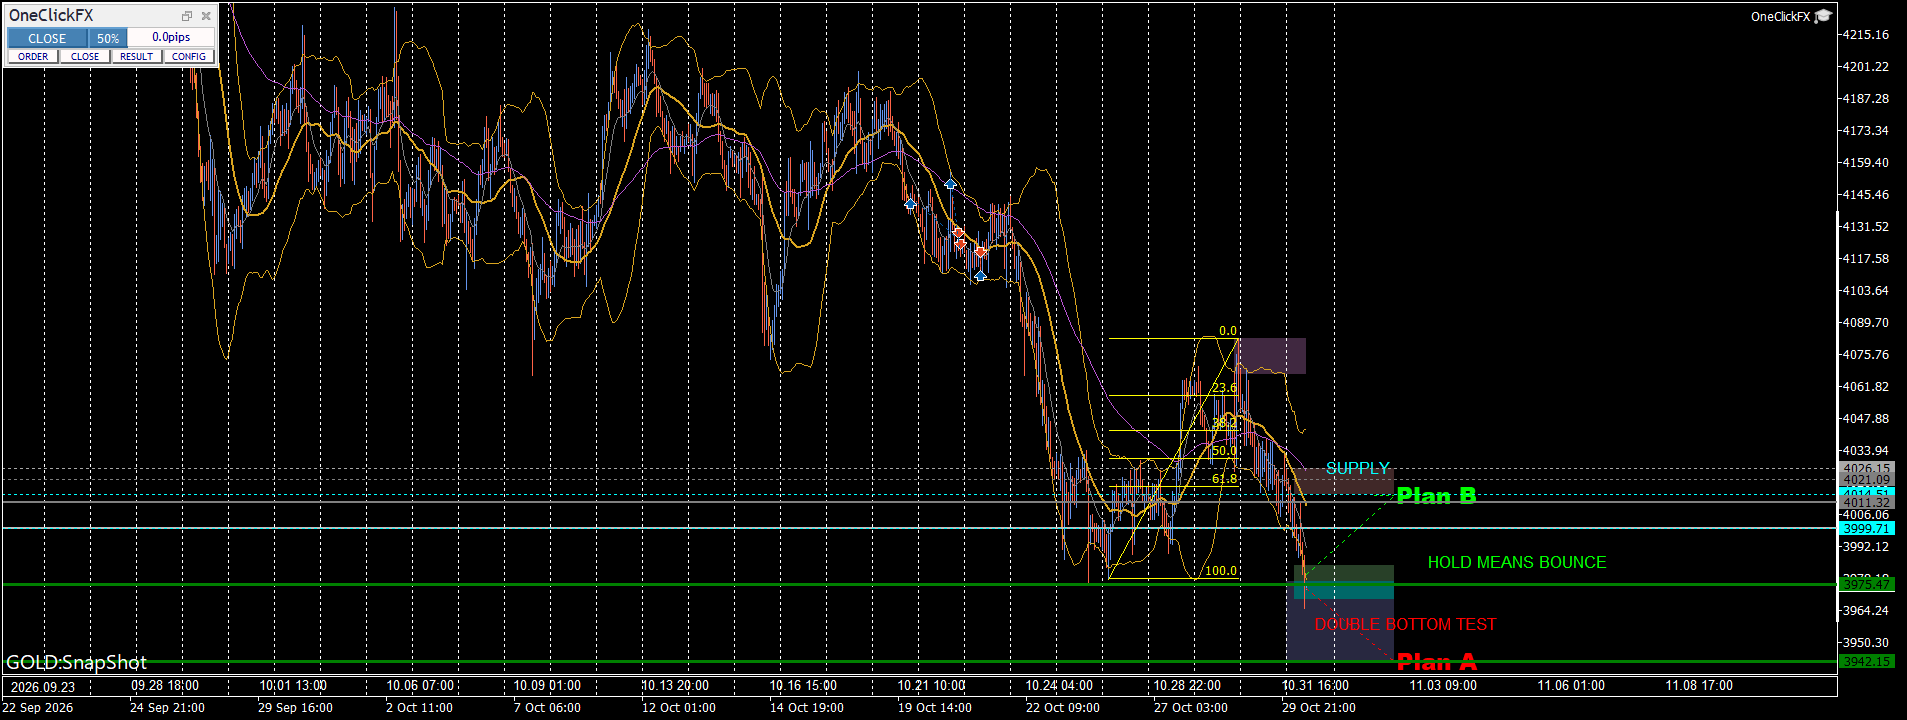
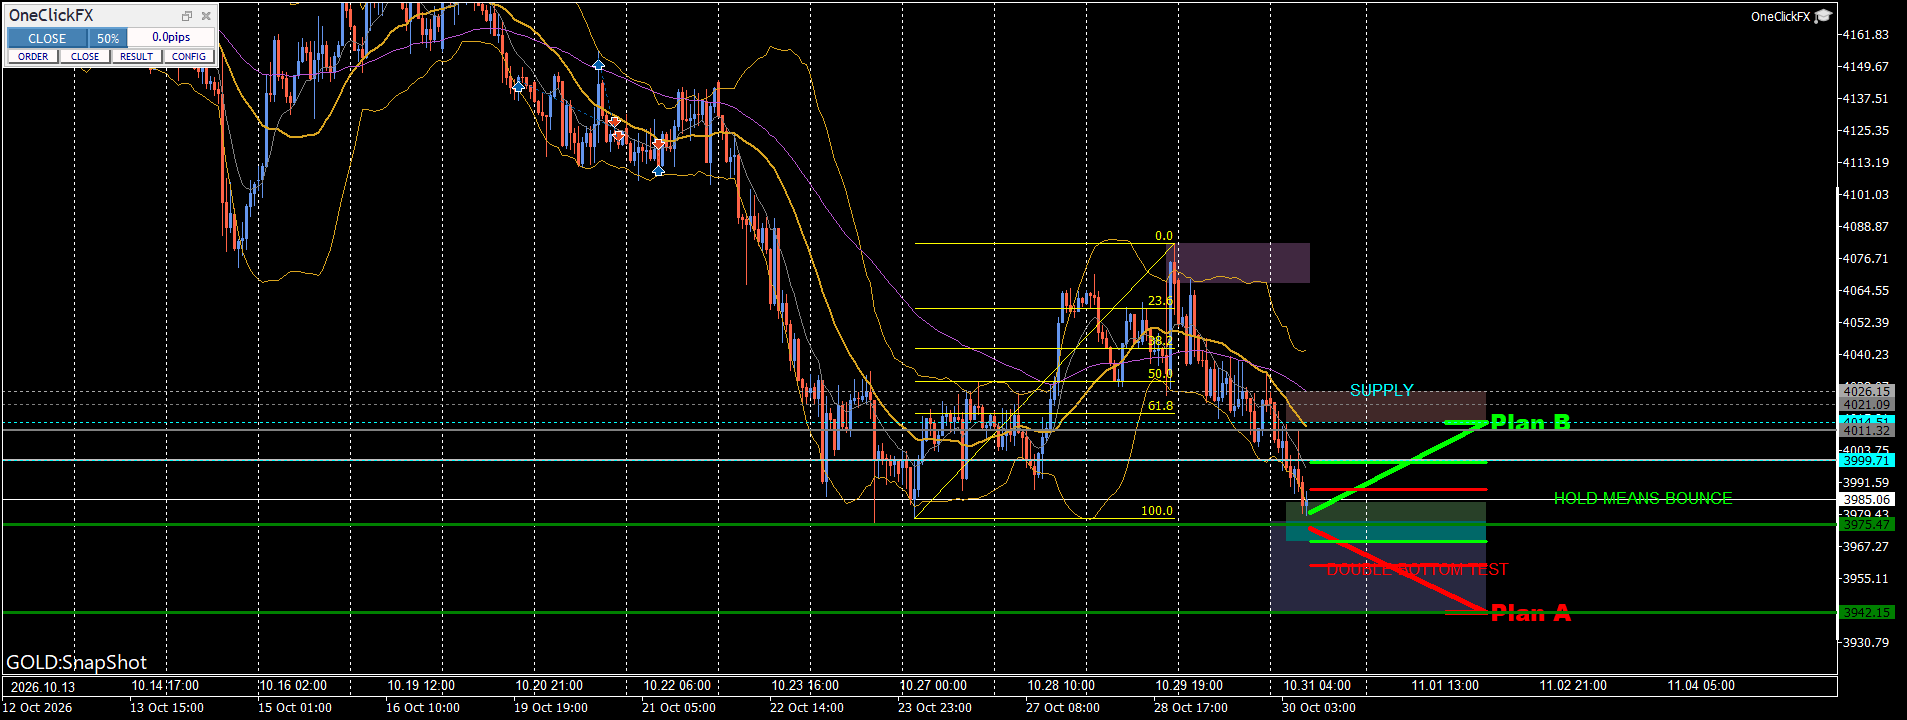
This analysis presents two scenarios: a selling scenario where the double bottom breaks, and a buying scenario where the double bottom holds.
? Plan A: Sell on double-bottom break
Sell on a break below the double bottom around 3975 dollars.
- Direction: SELL
- Entry: 3974.00
- Stop loss (SL): 3989.00
- T1: 3960.00 (partial take profit)
- Final target: 3942.15
- RR: T1 = 0.93 / Final target = 2.12
If the double bottom breaks below, a drop toward 3942.15 is anticipated.
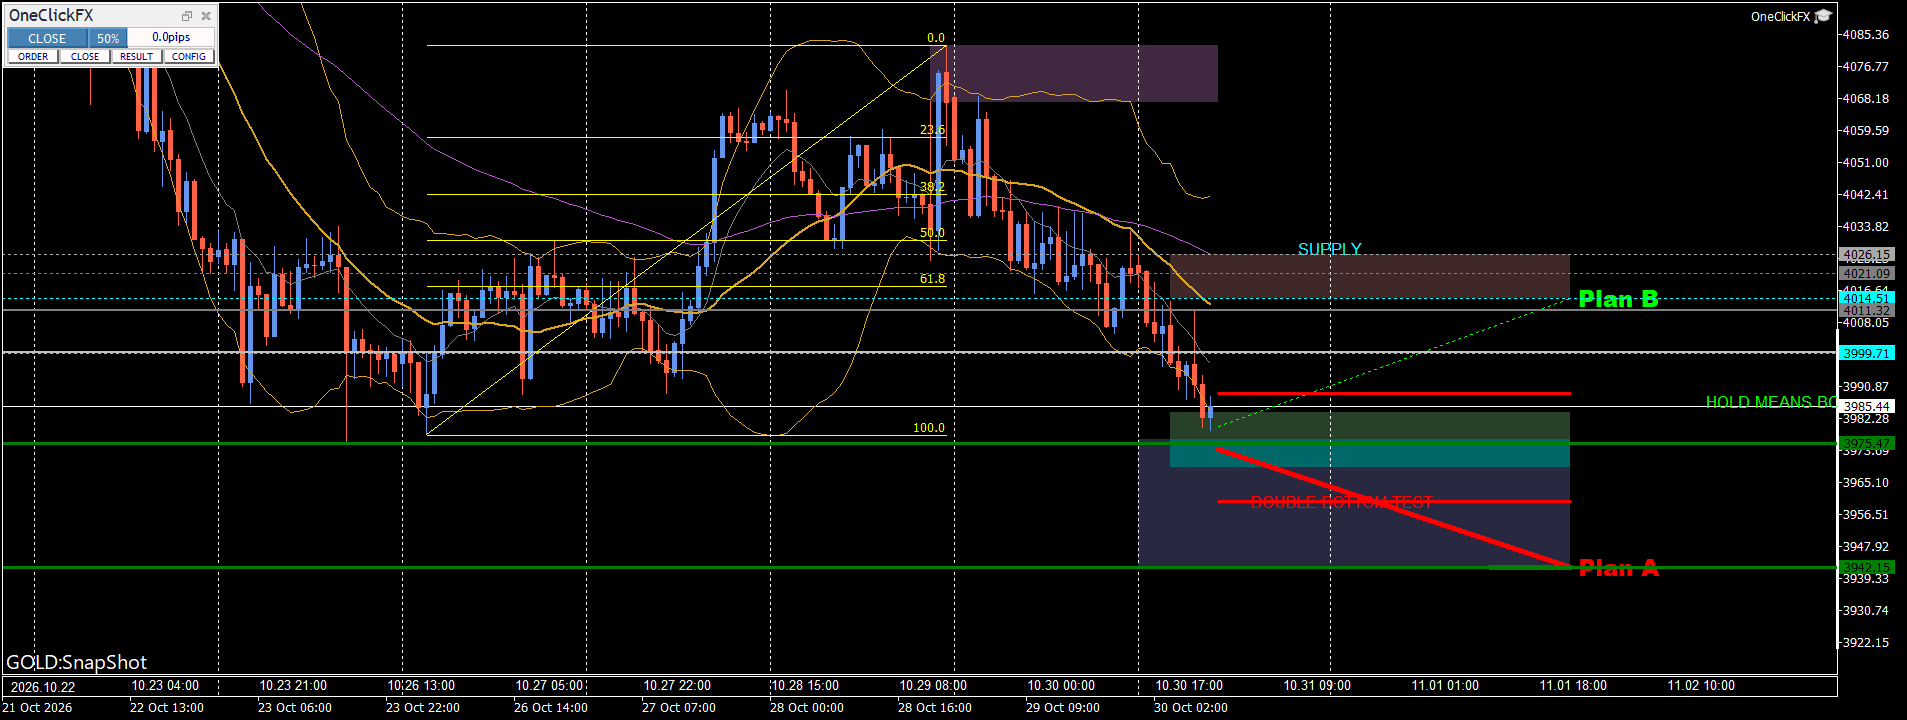
? Plan B: Buy on rebound that maintains the double bottom
A plan to buy on a rebound if the double bottom around 3975 holds and a break below it fails.
- Direction: BUY
- Entry: 3980.00
- Stop loss (SL): 3969.00
- T1: 3999.00
- Final target: 4014.50
- RR: T1 = 1.73 / Final target = 3.14
If the double bottom holds, a rebound to 3999 dollars, and then to 4014.50 dollars is anticipated.
3. Weekend Decision Points
This analysis considers three scenarios based on Friday's closing price.
1) Break below 3975
A weekly-frame break below the double-bottom candidate.
- Next targets: 3942.15 → 3900
- Sell positions: can be carried over (size halved)
- Buy positions: cannot be carried over
2) 3976–4000 dollars
Lack of clear direction.
- Gap risk is maximal
- New positions should be avoided
- Existing positions should be reduced
3) 4000 dollar recovery
A development that recaptures the 78.6% Fibonacci level.
- Be wary of a short squeeze due to a failed break
- Close out short positions
- Small carryover of long positions is possible
Weekend Notes
On Monday's open, prices may gap up or down.
If the price gaps past the stop-loss price, execution at the specified price may not occur.
If carrying over, use a position size of half or less of usual as guidance.
Swap Points
The swap points shown this time are as follows.
- BUY: −78.59
- SELL: +16.81
(per lot, per night)
Under these conditions, selling positions have an advantage in swaps, while buying positions are disadvantaged.
4. Summary of Today's AI Forecast
In this analysis, the double bottom around 3975 dollars is a key decision point.
If the double bottom breaks, Plan A's sell; if it holds, Plan B's buy is expected.
Whether Friday's closing price sits at 3975 dollars or 4000 dollars will also be material for weekend decisions.
※This article is a presentation of market analysis and forecasts byAI Analysis Visualizer for MT5 AI Assistantand does not guarantee investment advice or profits. The listed price levels and trading scenarios are at the time of analysis and may change with market conditions. For actual trading, please confirm the latest charts, prices, spreads, and other factors before deciding.