
[Video] Performance in the Last 3 Months | GOLD STREAM Signals Movement After Signals July 2026 to September End
“After the signal, how did it move?”
GOLD STREAM Thoroughly tested across three periods (68 signals in total). Look at the win rate and the contents of PF for each period.
When you look at FX signal tools, the first thing you’re likely concerned about is the “win rate,” right?
However,a win rate alone cannot determine whether a signal is actually usable for trading.
What matters is,
“What was the result, including both wins and losses?”
This is the point.
This time, regarding the GOLD-only day trading support tool“GOLD STREAM”, we verified the price movements after the signals in three different validation periods through video, and further conducted a thorough numeric verification with the “Win/Loss Verification Indicator.”
2026.7.1~8.8
Price Movement After GOLD STREAM Signals
First, after past GOLD STREAM signals appeared,how the actual chart movedwill be checked.
Signals without a win/loss mark are signals that were skipped due to a correlation mismatch.
Period: July 1, 2026 – August 8, 2026
33 Signals Verified with the “Win/Loss Verification Indicator”
From here, we will examine the price movement of Period ① datausing the Win/Loss Verification Indicatordata.
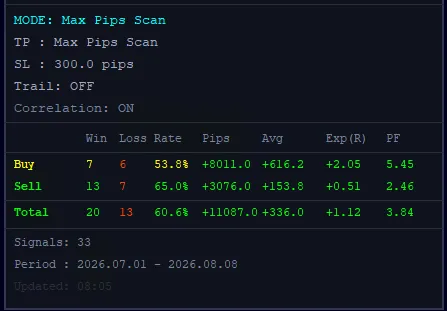
Verification Result ①
Validation period: 2026.07.01 ~ 2026.08.08
Period ①: Look at BUY and SELL results
2026.8.10~9.4
Price Movement After GOLD STREAM Signals
Next, after GOLD STREAM signals appeared in another period,how the actual chart movedwill be checked.
Signals without a win/loss mark are signals that were skipped due to a correlation mismatch.
Period: August 10, 2026 – September 5, 2026
18 Signals Verified with the “Win/Loss Verification Indicator”
From here, we will examine the price movement of Period ② datausing the Win/Loss Verification Indicatordata.
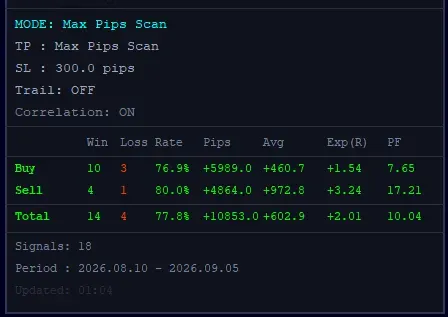
Verification Result ②
Validation period: 2026.08.10 ~ 2026.09.05
Period ②: Look at BUY and SELL results
2026.9.7~9.30 GOLD STREAM
Price Movement After Signals
Furthermore, after the most recent period③ GOLD STREAM signal appeared,how the actual chart movedwill be checked.
Signals without a win/loss mark are signals that were skipped due to a correlation mismatch.
Period: September 7, 2026 – September 30, 2026
17 Signals Verified with the “Win/Loss Verification Indicator”
From here, we will examine the price movement of Period ③ datausing the Win/Loss Verification Indicatordata.
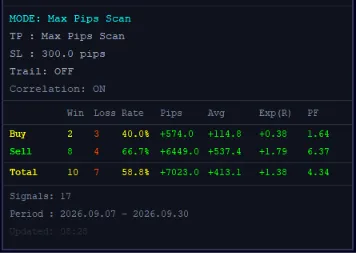
Verification Result ③
Validation period: 2026.09.07 ~ 2026.09.30
Period ③: Look at BUY and SELL results
What stands out is not only the win rate
Even across multiple validation periods, the win rate fluctuates, but what’s truly important isn’t just that.
Stable Profit Factor and Expectation
High PF orExp(R)in each period show thata system that reliably preserves gainscan be expected to generate profits.
Even if the win rate is high, a single large loss can wipe out overall profits. Conversely, if you design to capture larger profit ranges, you can have trades with a favorable expected value.
Of course, these areresults for each validation periodand do not guarantee the same numbers in the future.
Max Reach Pips = Not Actual Profit
The listed max reach pips (+11,087 pips / +10,853 pips / +7,023 pips) are verification values that sum the maximum ranges reached after each signal. In actual trading, results vary due to entry/exit timing, spreads, slippage, and market conditions.
GOLD STREAM is not a tool to just “look at signals”
The purpose of GOLD STREAM is not merely to display “BUY” or “SELL.”
On the official product page as well,the two-step Ready → Signal notification, signal strength and correlation, GOLD PIVOT LINE, TP/SL (EA included free), and other information needed for judgment are organized and presentedas core design.
but
“How to judge signals when conditions align”
as the intended usage.
This TRADE REVIEW is not just a victory report.It is verification material to see how past signals moved afterward.
“You don’t need to take everything”
GOLD can move strongly in one direction, but there can also be sharp reversals or ranges. Therefore, you don’t need to capture every move.
In these validations, by watching the actual price movement in video and cross-checking the tool’s numeric data, we’ve been able to verify the overall image of the market from multiple angles.
From analyzing both the chart and the data, it becomes clear that GOLD STREAM is a system that uses correlation filters to carefully select entries and capture the price moves that lead to profit.
Of course, not every signal will lead to a win. What’s important is not reacting to every price move, but checking market conditions, selecting moments with justification, and passing on trades when necessary.
There is no need to rush to take every large move.
Identify the waves to target, avoid forced entries, and accumulate the available price moves.
That is the essential mindset for facing the GOLD market for a long time.
The aim is not a single big win, but to calmly analyze the market and build trades with repeatability.
GOLD STREAM provides information to judge market strength and correlation, and strongly supports discretionary trading that can be swayed by emotions.
See GOLD STREAM in more detail
GOLD-specific, two-step notification × strength & correlation analysis × trailing SL on a settlement EA
▶ See GOLD STREAM product details and verification data“If you’d like to know more about this feature”
For questions or confirmations about GOLD STREAM, you can contact the developer directly via DM.
▶ Ask the developerThe figures in this article are results of past verification that targeted signals generated during multiple validation periods (2026.07.01–08.08, 2026.08.10–09.05, 2026.09.07–09.30).
Win rate, PF, max reach pips, etc., do not guarantee future profits or win rates.
Max reach pips are reference values compiled from the maximum ranges reached after each signal; actual execution and settlement results may differ.
In actual results, it depends on spread, slippage, entry/exit timing, market conditions, etc.
Please make final trading decisions at your own risk.