
Everyday Nikkei 225: 2026/10/30
Details of Analysis Tools Link
* We have steadily received high praise.
■ Newly developed profit + Indicator DAVID
https://www.gogojungle.co.jp/tools/indicators/73936?via=users_products
■ Expert Trend Line Drawing Indicator “Unmatched Sword”
https://www.gogojungle.co.jp/tools/indicators/54499?via=users_products
■ Indicator Pack MT4/5 Version - Monthly
“Tenka Musou” Synchronization System
https://www.gogojungle.co.jp/tools/indicators/50319
“David” Synchronization System
https://www.gogojungle.co.jp/tools/indicators/73939?via=users_products
Trade Edition – Ultimate Synchronization System Monthly
https://www.gogojungle.co.jp/tools/ebooks/50353
Below: Current status analysis article
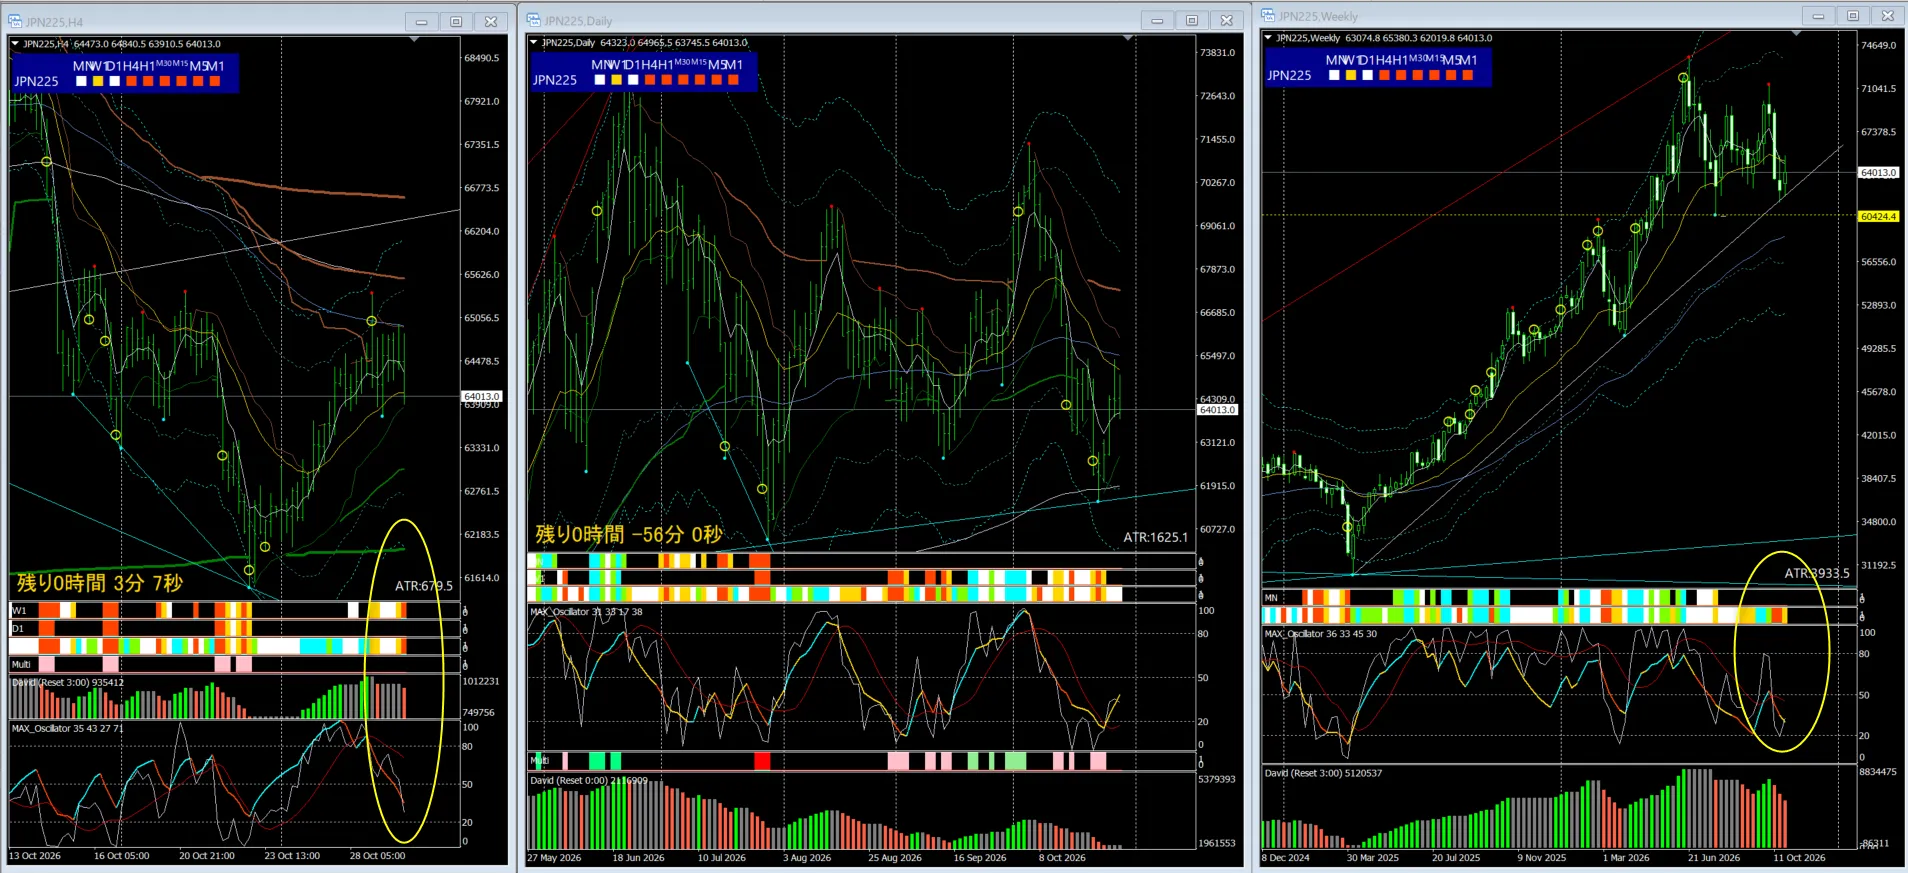
One-word comment: Both upside and downside are present. It depends on what comes next.
Daily chart:MAX Oscillator: Synchronization Band“Neutral”
4-hour chart“Strong Downtrend” indication
Weekly chart “Weak Downtrend” indication
* Watch whether it continues to rise or falls again
Weekly lower signal “off”・Daily lower signal “on”
In the near term, there is a slight rebound after a decline, then downward pressure
Looking at the MAX Oscillator on the weekly chart, whether it will rise again or fall again depends on what happens next
from now on, but
Daily lower bound resistance, a slight pullback from the weekly trendline
Weekly lower signal reactivates
Whether it can hold here is to be seen
Price action can become extremely volatile depending on the time of day
If it feels dangerous, it might be better to exit quickly, and risk management is also
still necessary to exercise caution.
Do not ignore the near term; stay flexible to short-term waves
Be vigilant for sudden drastic changes!
※ Notes
Volatility is quite high, so please manage your funds carefully.
Important Notes
Original indicator analysis commentsare current observations, not a recommendation to buy/sell or a guarantee of future movements.
This does not constitute a buy/sell recommendation, nor does it guarantee future movements.