
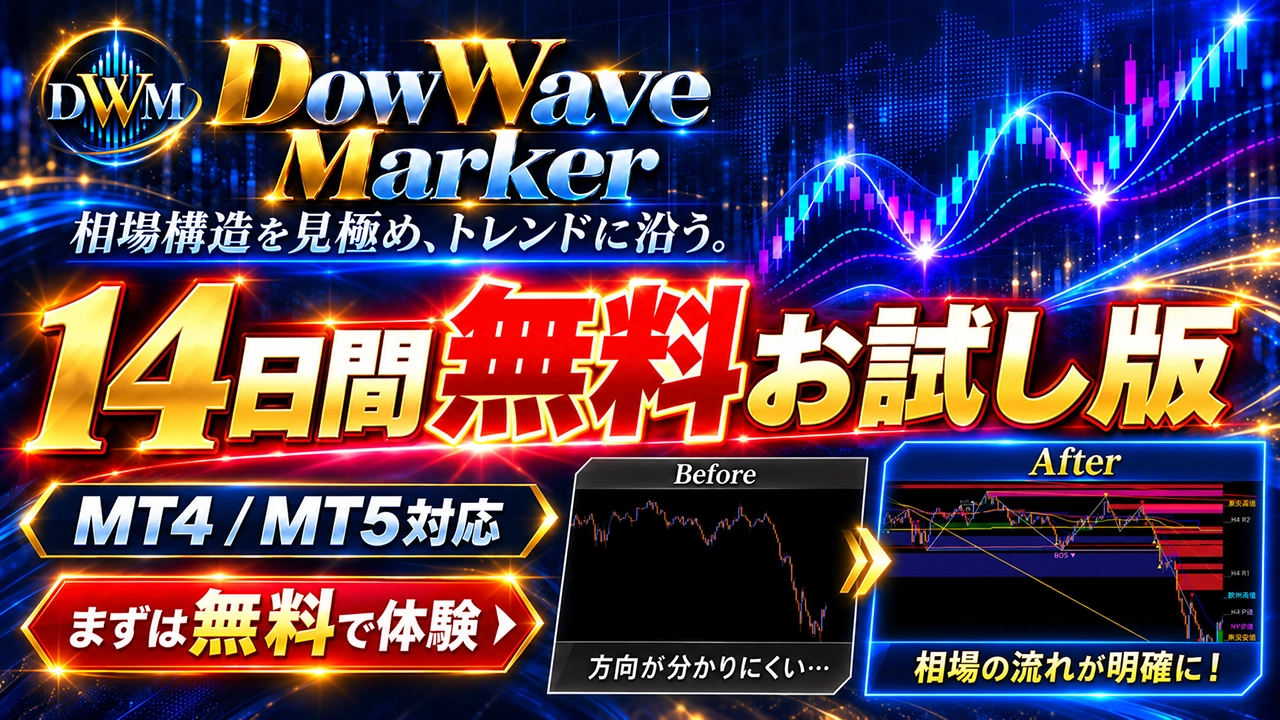
[14-day free trial] Experience how market structure looks in DWM: a before-and-after comparison of USD/JPY introduction and examples of using GOLD, GBP, and AUD
DOWWAVE MARKER | 14-DAY FREE TRIAL
A comparison of USD/JPY before and after introduction and examples of using GOLD, pound, and AUD
CHoCH / BOS / higher-timeframe MA / key price levels / profit targets
Hello, I am Yumotosan.
When confirming the trend direction on a chart, wouldn’t it be convenient if you could organize not only the movements of highs and lows but also the higher-timeframe conditions and important price levels at once?
DowWave Marker (DWM)is,an environment-aware indicator that visualizes market structure on the chart based on Dow Theory.
In this video, a newly released roughly three-minute clip,DWMwill be shown, comparing before and after its display to illustrate how trading insights appear.
Additionally,you can try14 days for freeon your own chart by using the free trial version.
WATCH THE VIDEO
What you’ll see in the video|14-day free trial

If the video does not display,Watch the video on YouTube
See details of the 14-day free trial
Video highlights
Centered on the USDJPY 15-minute BEFORE/AFTER, it introduces Watching on the execution bar, higher-timeframe moving averages, and the appearance of key price levels.
It also covers considerations for potential take-profit levels and risk/reward.
01 | MARKET STRUCTURE
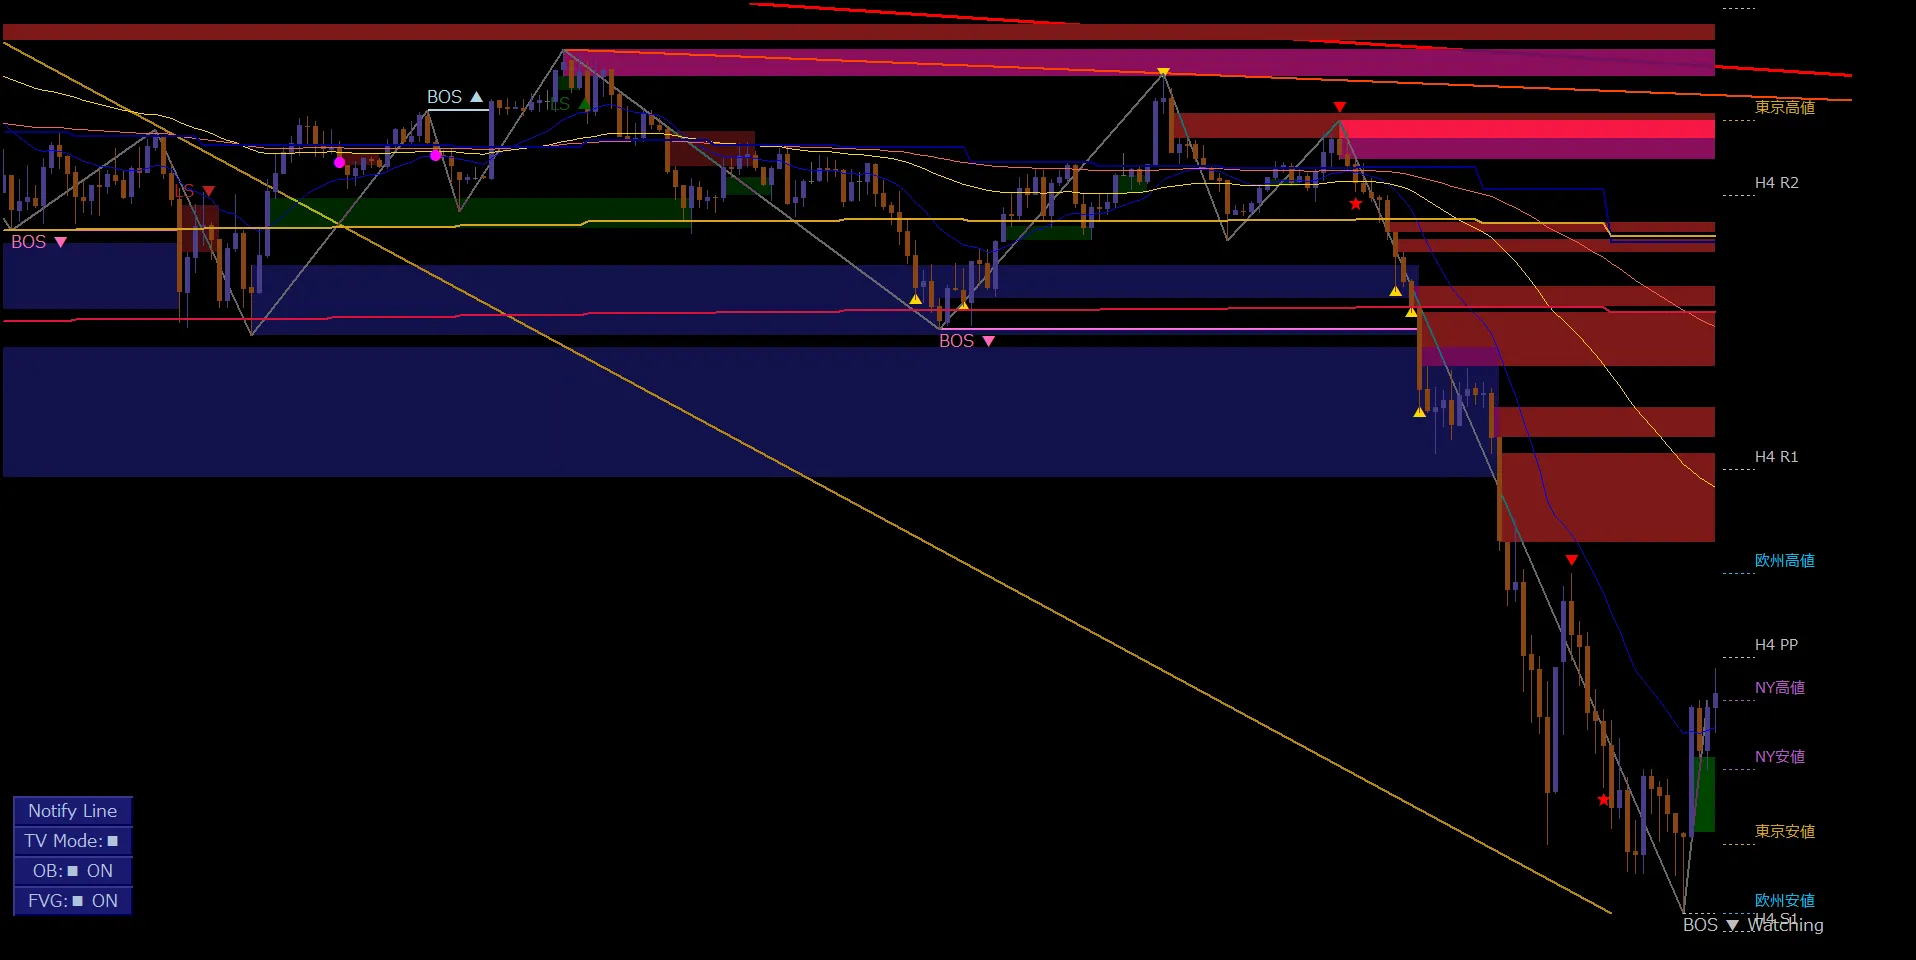
Survey market structure with CHoCH / BOS
Price moves can be read from a chart with candlesticks alone. Overlaying DWM adds structural information such asCHoCH / BOS based on highs and lows, providing more clues on trend continuation or reversal.
Furthermore,Watchingserves as a display to follow candidate structures to focus on next.
The video also shows Watching on the USDJPY 5-minute execution bar.
02 | MULTI-TIMEFRAME & PRICE AREAS
Combine higher-timeframe views with key price levels
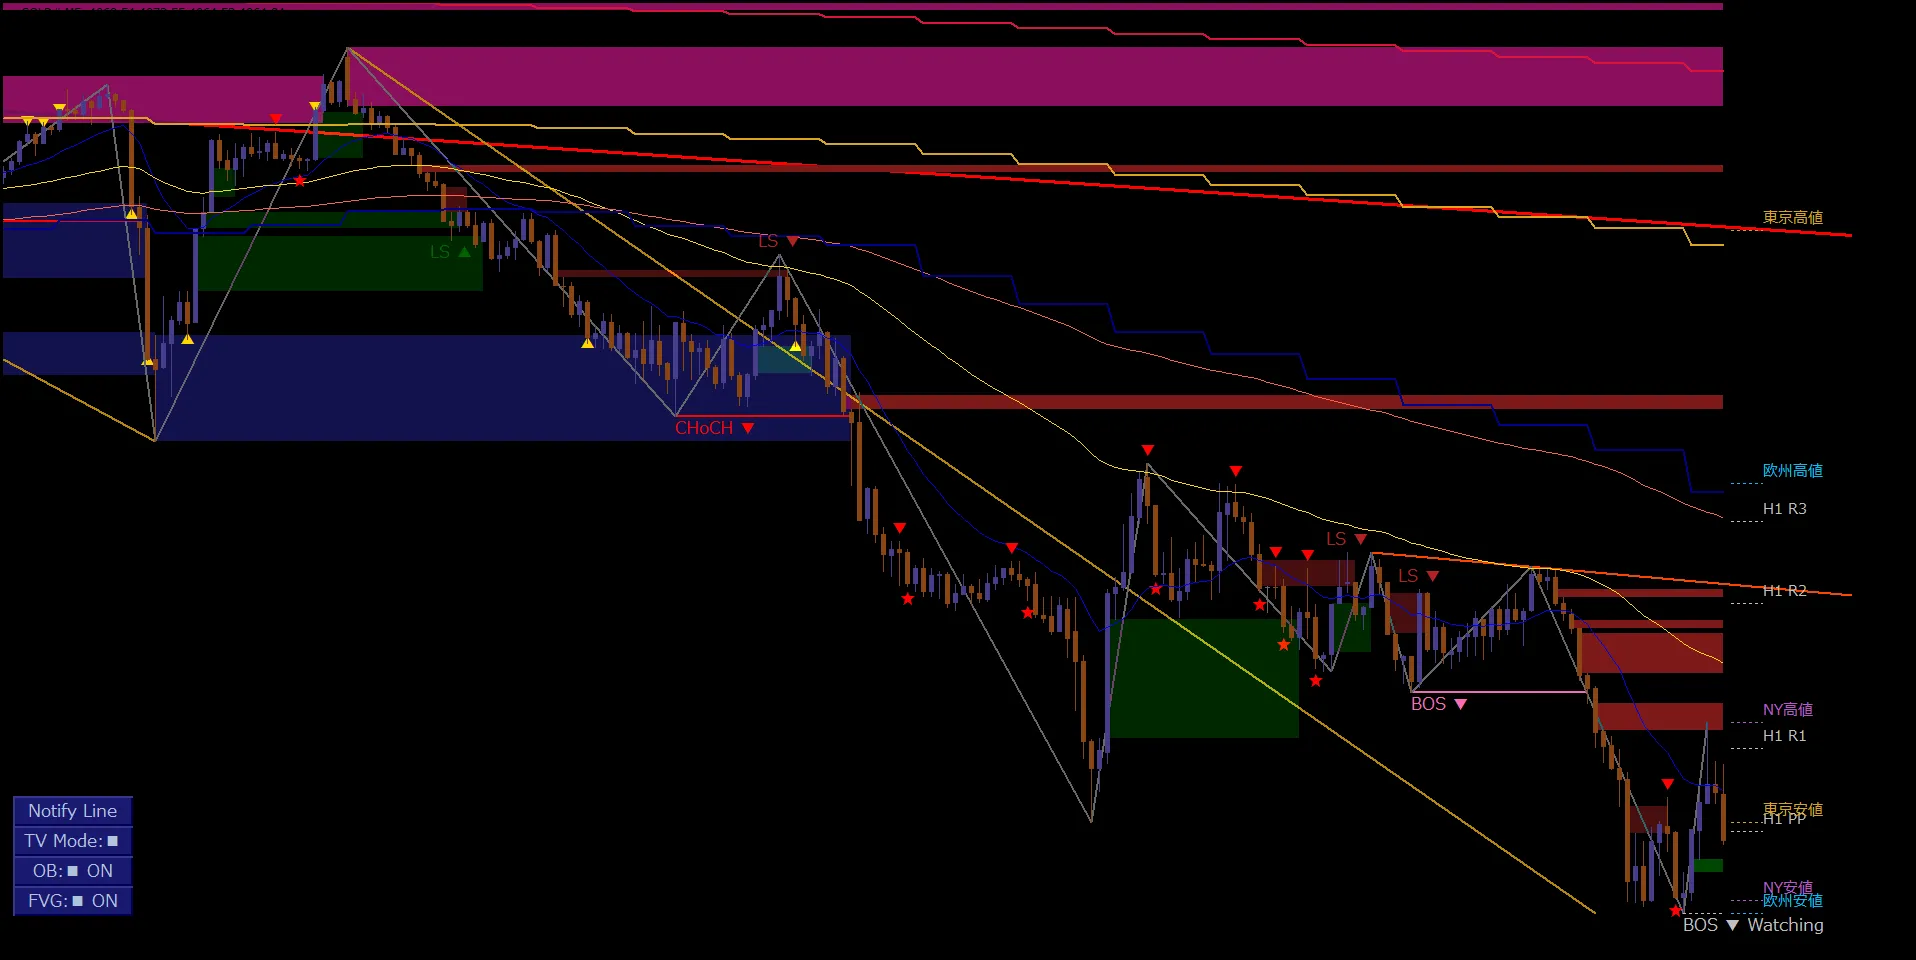
By looking at not only the direction of the execution bar but also the higher-timeframe market structure and its relation to moving averages, you can interpret the current price action from a broader perspective.
DWM’s SMC Integrated Modelallows you tosee FVG and Order Blockon the same chart.
Useful for outlining zones that may serve as pullback or reversal areas where price could react.
03 | TARGET & RISK / REWARD
Consider profit targets, not just entry
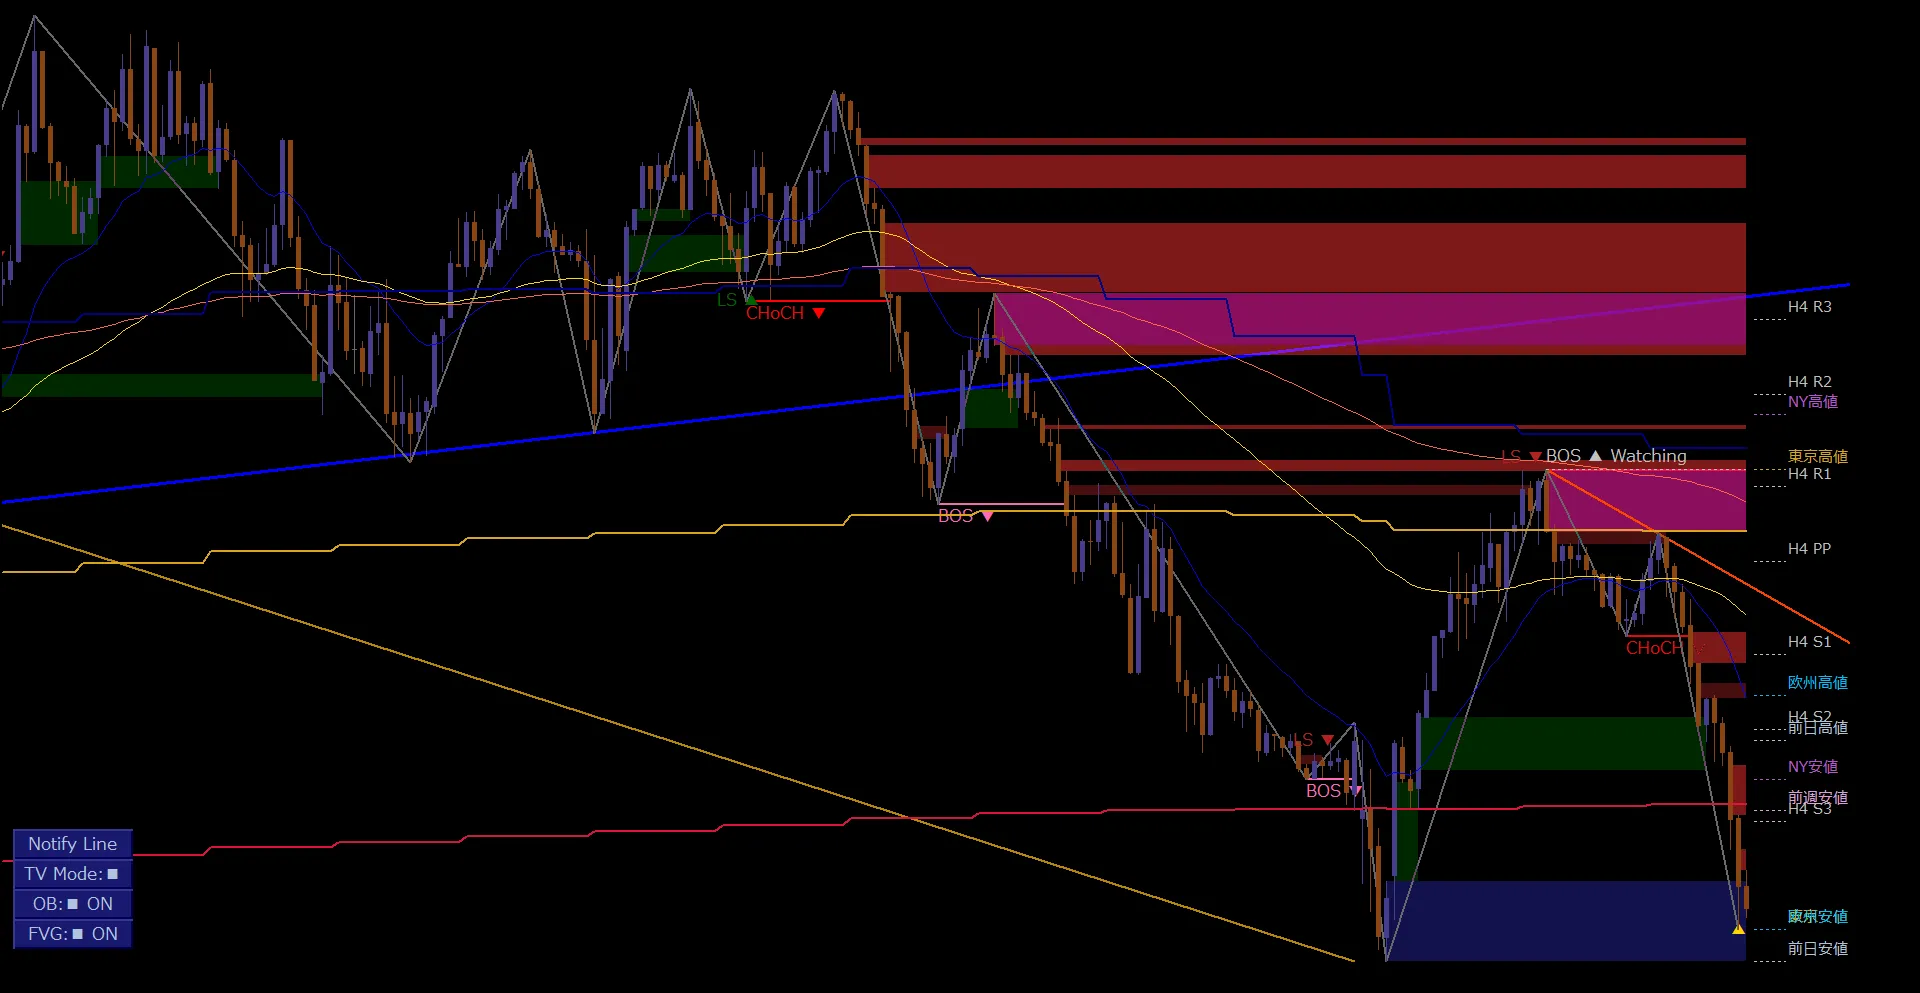
When evaluating a trade, in addition to the entry rationale,which price level might become relevant nextis also important.
By checking market highs and lows, previous day/previous week highs and lows, pivots, etc., you can identify likely targets and potential price movement,aiding take-profit candidates and remaining upsideto consider.
Comparing the distance to stop-loss and take-profit levels helps assess risk/reward (R/R) before entry.
How to use each level depends on your own trading rules.
14-DAY FREE TRIAL
Try DWM on your own chart to evaluate usability
The video demonstrates one feature example. By applying it to assets you trade and timeframes you use, you can confirm more concretely how the chart appears, the amount of information needed, and how it fits with your current analysis approach.
There is no automatic switch to a paid version after the trial ends, and no charges will be incurred.
DowWave Marker 14-day Free Trial
The product features and details of the free trial can be viewed on the product page.
See the Structure. Follow the Trend.
Assess market structure and align with the trend.
Note: This article aims to teach market structure analysis and introduce the tool. The charts shown use past market data and do not guarantee future price movements or profits. Please make investment decisions at your own risk.