

What would an EA with a win rate of 90% lose on a single loss? Read the performance table using the break-even win rate
How to Read the Performance Table of EAs and Indicators | Issue 1
If a sales page prominently says “Win rate 90%” and “PF10,” it can make the EA look good. If you win 9 out of 10, you’ll feel you can’t lose.
However, a win rate of 90% does not always lead to profit. The win rate only shows “how many times you won.” Only by combining it with “how much you gain when you win once and how much you lose when you lose once” can you tell whether your account balance will increase.
In this series, I will give you one benchmark at a time to help you learn to read performance tables for EAs and indicators. The first benchmark is“Break-even win rate”.
Win rate 90% but money not increasing: 10 trades
First, look at a fictional example. An EA trades 10 times, wins 9 times, and loses 1 time. The win rate is 90%.
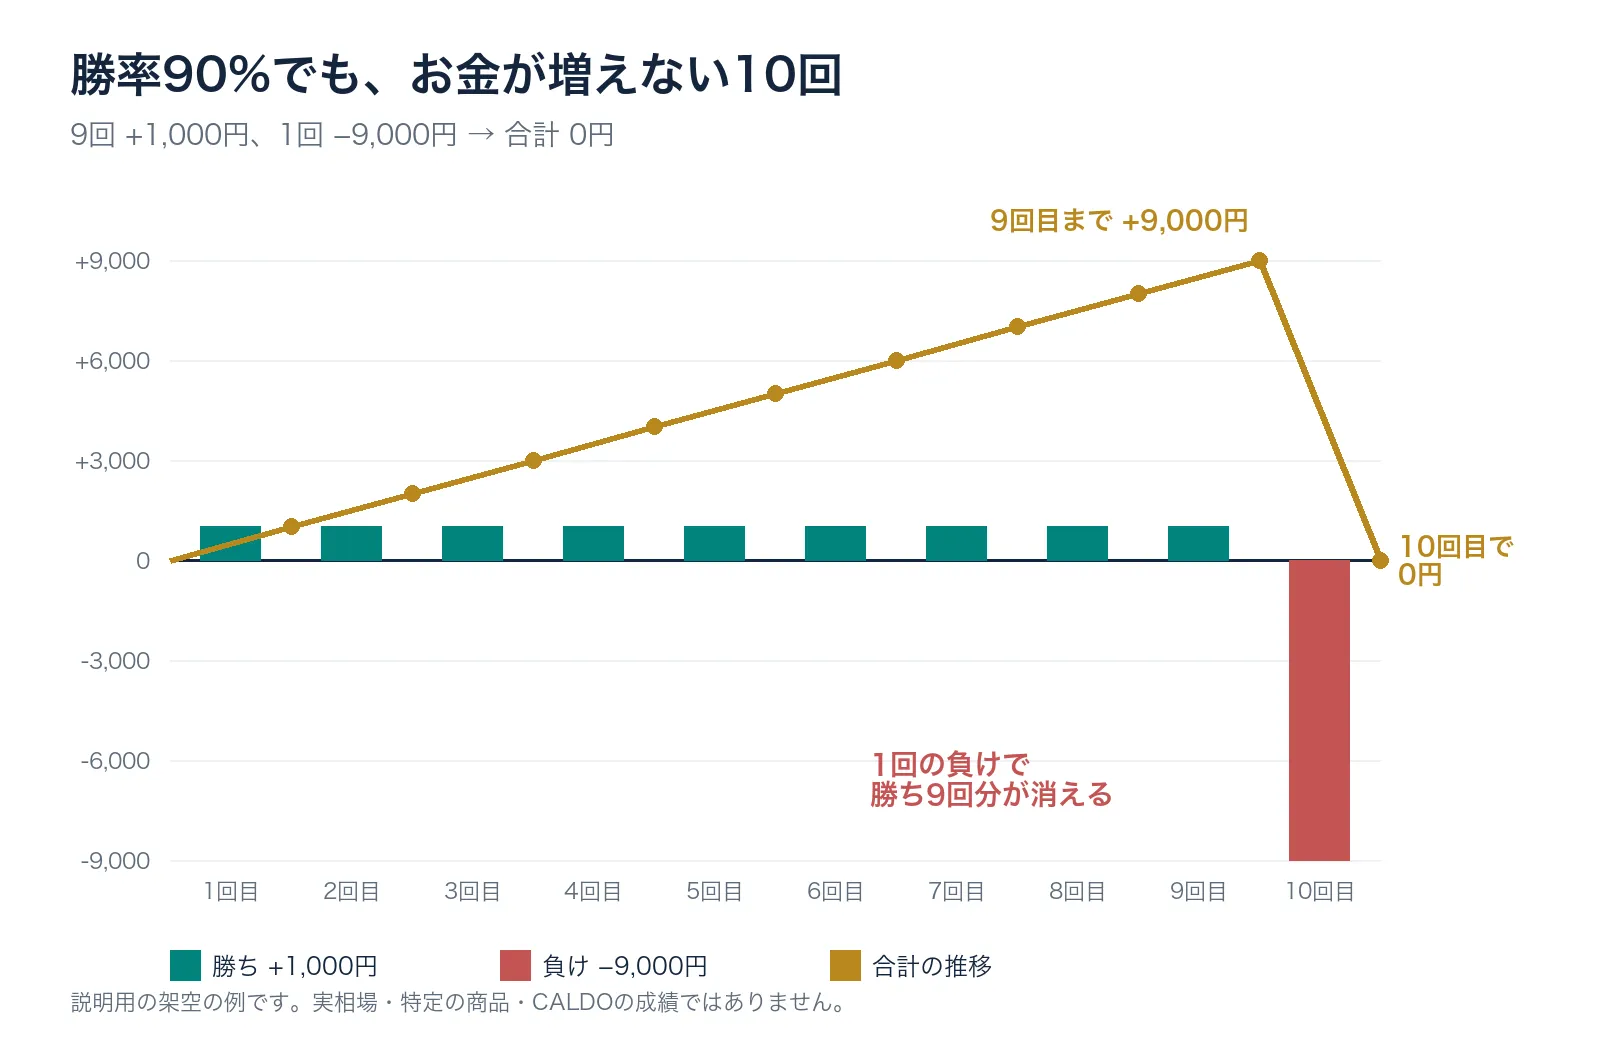
The 9 wins were each +1,000 yen. In total, +9,000 yen. However, the 10th trade loss was −9,000 yen. When you add the 10 trades, you get exactly 0 yen.
With a win rate of 90%, the performance table reads “9 wins, 1 loss.” Still, the account balance has not increased by even 1 yen.One loss cancels out nine wins.
What you should look at is not only the win rate, but also “how many wins’ worth you lose for each single loss.”
Question: Which EA is profitable?
The following three are performances of fictional EAs. The number of trades is sufficiently large, and returns are calculated including the spread.
| EA | Win rate | Average profit (per win) | Average loss (per loss) |
|---|---|---|---|
| X | 90% | +1,000 yen | −12,000 yen |
| Y | 40% | +3,000 yen | −1,500 yen |
| Z | 70% | +2,000 yen | −4,000 yen |
If you sort only by win rate, the order is X → Z → Y. Now, when you trade the same number of times, which one increases your money, and which one increases the most?
What you’ll understand going forward
- Answers for the three EAs and calculation of profit/loss per trade
- A calculator-ready formula and quick reference table for the “break-even win rate”
- A calculation example showing a roughly 90% win rate just by deciding up or down five minutes in advance
- Why including the spread makes higher-win-rate trades more difficult
- If “win rate 90% and PF10” is true, what the performance table should look like
- Five numbers to check on the sales page and the data entry sheet
You can read more with a free viewing request
The continuation is available with a free viewing request for this article. Those who sign up may receive notices about the next release of this series and guidance useful for reading performance tables and short-term GOLD trading.
Before looking at the answers, please calculate the “profit/loss per trade” for the three EAs on your own.