

Even though I aimed for 20 pips, for some reason it was 69.5 pips. The “pleasant slip” that happened at the RBNZ policy rate
NewsBurst Real-world Operation Record
Although aiming for 20 pips, it somehow reached 69.5 pips.
A “pleasant slip” caused by the RBNZ policy rate
October 28, 2026.
Japan time 10:00.
On this day, we targeted the New Zealand RBNZ policy rate announcement.
Currency pair was GBPNZD.
NewsBurst had already included this indicator in this week’s Trade Plan.
And the result was,
GBPNZD BUY
+69.5 pips
+6,193 yen
That’s what happened.
However, something a bit interesting happened this time.
The targeted TP was,
20 pips.
Nevertheless, the actual settlement result was,
+69.5 pips.
We captured about 50 pips more than planned.
It was as if we received a bonus from the indicator trade.
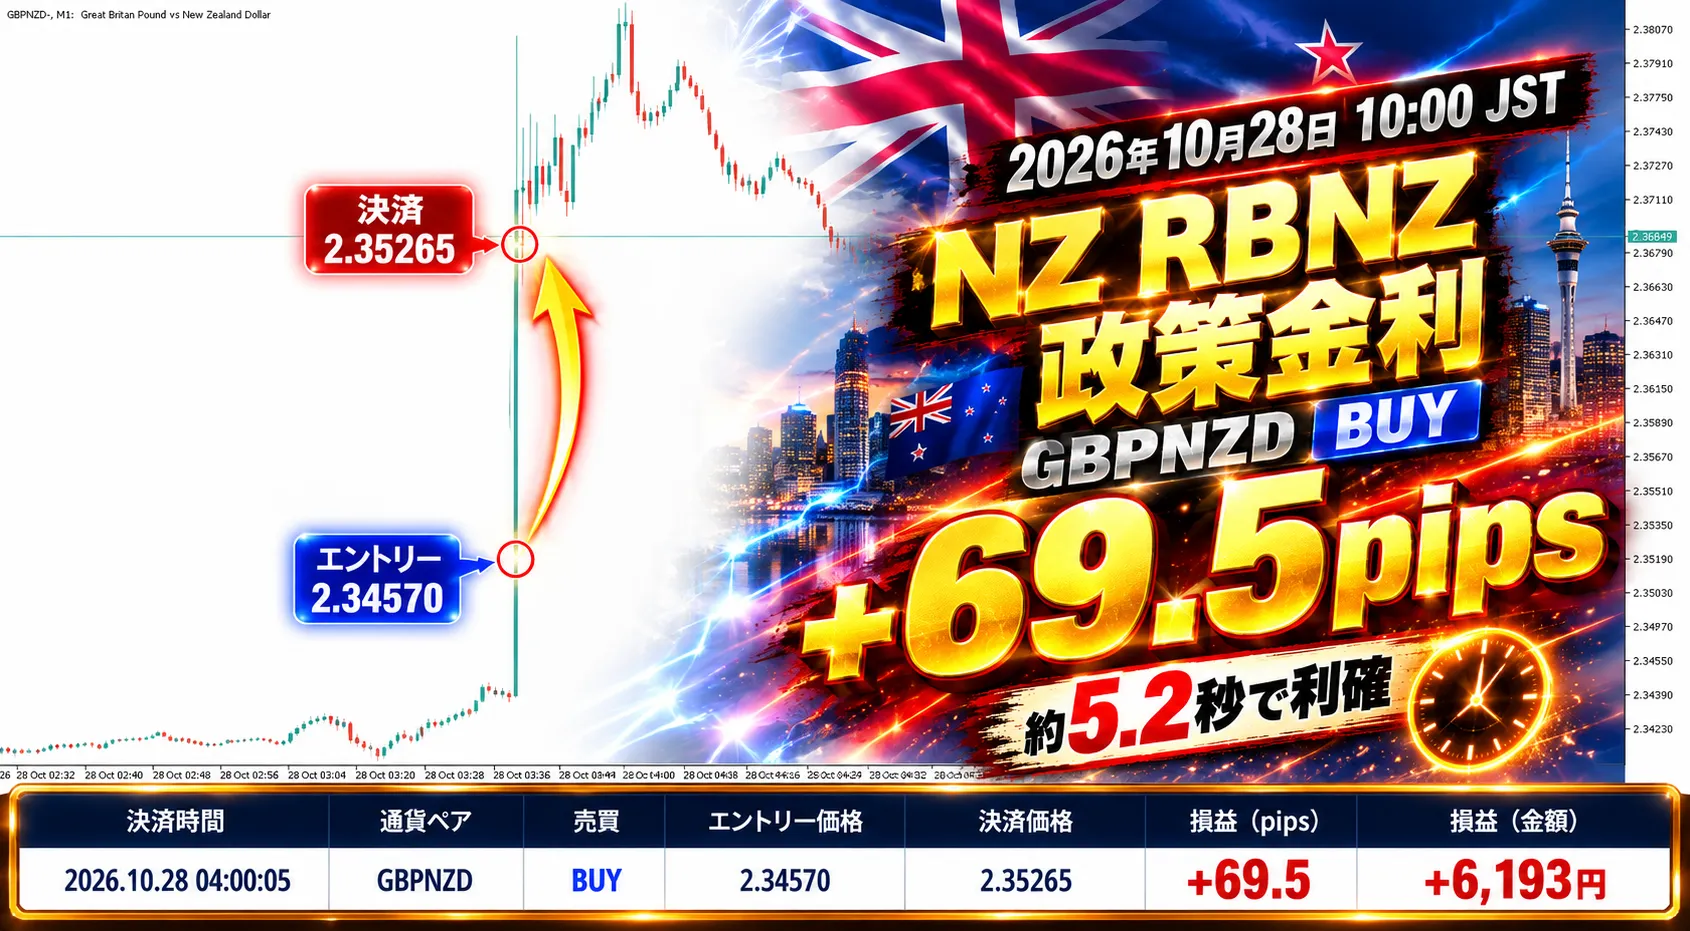
First, the actual trade
This trade was,
GBPNZD
BUY
0.10 Lot
Entry 2.34570
Exit 2.35265
Holding time about 5.20 seconds
Reason for exit TP
+69.5 pips
+6,193 yen
NewsBurst’s screen also recorded
GBPNZD BUY +69.5 p
It’s about 5 seconds.
This trade was also quite short.
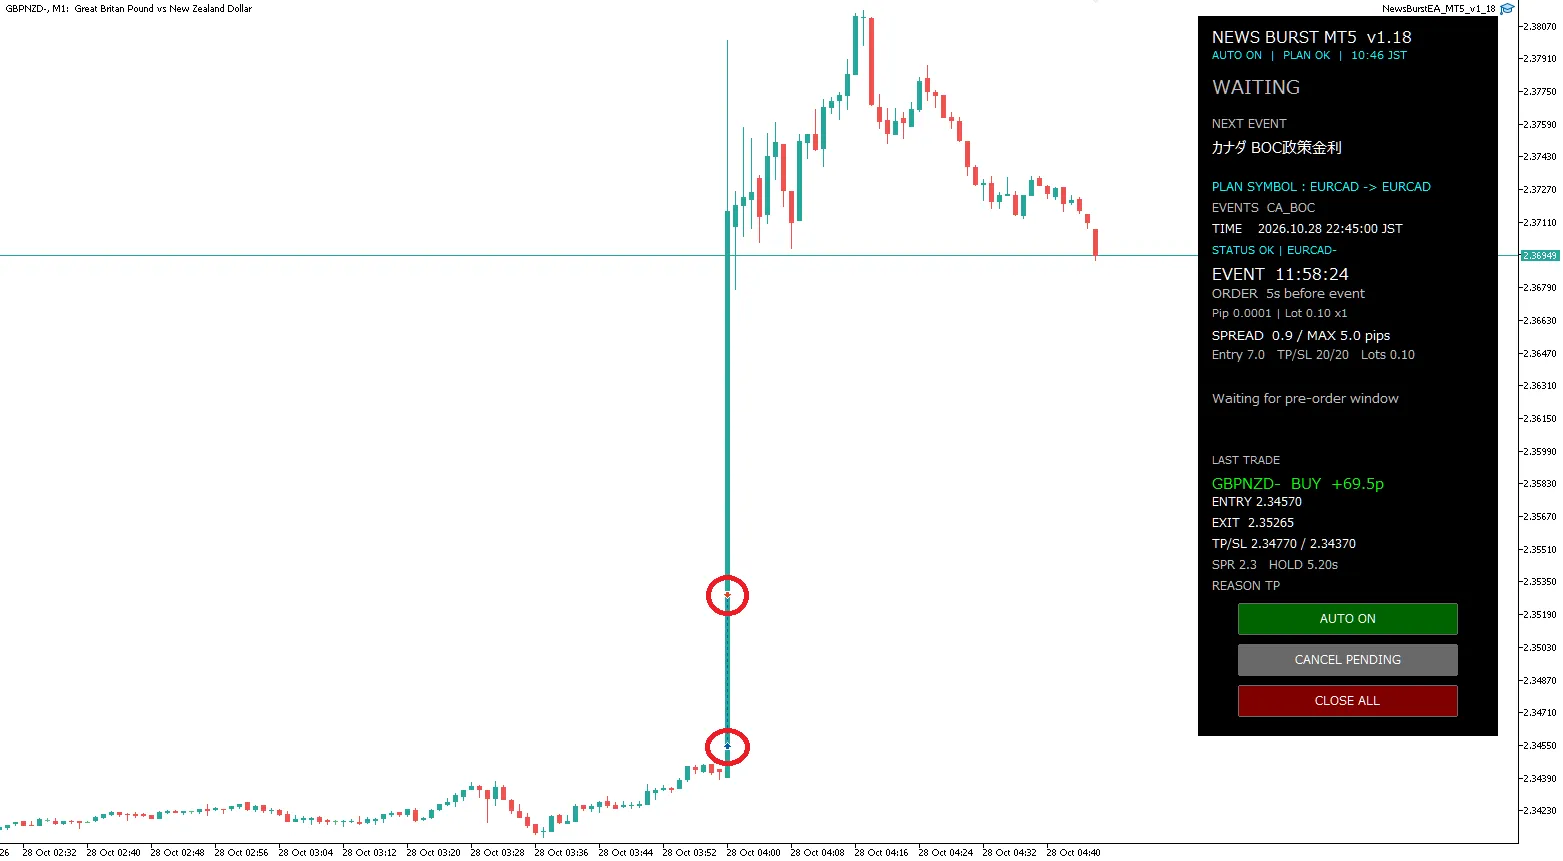
But the TP was 20 pips
This is the interesting part this time.
The TP set on NewsBurst was,
2.34770.
Entry was 2.34570.
In other words,
Aiming for 20 pips.
However, the actual settlement price was 2.35265.
In the history it shows +69.5 pips.
Looking at the chart, GBPNZD surged upward right after the announcement.
Almost vertical.
In normal markets, such movement is rarely seen.
In that sharp move, the TP level set 20 pips above was quickly surpassed, and as a result it may have been settled at a price well above the TP.
This time, it seems the execution price moved in our favor.
Slippage isn’t always bad
In indicator trades,
“slippage”
usually has a negative image.
Bought at a higher price than planned.
Sold at a lower price than planned.
Closed at a worse price than the stop-loss.
That kind of case.
In fact, slippage can occur at economic indicator releases.
But in cases like this,
there are times when it slides beneficially into profits.
Of course, this isn’t something you can aim for deliberately.
Setting TP to 20 pips every time doesn’t guarantee 69.5 pips.
That’s not the point.
This time, due to a rapid price move, there is a possibility of a favorable outcome by chance.
Therefore, I think of it as:
a bonus of about 50 pips.
Indicator trades are not about “executing at a fixed price”
This is quite important.
Using NewsBurst doesn’t mean you set Entry at this price, TP at this price, SL at this price, and you are guaranteed to get filled at those prices.
That’s not how it works.
During indicator releases, spreads tend to widen.
There’s a possibility you won’t fill at the intended price.
Especially with major indicators like policy rates, prices jump at the moment of release.
Price moves accelerate rapidly.
Spreads widen.
Slippage occurs.
There can be a divergence between the placed price and the actual filled price.
Sometimes favorable like this time, sometimes unfavorable.
Don’t conclude that +69.5 pips is normal by looking at this alone.
Why still target indicator trades
If that’s the case,
spreads widen.
Slippage occurs.
Execution price is unpredictable.
So why aim for such trades?
The reason is simple.
Because there are moments when prices move much more than that.
This chart exemplifies that.
Triggered by the RBNZ policy rate release, price moved upward rapidly.
This isn’t a trade of squeezing a few pips slowly.
It’s about capturing the large initial move generated by the indicator.
Even with spreads and minor slippage, you pick a move where the price range exceeds it.
NewsBurst tests such moments.
Weekly Plan is automatically generated by a dedicated Windows app
This is another very important part of NewsBurst.
This RBNZ rate wasn’t obtained by you visiting economic sites and manually inputting dates into a CSV.
NewsBurst has an original Windows-only Plan Builder.
It fetches the scheduled indicators and creates a Trade Plan CSV.
In other words,
every week, you don’t have to scour multiple indicator sites.
You don’t have to check times one by one.
You don’t have to look up currency pairs.
You don’t have to manually input into a CSV.
To reduce that workload, Plan Builder exists.
For indicators supported, plans are obtained focusing on primary sources such as official releases.
From there,
which indicators are this week.
which ones to trade.
which currency pairs to target.
to be confirmed, and a Trade Plan is created.
For indicators supported, plans are obtained focusing on primary sources such as official releases.
From there,
which indicators are this week.
which ones to trade.
which currency pairs to target.
to be confirmed, and a Trade Plan is created.
However, automatic retrieval of indicators does not mean we recommend trading all of them.
Plan Builder is a system to organize the indicators scheduled for the week. Deciding which indicators to actually target and which to skip is a human decision. Don’t chase everything; choose where you will compete. This is NewsBurst’s essential philosophy as well.
Automatically gathered. But you decide whether to target or not.
We have systematized the process from searching economic indicators to entering at release as a single flow.

This RBNZ was already in the Plan
In this Trade Plan,
October 28, 2026.
10:00.
NZ RBNZ policy rate.
GBPNZD.
entered.
In other words,
The place to trade was decided in advance.
All that’s left is to wait.
While glancing at today’s chart,
Where should I enter today?
Any chance around?
No need to search around.
What NewsBurst wants to do is,
Decide in advance. Then wait until that time.
That’s the kind of trading.
When the plan is made, even entry is handled by NewsBurst
NewsBurst isn’t just a tool to manage weekly economic indicators schedules.
Entries are automated.
Humans first determine,
- Target indicators
- Currency pair
- Lot
- Entry distance
- TP
- SL
And so on.
In this screen,
Entry 7.0.
TP and SL are 20 pips.
Lot is 0.10.
And about five seconds before the release, the EA prepares orders.
Above the current priceBuy Stop
Below the current priceSell Stop
As the price actually jumped upward, BUY was filled.
The opposite unfilled orders are handled by the EA.
Decision by humans. Execution by EA.
A special trade of 69.5 pips in 5.2 seconds
Looking at this number alone, it’s quite flashy.
About 5.2 seconds.
+69.5 pips.
But here,
We won’t say, “This is an EA that can take 70 pips in 5 seconds.”
This is one concrete example that happened with the recent RBNZ policy rate.
Next time, it might TP normally at 20 pips.
Conversely, slippage could reduce profits more than expected.
The entry itself might not even be filled.
There could be a sharp reversal leading to a loss.
Therefore, while showing flashy results as flashy results,
we document what happened.
I think this is important.
What I’d rather analyze is “why did it become 69.5 pips”
The result is quite interesting for future analysis.
TP was set to 20 pips.
Yet it settled at 69.5 pips.
Then,
- At what timing did it reach the TP condition?
- How was price updating at that moment?
- How did the spread move?
- Where was the fillable price?
- How did the broker handle it?
These are worth reviewing alongside future logs and collected data.
Winning isn’t the end; analyze winning trades as well.
Losing alone isn’t the only material for verification.
Like this time,
a result that was better than planned
is also a subject for verification.
This is what I want to do together in Phase 0
Currently, NewsBurst is recruiting development collaborators for Phase 0.
NewsBurst Phase 0
What we want to do together isn’t just to collect profitability images.
Why did TP 20 pips produce 69.5 pips?
What if it slips unfavorably instead?
Are there differences by broker?
Is the entry distance appropriate?
Which indicators move most?
We want to collect such real-operation data together.
In NewsBurst, we’ll narrow down to indicators and conditions truly worth targeting.
That’s what Phase 0 aims to do.
In closing
October 28, 2026.
Japan time 10:00.
RBNZ policy rate.
GBPNZD BUY.
0.10 Lot.
Entry 2.34570.
Exit 2.35265.
+69.5 pips.
+6,193 yen.
Holding time is about 5.2 seconds.

TP set at 20 pips.
But the actual result was +69.5 pips.
This time,
a fairly rare result where profits slid strongly into the winner’s side.
About 50 pips more than planned.
Honestly, it feels like a bonus.
However, I don’t expect the same thing to happen next time.
During indicators, spreads widen.
Slippage occurs.
Execution may not fill at the expected price.
That’s part of indicator trading.
Nevertheless,
we aim for moments when price moves sufficiently beyond those unfavorable conditions.
This RBNZ policy rate was exactly such a trade.
And again, another data point I’d like to analyze with NewsBurst.
NewsBurst Phase 0
Now recruiting Phase 0 development collaborators
Details of NewsBurst Phase 0 development collaboratorshere
NewsBurst does not guarantee profits.
Trading FX involves risk of capital loss.
At economic indicator releases, spreads widen, slippage occurs, fills may differ from expected prices, orders may be rejected, fills may be delayed, and rapid reversals may occur.
Even with EA or programs, losses can occur.