
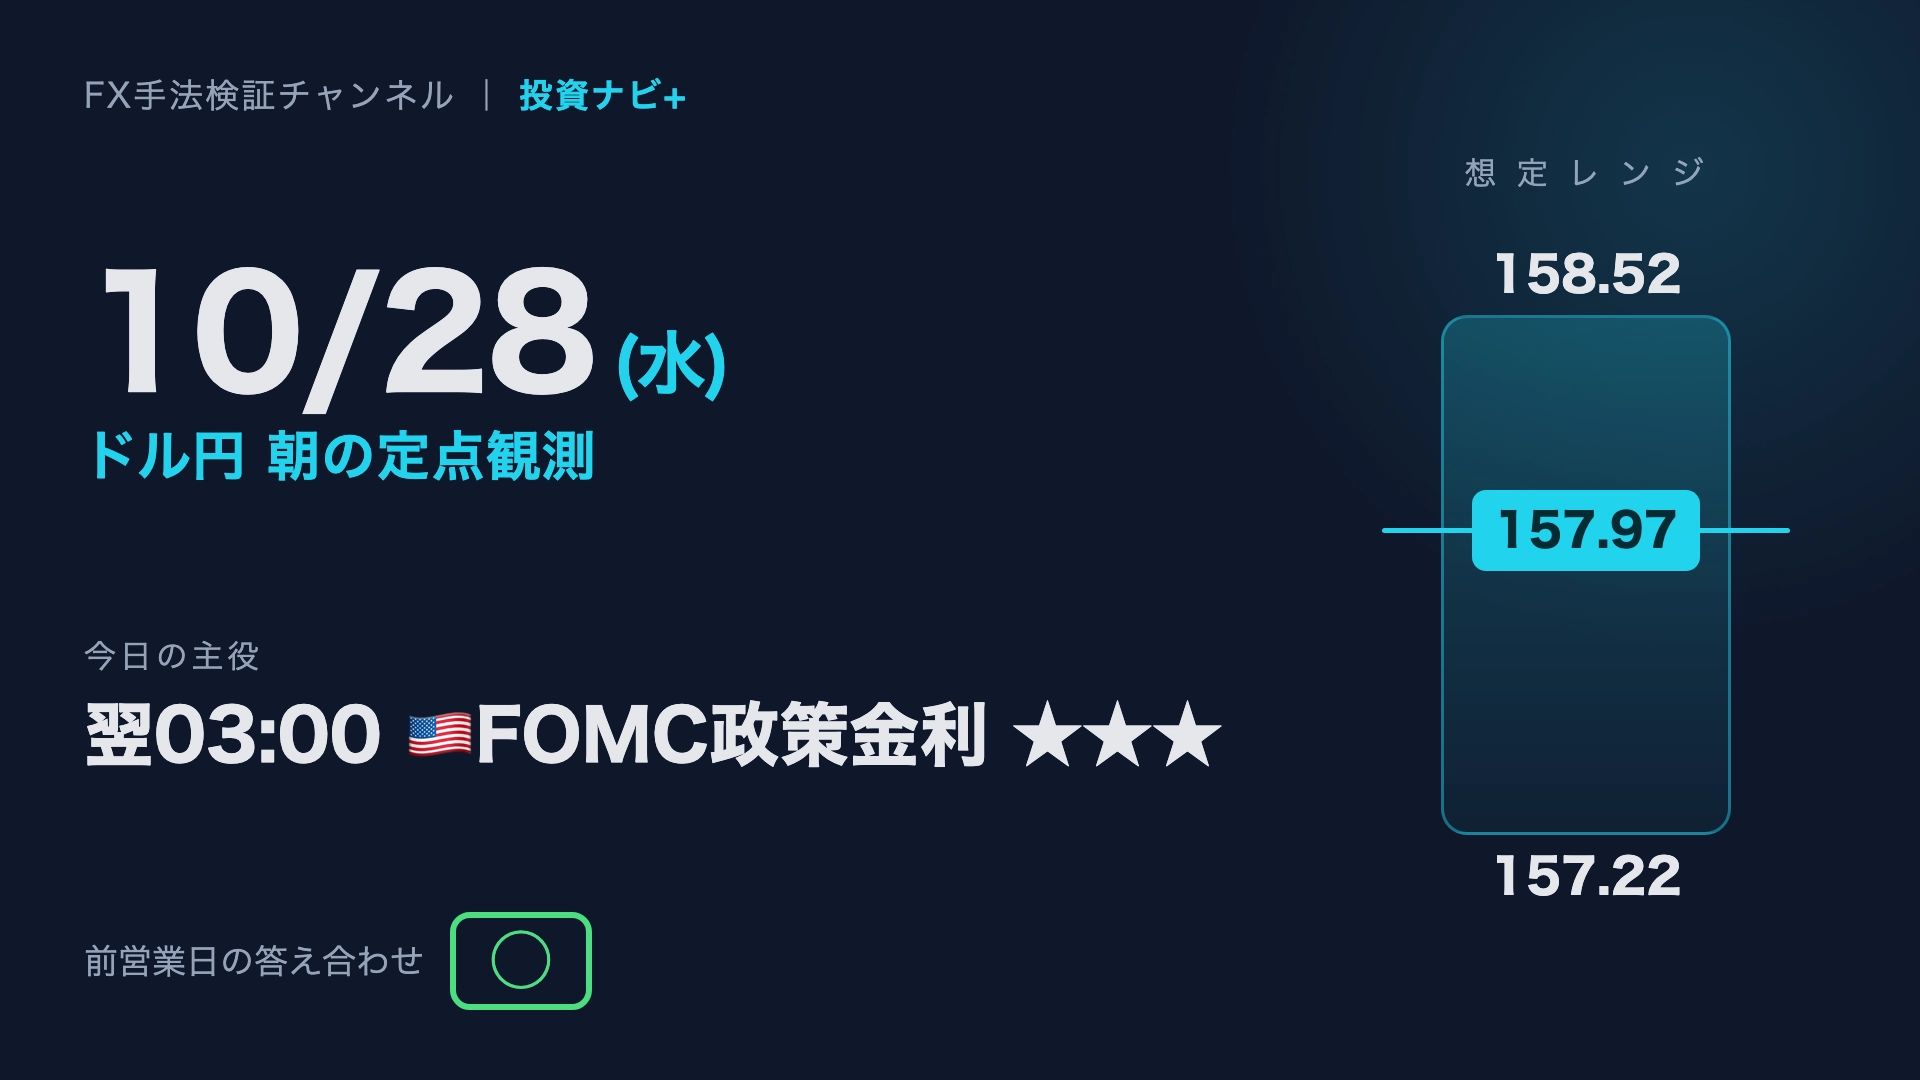
[Oct 28 Wed] Dollar-Yen Morning Fixed Observation|Star of the Show is the FOMC Policy Rate at 03:00 the next day★★★
This is the morning record for Wednesday, October 28. Today's main event is the FOMC policy rate decision tomorrow at 03:00 JST. The USD/JPY current value is 157.97 yen, with an expected range of 157.22 to 158.52 yen.
The answer for the previous business day was positive. Below, I will lay out the indicators, charts, and scenarios in order.
First, 60 seconds — today's economic indicators

Today's economic indicators (10/28 08:30 to the next day 08:29 JST)
| Time (JST) | Country | Indicator | Importance | Forecast | Previous |
|---|---|---|---|---|---|
| 16:00 |  | Germany GfK Consumer Confidence | ★ | -30.1 | -30.6 |
| 18:42 | | Germany 10-year Bond Auction | ★ | — | 3.58|1.2 |
| Time TBD |  | Budget Proposal | ★★★ | — | — |
| Time TBD | | Fall Fiscal Report | ★★ | — | — |
| 21:30 |  | Trade Balance (Goods) | ★ | -130.4B | -132.6B |
| 21:30 | | Wholesale Inventories (Preliminary, MoM) | ★ | 0.5% | 0.7% |
| 23:30 | | EIA Crude Oil Inventories | ★ | -0.1M | -3.1M |
| 03:00 next day | | FOMC Policy Rate | ★★★ | 4.00% | 4.00% |
| 03:00 next day | | FOMC Statement | ★★★ | — | — |
| 03:30 next day | | FRB Chair Press Conference | ★★★ | — | — |
These are the moves today
The FOMC policy rate is expected at 4.00% with a previous rate of 4.00%, and the hold itself is already priced in, so the focus will likely be on the language of the statement and the tone of the Fed chair's press conference. If the outcome is more tightening than expected (content beating forecasts), the dollar tends to strengthen; if more accommodative, the dollar tends to weaken. Since this is a material that can change U.S. interest rates itself, when combined with the statement and press conference it becomes the main driver of volatility, so be cautious around around the 03:00 next day.
USD/JPY — current position
Current value157.97 (Previous business day close 157.94 / Day-on-day +0.44)
Expected range157.22 (Pivot S2) ~ 158.52 (Daily MA200)
Bear caseHolding 157.22–158.52. Direction awaits FOMC at 03:00 tomorrow
AlternativeBreak above 158.52 to test 158.95 / Break below 157.22 to push to 156.07
Daily chart environment
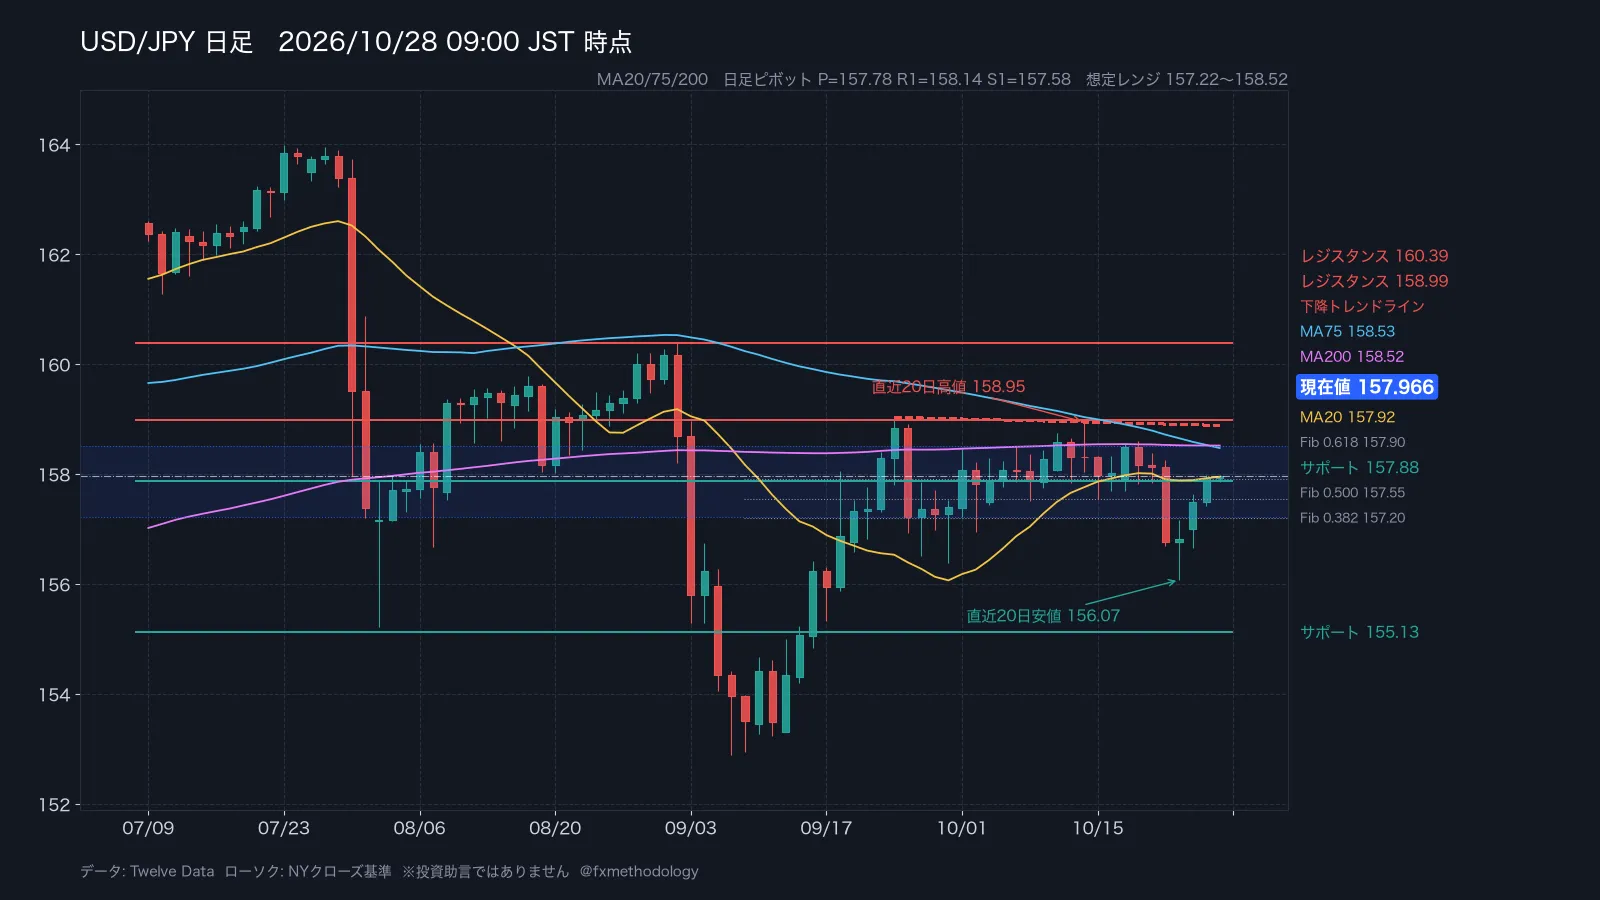
The daily chart is in a range, with moving averages intertwined and no clear directional trend. The current value 157.97 sits just above the MA20 (157.92). Resistance is at 158.99, support at 157.88 by rule, with the 20-day high at 158.95 (10/14) and the low at 156.07 (10/23). The retracement to 157.90 corresponds closely with the 0.618 level from 159.03 to 156.07. The Daily ATR14 is 84 pips.
Key lines on the 4-hour chart
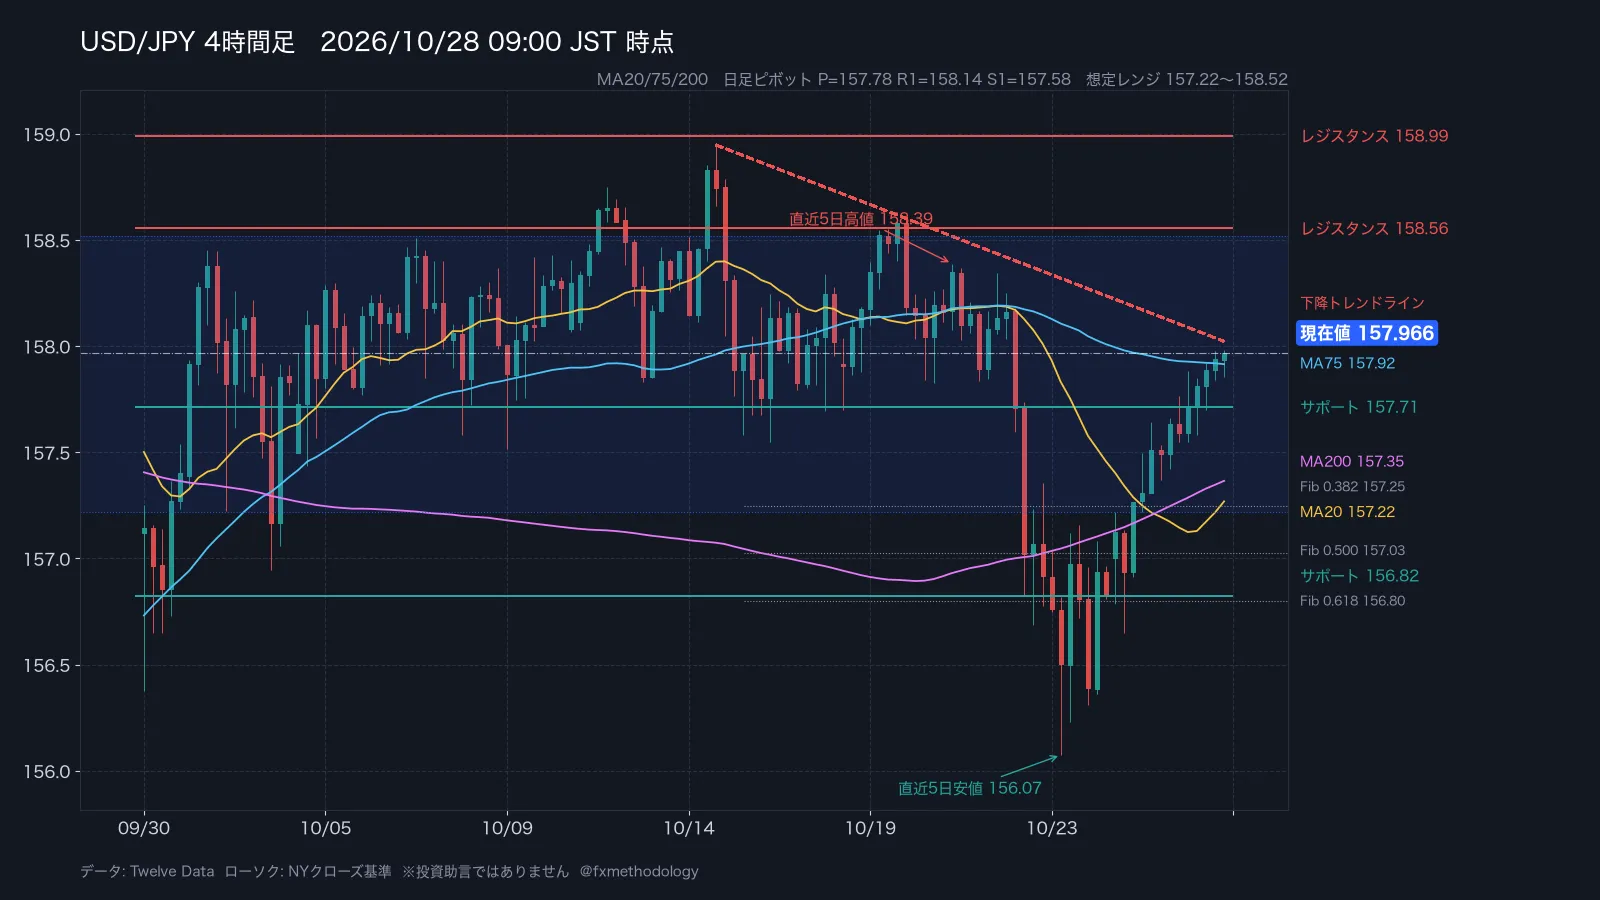
The 4-hour chart also shows overlapping moving averages (no clear arrangement), so the short-term direction is not established. On the upside, 158.56 and 158.99; on the downside, 157.71 and 156.82 are potential levels. The downtrend line starting from 10/14 22:00 currently passes near 158.04, and the 0.382 retracement of the rise from 156.07 to 157.98 aligns with 157.25. ATR14 is 31 pips, relatively small.
Connecting indicators and charts
Today’s core focus is the FOMC policy rate at 3:00 AM tomorrow. Since the result spans dates, the intraday range is likely to see longer wait times within the expected range. The upper bound is supported by the daily MA200, and the lower bound by Pivot S2; intraday movement around Pivot P (157.78) with reactions near R1 at 158.14 and S1 at 157.58 will be indicative.
Also in video — USD/JPY Morning Fixed Observation

Answer for the previous business day
It was a yes. The closing price 157.94 was within the expected range of 156.89–158.26, ending within a consolidating range as anticipated. The range was 56 pips with a small bullish candle, a calm day indeed^^
Yesterday’s CB Consumer Confidence Index rose significantly to 91.7 from an expected 81.2. The USD/JPY range was 9.9 pips in 15 minutes and 22.6 pips in 60 minutes. Even with strong numbers, the initial move was downward, a less straightforward reaction.
Backtest data
The average USD/JPY range one hour after the FOMC rate release (for the past 25 occurrences) is 84 pips, and the share of cases where the initial direction continued after one hour is about 64%. Since it’s around 60%, chasing the first move can lead to whipsaws.
Today, the price closed above MA20. The rate of an upside breakout of MA20 the day after (over the past 10 years, 146 instances) is 49%, with an average move of +9 pips. It’s almost five minutes, so it’s not very indicative for direction.
Today's question
Which do you think will be tested first: breaking above 158.52 or breaking below 157.22?
If you like, please tell me with a like or a comment.
For those who want to run the same backtest in their own environment, I have placed a version where the rules are programmed.RCI Method MT4 Version / MT5 Version
Materials published by FX Method Research Institute on GogoJungle


※ Backtests are based on USD/JPY hourly data from January 2016 to March 2026. They do not guarantee future performance.
Indicator data: Edited from Forex Factory / Tradays; Prices: Twelve Data (as of 2026-10-28 09:00)
※ This is the personal view of the author. Please make investment decisions on your own.