

[Oct 27 Night EUR/USD] From the 1.12s down to 1.117 to end Monday — Structure of the market and near-term targets seen on LIGHTHOUSE
About LIGHTHOUSE
LIGHTHOUSE (Lighthouse) automatically displays the “readings” part of the chartAn auxiliary indicator for discretionary trading.
・Displays the direction of the higher timeframe and the current candle in five levels at the top left of the chart
・Automatically displays the highs/lows updates (HH/HL/LH/LL) and the BOS/CHoCH lines
・Displays pullback and retracement zones, support-resistance reversal zones, and a range box
・The marks for peaks and valleys appear after they are confirmed and do not move or disappear later (no repaint)
・The meanings of terms are shown at the bottom left of the chart, so you can learn while watching
Decisions to buy or sell are made by you, and this tool gathers the materials for decision-making at a glance.
【Key Points】EURUSD market notes up to the close on October 26 (Mon)
・On October 26 (Mon) it began at 1.12168, moved from a high of 1.12265 to a low of 1.11732, andclosed at 1.11738(about 0.0027 lower than the previous Friday’s close of 1.12008)
・The closed price for the week of October 18 is1.12008, lower than the prior week’s close of 1.12384 (week of October 11)
・The highs above are1.12008・1.12265, the lows below are1.11732・1.11523, these are the price ranges that tend to be watched first
1. A sense of the recent market (weekly, daily, 1-hour)
Weekly: week of October 18 close is 1.12008
Weekly close series: 9/20 week 1.13918, 9/27 week 1.12505, 10/4 week 1.12016, 10/11 week 1.12384, 10/18 week 1.12008. The week of October 18 had a high of 1.12604 and a low of 1.11799.
Daily: close just above the lows of Oct 12-13, finishing the Monday
Oct 12 low 1.11523, Oct 13 low 1.11514 with a rebound, Oct 15 close 1.12212, Oct 16 close 1.12384. From Oct 19 onward, closes were 1.12115, 1.12372, 1.12324, 1.12164, 1.12008, finishing at 1.11738 on Oct 26 (Mon).
1-hour: LL on the valley, trading below the retracement zone
In the image, the valley on Oct 23 and the valley just before noon on Oct 26 haveLL, and the peak at 26:00 hasHH, withBOS also appearing. The price is below the retracement zone above (around 1.1193–1.1207).
Noticeably watched price ranges (based on chart facts)
| 1.12265 | High on Oct 26 (Mon) |
| 1.12008 | Close on Oct 23 (Fri) |
| 1.11738 | Close on Oct 26 (Mon) |
| 1.11732 | Low on Oct 26 (Mon) |
| 1.11523 | Low on Oct 12 |
| 1.11514 | Low on Oct 13 |
Around events with announcements or statements by notable persons, price moves can be larger, so please check the schedule yourself. The prices in this text are up to the close on Oct 26 (Mon), and the chart image includes bars up to 15:00 server time on Oct 27 (Tue).
2. When viewing the same chart with LIGHTHOUSE
From here, we will view the same EURUSD chart with LIGHTHOUSE applied.
Daily chart (weekly on top): both weekly and daily show a “strong sell”
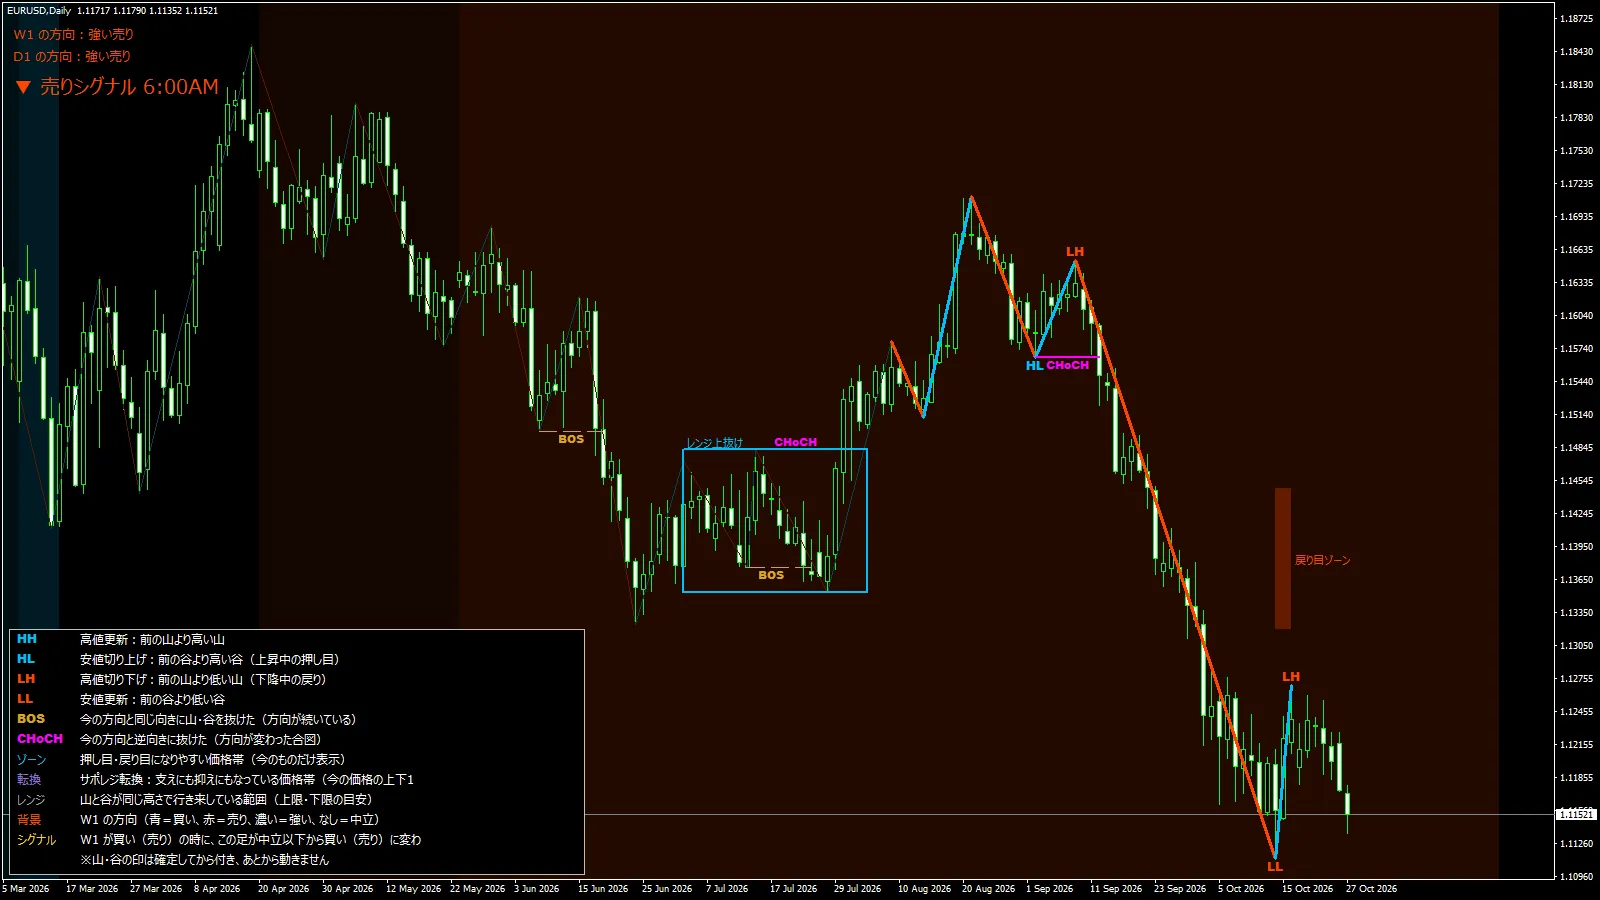
The top-left shows the direction of W1: strong sell, and D1: strong sell. From August’s peakHH, from September’s peakLH, and from October’s troughLL, withLH appearing at the subsequent peak, illustrating a downward flow via the sequence of peaks and troughs.
Above price, around 1.133–1.143, aretracement zone is displayed. The current price is well below this zone.
1-hour chart (daily on top): daily is strong sell, 1-hour is a sell
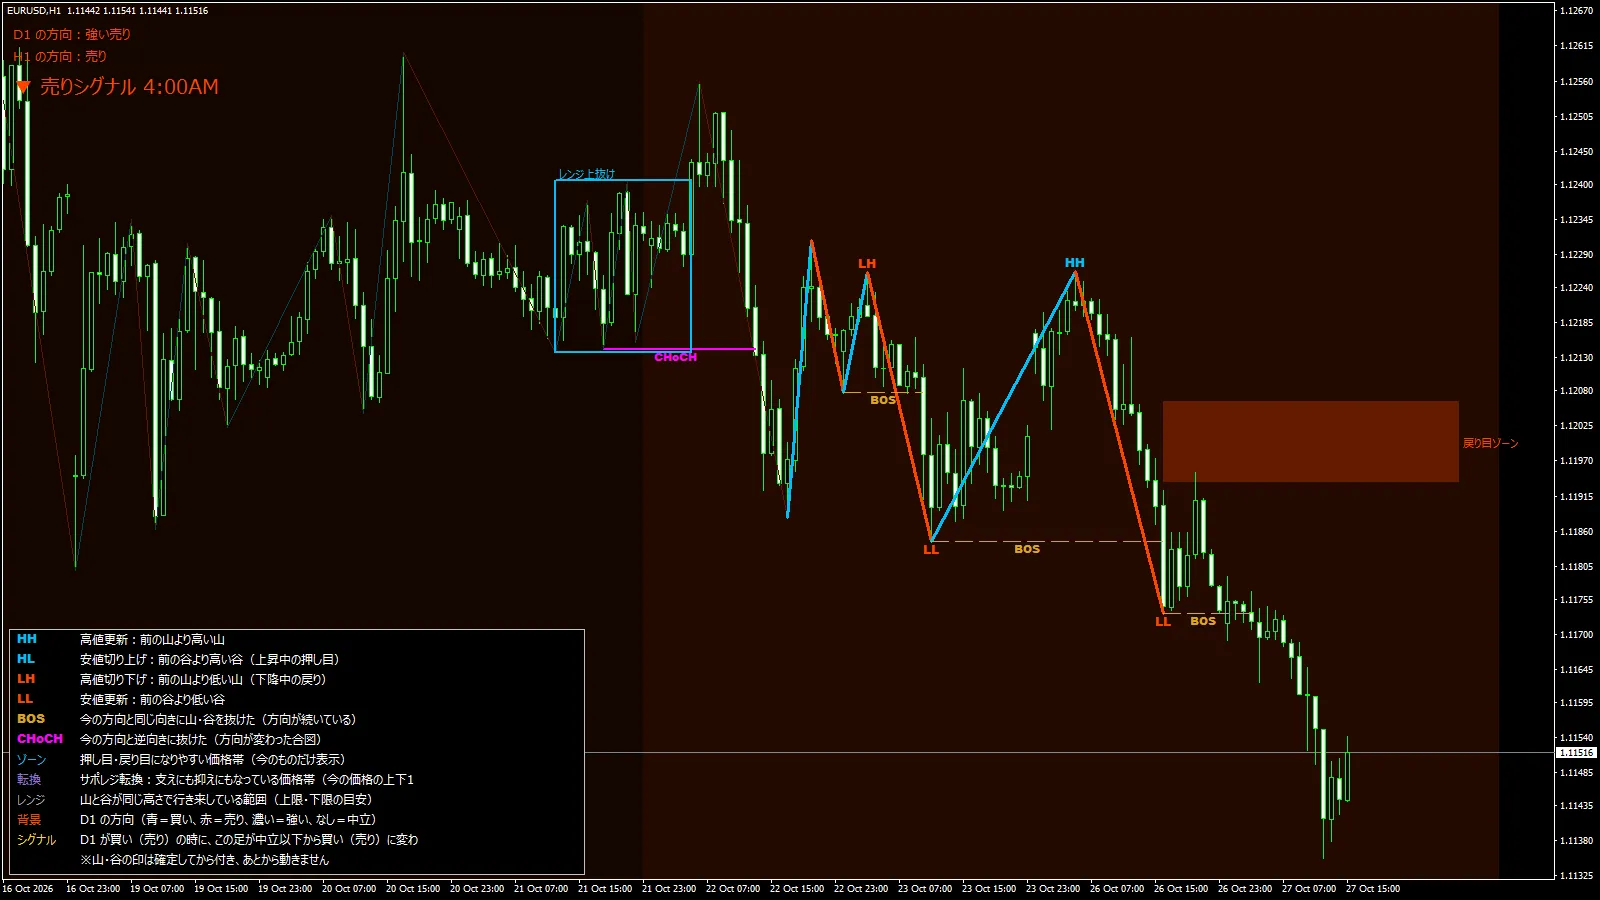
The top-left shows “D1: strong sell” and “H1: sell.” The valley on Oct 23 and the valley just before noon on Oct 26 haveLL, and the peak at 26:00 hasHH preceding it.
Above, around 1.1193–1.1207, aretracement zone is displayed. The price is below this zone.
5-minute chart (daily on top): 1-hour is selling, the current candle is strong buying
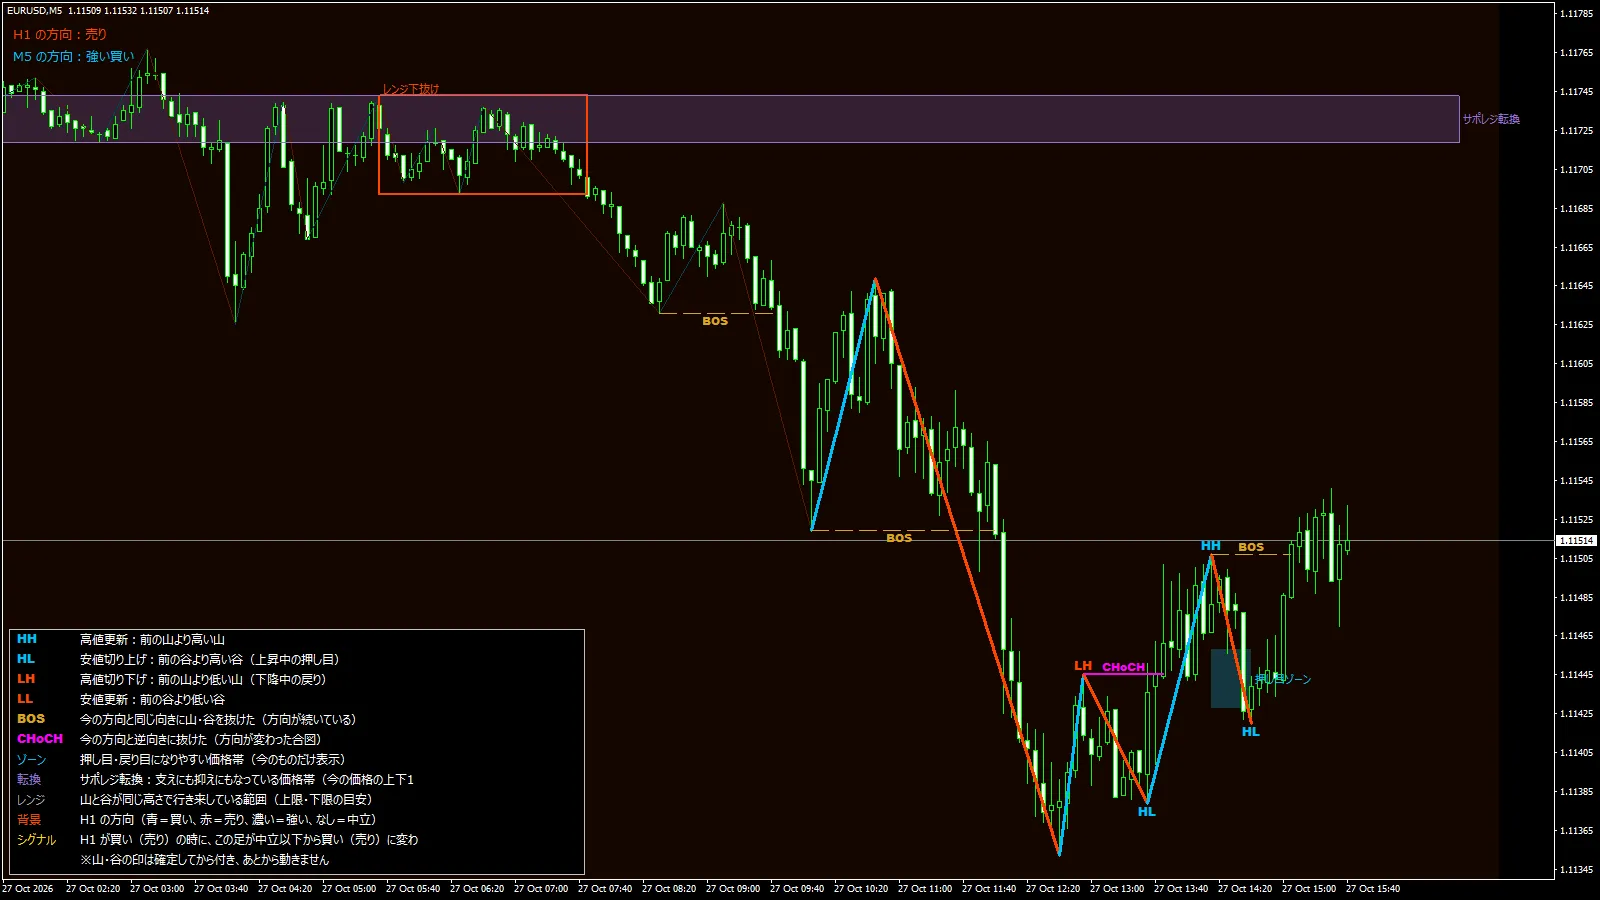
The 5-minute chart image covers up to 15:00 on Oct 27 (Tue) server time. On this day, the price dropped to 1.11352, thenHL andHH appeared,BOS also appeared, making the top-left read “M5 direction: strong buy.”
The 1-hour chart remains in a selling state, and the directions of the higher timeframe and the current candle diverge. When directions differ, you can inspect the two lines on the top-left side by side to see which will switch first.