
One hundred million traders (with evidence) released the leading indicator first
Based on market data as of October 27, 2026
A week when the US and Japanese monetary policies overlap.
How will the compatibility of methods change?
https://www.gogojungle.co.jp/tools/indicators/87547

This week, the schedule is packed: FOMC on Wednesday the 28th, the US 2–4Q GDP and PCE price index on Thursday the 29th, and the Bank of Japan's monetary policy meeting on Friday the 30th, all with potential to move the market. Weeks like this do not guarantee that methods that worked up to last week will continue to work unchanged. In this article, after summarizing the current situation for the dollar/yen and gold, we introduce the MT5 indicator “MIKIWAME” that automatically identifies winning methods for each phase.
Tools created by a trader who earned billions for himself
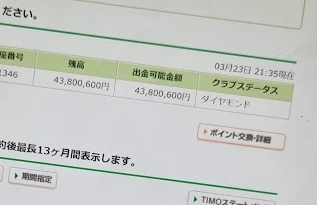
The developer of Mikiwake is an active trader who has amassed billions in profits in the market. He found, through experience with ICT, FVG, and SMC in actual trading, that “each method has times when it wins and times when it doesn’t.” Mikiwake is built directly from that conclusion. It does not judge the quality of a method; it uses only the currently functioning methods. It is a system the developer himself needed in daily trading.

Trading results on the developer’s own account. This is not a backtest result or performance measured using Mikiwake.
Current market conditions
Dollar/Yen: broke the range and pulled back
Last week, USD/JPY started in the upper 157s, briefly testing higher on oil prices driven by Middle East tensions and rising U.S. interest rates. However, due to political uncertainty in France and declines in AI-related stocks, risk-off sentiment strengthened and the pair broke below the 157 level, the month’s low. On Friday the 23rd, it fell to 156.08, a low not seen since September 18.
At the start of the week, with tech stocks recovering, U.S. rates and the dollar rebounded, and USD/JPY recovered toward the 50-day moving average. In Asian trading on the 27th, it hovered around 157.70.
From a chart perspective, the lower end of the range that had persisted since early October (around 157.20–157.50) was briefly broken to the downside, drawing selling at the lows, and is now attempting to return to the original range. The 156 level acts as support, and the lower boundary of the old range is acting as resistance above. If it decisively clears the 50-day line, the next target is the 200-day line (around 158.54).
For this week, MUFG shows a range of 154.50–158.50 yen. The view is that even if central bank messages tilt hawkish, if market anxiety re-emerges, the yen could be bought.
Monetary policy: expectations for holding steady, focus on “the next move”
Both the FOMC and the BoJ are generally expected to hold rates this week. Consequently, market attention shifts to the next policy directions that can be inferred from statements and press conferences. Regarding the BoJ, Governor Ueda’s remarks last week suggested there could be room for another rate hike in December, so attention is on Friday’s meeting’s guidance. The U.S. 10-year yield is near 5%.
This kind of week is more about interpretation after the announcements than the direct results themselves. Immediately after the announcements, spreads tend to widen and prices can swing with wicks, making both highs and lows targetable.
Gold: within a downtrend channel, can it break higher?
Last week, gold fell as much as 3.6% and ended around $4,012. The target for upside is around $4,110, and breaking clearly above this level is considered decisive. On the downside, around $3,895 is in focus. Gold, too, can be directionally influenced by the outcomes of the FOMC and PCE.
This scenario and the three methods
ICT, FVG, SMC. Each is a well-known approach, but each performs best in different market conditions. In a market like this week, their relative positions become clearer.
ICT
Reversal after making a swing low
Last week USD/JPY dipped to break below the range’s lower boundary, sweeping stops piled there, then reversed. The move through recent lows and highs before snapping back resembles ICT’s liquidity sweep. In weeks with pronounced intraday wicks around announcements, this pattern appears more often.
FVG
Filling the gap after momentum
When a large one-way move occurs, gaps (FVG) remain. If the overall trend is in the same direction, waiting for pullbacks or retracements to the gap is the idea behind FVG. However, during range-bound periods, the direction of the trend is less settled.
SMC
Riding the structure update
A decisive breakout above the 200-day moving average or an explicit structural update such as a break below 156 can bring SMC into play. It is strongest when a clear trend exists, and tends to be a back-and-forth in a range.
In short, this week the suitable method may switch between range-trading and trending as announcements trigger moves. It is hard to predict in advance which way it will go. Therefore, a system that reselects the winning method based on “what is working now” is useful.
What Mikiwake does
Mikiwake draws structures such as BOS/CHoCH, FVG, order blocks, and premium/discount on charts, and automatically tests ICT, FVG, and SMC on the most recent 20 trades for each. As each candle closes, it re-validates back to 3,000 bars, so you don’t need to run separate backtests in another software.

In the bottom-left of the chart, you’ll see the asset progression for each of the three methods over their most recent 20 trades, measured in R-units with a 1 for the stop. Only methods with a positive total R display entry arrows and mark profit exits with circles. If a method’s performance deteriorates, it automatically silences, and then signals again if it recovers. The switching pattern—ICT winning in ranges and SMC taking over when a trend begins—also appears on screen.Indicator available here

The top-left panel consolidates the big trend and the small trend, the nearest unfilled FVG, the Weak High/Low where stops tend to accumulate, and the current position within the range, all in one panel. For USD/JPY this week, you can confirm whether you are above or below the range lower boundary and whether the big and small trends are aligned.

When a signal is active, it displays the entry price, stop loss, take profit (RR 2.0), plus the recommended lot size and stop loss amount calculated from capital and risk percentage. In weeks with large price swings, calculating the lot size from the stop loss is especially important.
Notes for use during event weeks
Mikiwake’s validation does not include spreads, fees, or slippage. After FOMC or BoJ announcements, spreads often widen and fills may not occur at the exact prices used in validation. Before and after announcements, even if signals appear, consider waiting or reducing position size at your own discretion.
Also, if any method has negative results for the most recent 20 trades, Mikiwake will not issue a signal. “Not taking action now” is also a valid decision.
Turn doubt into validation.
Don’t let the market choose the method for you; let the market choose for itself.
MT5 indicator “Mikiwake (MIKIWAME)”https://www.gogojungle.co.jp/tools/indicators/87547
【Reference】
FXStreet “Japanese Yen: Risk aversion drives gains against US Dollar - MUFG” “Japanese Yen weakens with Fed and BoJ monetary policy meetings in focus” “USD/JPY Price Forecasts: US Dollar shows hesitation below 157.20 area” (October 26, 2026)
FOREX.com “USD/JPY bulls back in business as AI trade roars back” (October 26, 2026)
Exchange Rates UK “USD/JPY Forecast: The Dollar Is Recovering Against The Yen, But Obstacles Ahead” (October 26, 2026)
Investing.com “Asian currencies mixed as dollar holds firm, yen retreats ahead of Fed decision” (October 27, 2026)
RoboForex “Gold (XAUUSD) weekly forecast for 26–30 October 2026” (October 23, 2026)
【Note】This article reflects market整理 based on publicly available information as of October 27, 2026 and does not constitute investment advice. The indicator provides decision-making material, but does not guarantee profits. The backtest results shown are based on historical data and do not include spreads, fees, or slippage and do not indicate future performance. The suggested Lot is calculated from the input funds and risk percentage. The trading performance shown for the developer is historical and does not guarantee similar results from using this indicator. Please make investment decisions and trading at your own risk. The chart images are for demonstration during development.