

CALDO GOLD | October 26, three scenes that led to profit. Introduced with diagrams from signal to settlement [Episode 5]
From a buy signal to a +7.234 dollar width. From a sell signal to a +7.010 dollar width.CALDO’s saved record for Monday, October 26 showed situations where both rising and falling movements led to profits.
“What kind of trade will it be after the signal?” This time, we overlay the three profitable cases onto actual price movements,from the entry position to the exit profitand explain with diagrams. See CALDO in action with specific prices and times.
※ The three figures shown are from the three profits out of six confirmed cases. Among the six total, there are three wins and three losses, for a total of +3.898 dollars per ounce. There is one additional case awaiting confirmation, so the daily results are provisional. These are not actual account trade results.
From a buy signal to +7.234 dollars: the 16:25 scene
First, look at the buy signal at 16:25. The saved entry level is4007.896. It then moved up and down, rising before 17:00.At 17:06:30, exit with a profit at 4015.130.
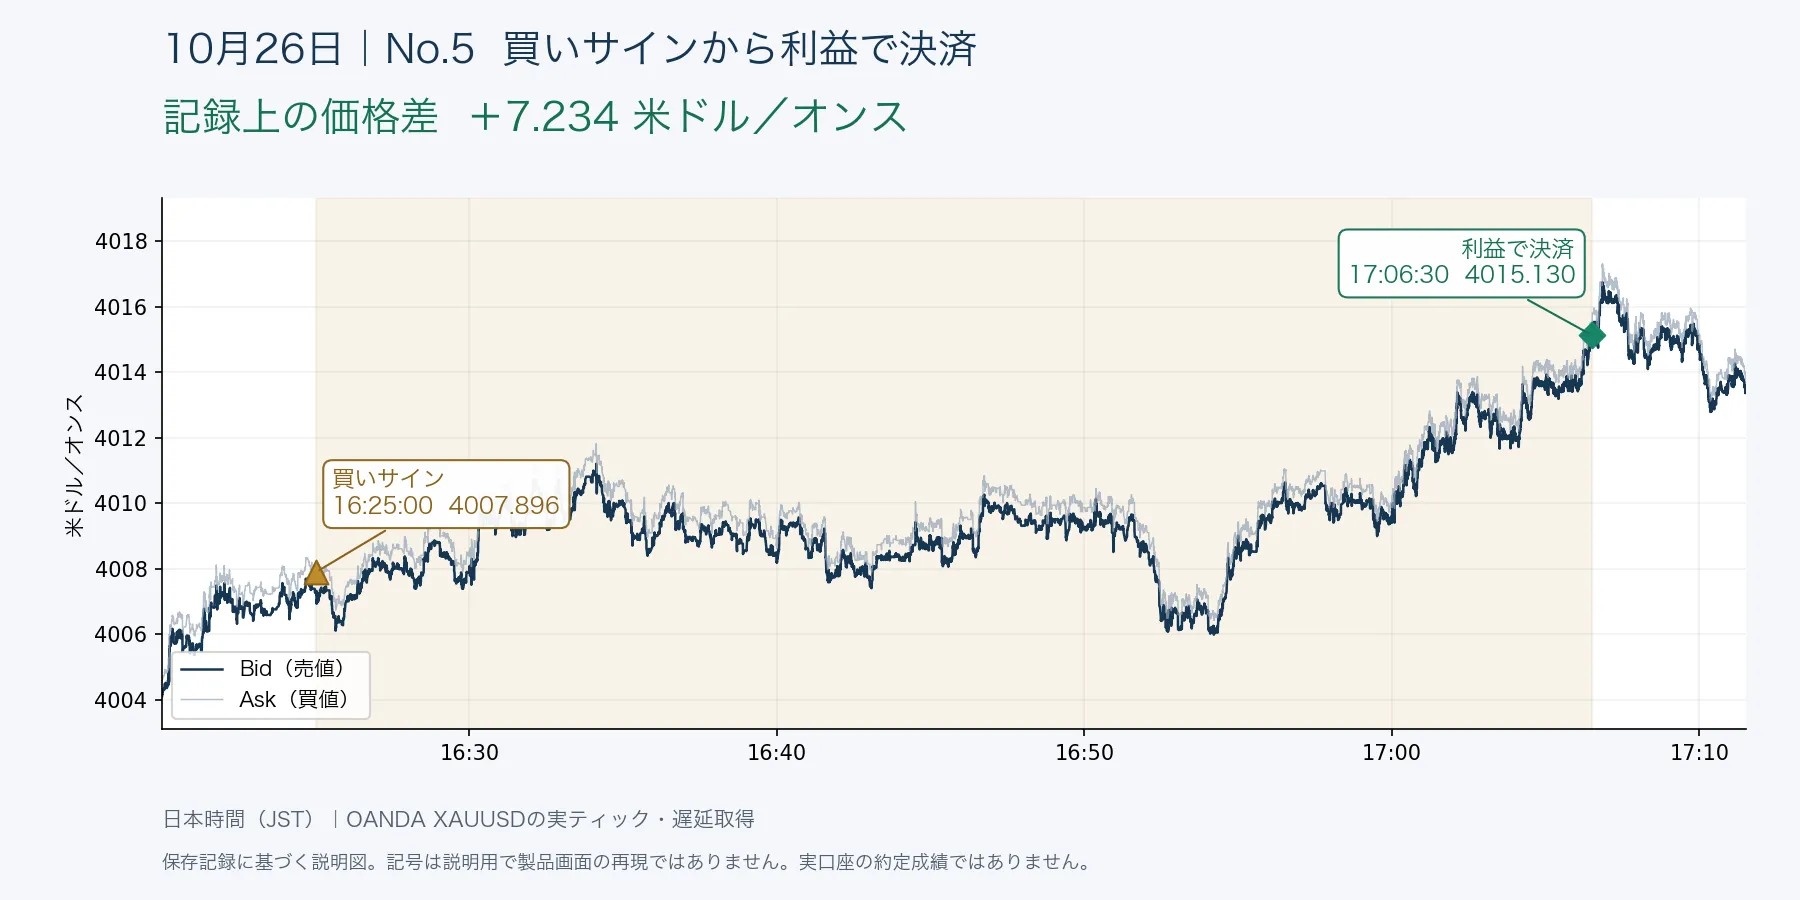
4007.896 → 4015.130 = +7.234 dollars per ounce.This is a scene where the position of the entry and the point at which profit is secured can be viewed as one flow.
From the diagram, the move from entry to exit was not a straight rise. Including the fluctuations along the way, CALDO records provide indicators for entry and settlement. Moving beyond a “feels like it will rise” sense tocheck the signal position and the profit-target for settlementgives a clearer sense of how to use it.
From a sell signal to +7.010 dollars: about 1 minute 20 seconds of decline
At 08:45 in the morning,a sell signal at 3997.370was recorded. The price then declined step by step. It settled at 3990.360 at 08:46:19,for a gain of +7.010 dollars per ounce.
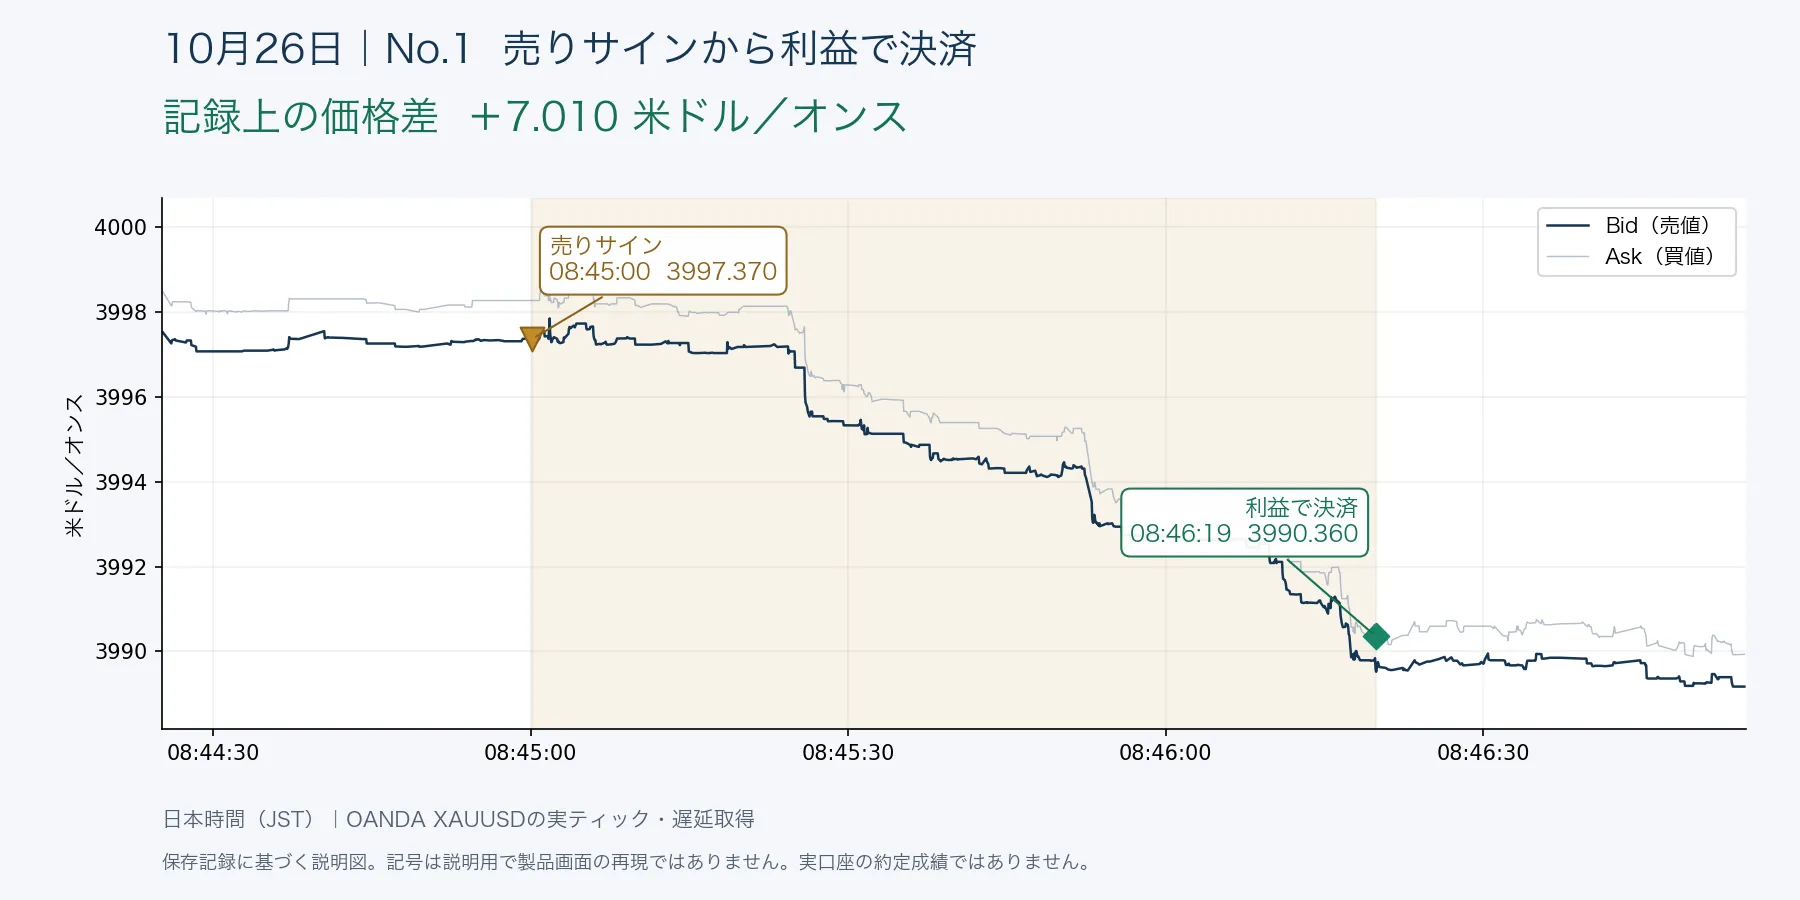
This is an example of capturing a decline, not a rise. Even for short price movements, when “where to consider selling” and “where to end the trade” are shown by price, the trade flow becomes concrete. This diagram shows that price movement; it does not guarantee that actual orders will fill at the same prices.
Evening buy signal also yields +6.340 dollars
At 20:30,a buy signal at 4015.210appeared. After a dip and a back-and-forth, the price rose and reached 4021.550 at 21:28:24 to settle.recorded +6.340 dollars per ounce.
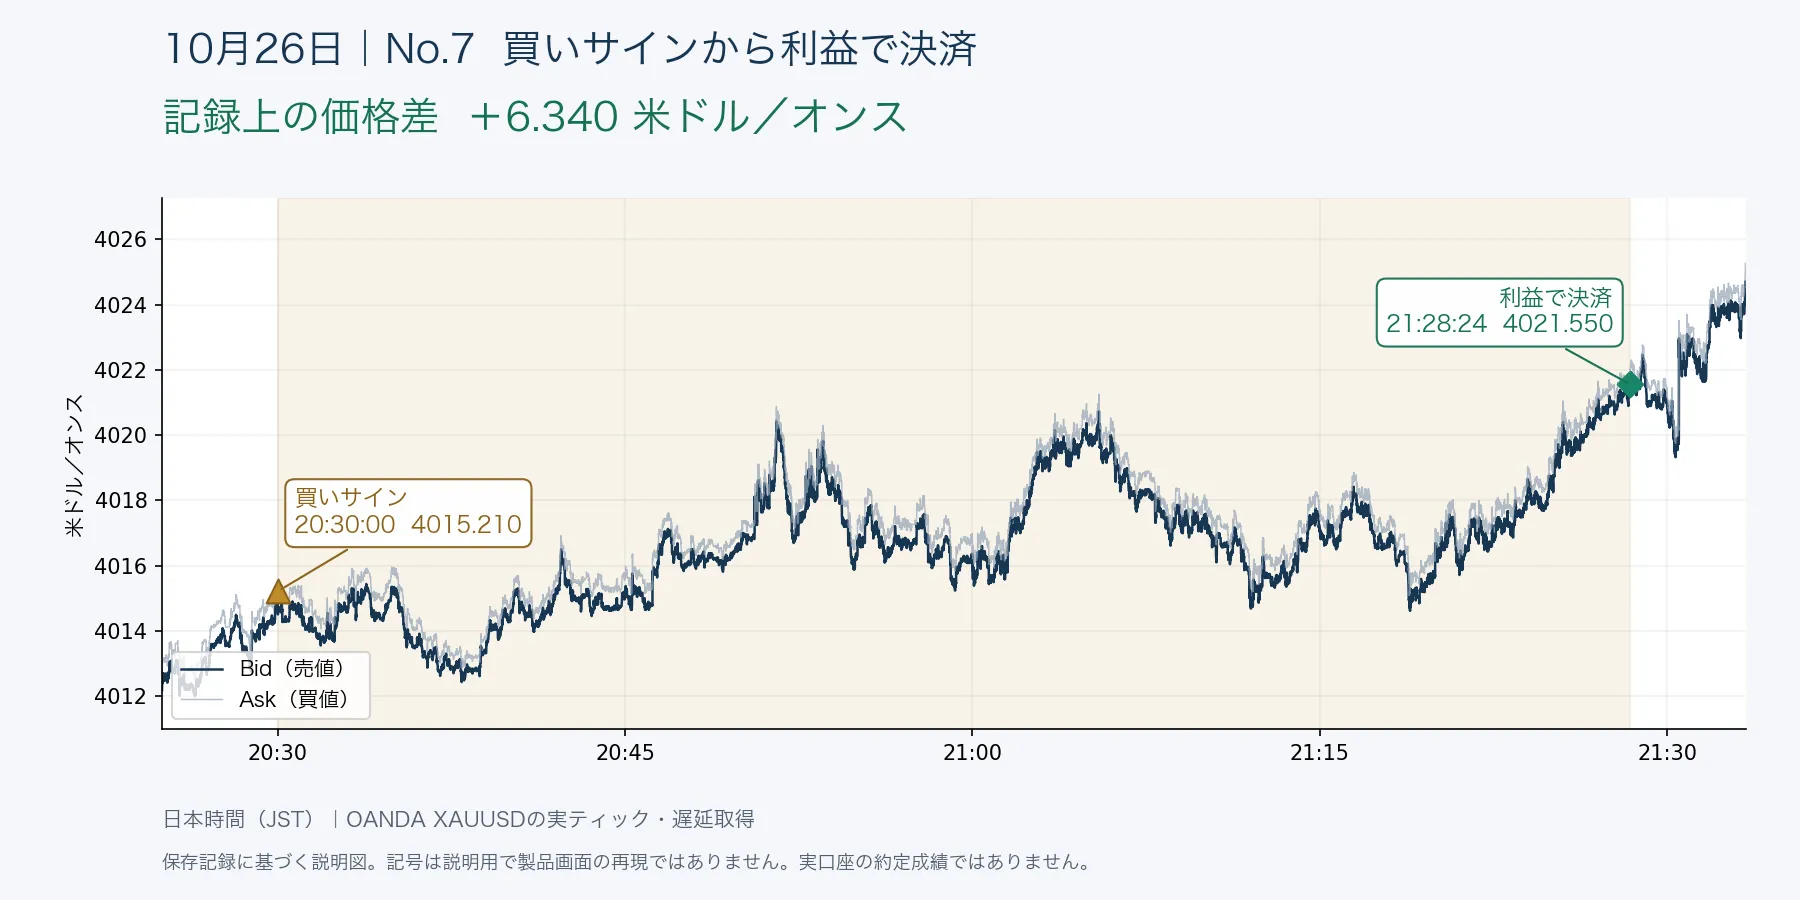
In this scene too, entry is not replaced with a low, and exit with a high. The saved signals and settlements are charted as they are. From CALDO’s records,which part of the price movement was treated as the tradeis visible.
Figure numbers correspond to the chronological list below. A darker line is Bid (selling price), a lighter line is Ask (buy price), a gold triangle marks the entry of the signal, a green diamond marks the settlement, and the light gold band indicates the holding period. These are diagrams based on real tick data from OANDA XAUUSD, with symbols used for explanation. They are not screenshots of the product page.
CALDO’s appeal is that it can concretize the trade from entry to exit
Even while looking at charts, you may hesitate to enter or hesitate to settle after a profit. In these three examples,the direction of buy/sell, entry position, and settlement positioncould be traced by time and price.
If you are considering CALDO, focus on this aspect: that the sequence of trade steps becomes visible. Use the signal as a decision material, and compare with your own chart perspective. Having targets for entry and exit makes CALDO a concrete vision of how to use it.
Apply entry and exit targets to your own GOLD trades as well.Please check the product page for compatible environments, features in the retail version, and usage terms.
▶ View CALDO product page and consider purchasing
Overall performance and records for October 26
What has been introduced here are the three profitable cases. The six confirmed cases in total also include three losses.
| Category | Cases | Wins/Losses | Total price difference (dollars per ounce) |
|---|---|---|---|
| Buy signals | 4 | 2/2 | +3.083 |
| Sell signals | 2 | 1/1 | +0.815 |
| Total | 6 | 3/3 | +3.898 |
Confirmed six cases with a win rate of 50.0%, PF 1.23. Total profit range 20.584, total loss range 16.686, net +3.898 dollars per ounce. 0 draws, 0 unsettled among confirmed six cases. One buy record around 12:50 is treated as pending alignment and has not been assigned a win, loss, or P/L.
| No. | Direction | Entry time | Entry price | Settlement time | Settlement price | Price difference |
|---|---|---|---|---|---|---|
| 1 | Sell signal | 08:45:00 | 3997.370 | 08:46:19 | 3990.360 | +7.010 |
| 2 | Sell signal | 10:30:00 | 3987.690 | 11:05:00 | 3993.885 | -6.195 |
| 3 | Buy record・pending confirmation | 12:50頃 | — | — | — | Pending verdict |
| 4 | Buy signal | 14:35:00 | 4017.250 | 15:10:00 | 4009.390 | -7.860 |
| 5 | Buy signal | 16:25:00 | 4007.896 | 17:06:30 | 4015.130 | +7.234 |
| 6 | Buy signal | 19:55:00 | 4014.741 | 20:10:00 | 4012.110 | -2.631 |
| 7 | Buy signal | 20:30:00 | 4015.210 | 21:28:24 | 4021.550 | +6.340 |
Aggregation conditions
Records with entry times of October 26, 2026 00:00 or later and before October 27, 00:00 are included; settlement confirmation deadline is October 27, 08:00. All times are Japan Time (JST). The table uses second-level display; verifications were done using the original records’ millisecond timestamp.
Regarding OANDA-Japan MT5 Live’s XAUUSD, CALDO’s saved records were retrieved late on October 27 and cross-checked against actual Bid/Ask. Buys used Ask for entry and Bid for settlement; sells used Bid for entry and Ask for settlement, using the existing price structure without changing entry/settlement/spread. Additional fees, swaps, and slippage are not included. In a reference conversion where 1 contract = 100 ounces, the total across six cases is +389.80 US dollars.
On that day, there were live version and display setting switches, and although all saved destinations were cross-checked, about the 12:50 record, the correspondence between display and settlement was not yet determined. Completeness is in progress, and it does not indicate consecutive real-time observations or actual account profits. Since this includes a reference display for owners, it cannot be guaranteed that all shown signals match the retail version. Please check the product page specs before purchasing.
Profitable scenes are past individual examples and do not guarantee future profits of the same type. Please make your own trading decisions.