
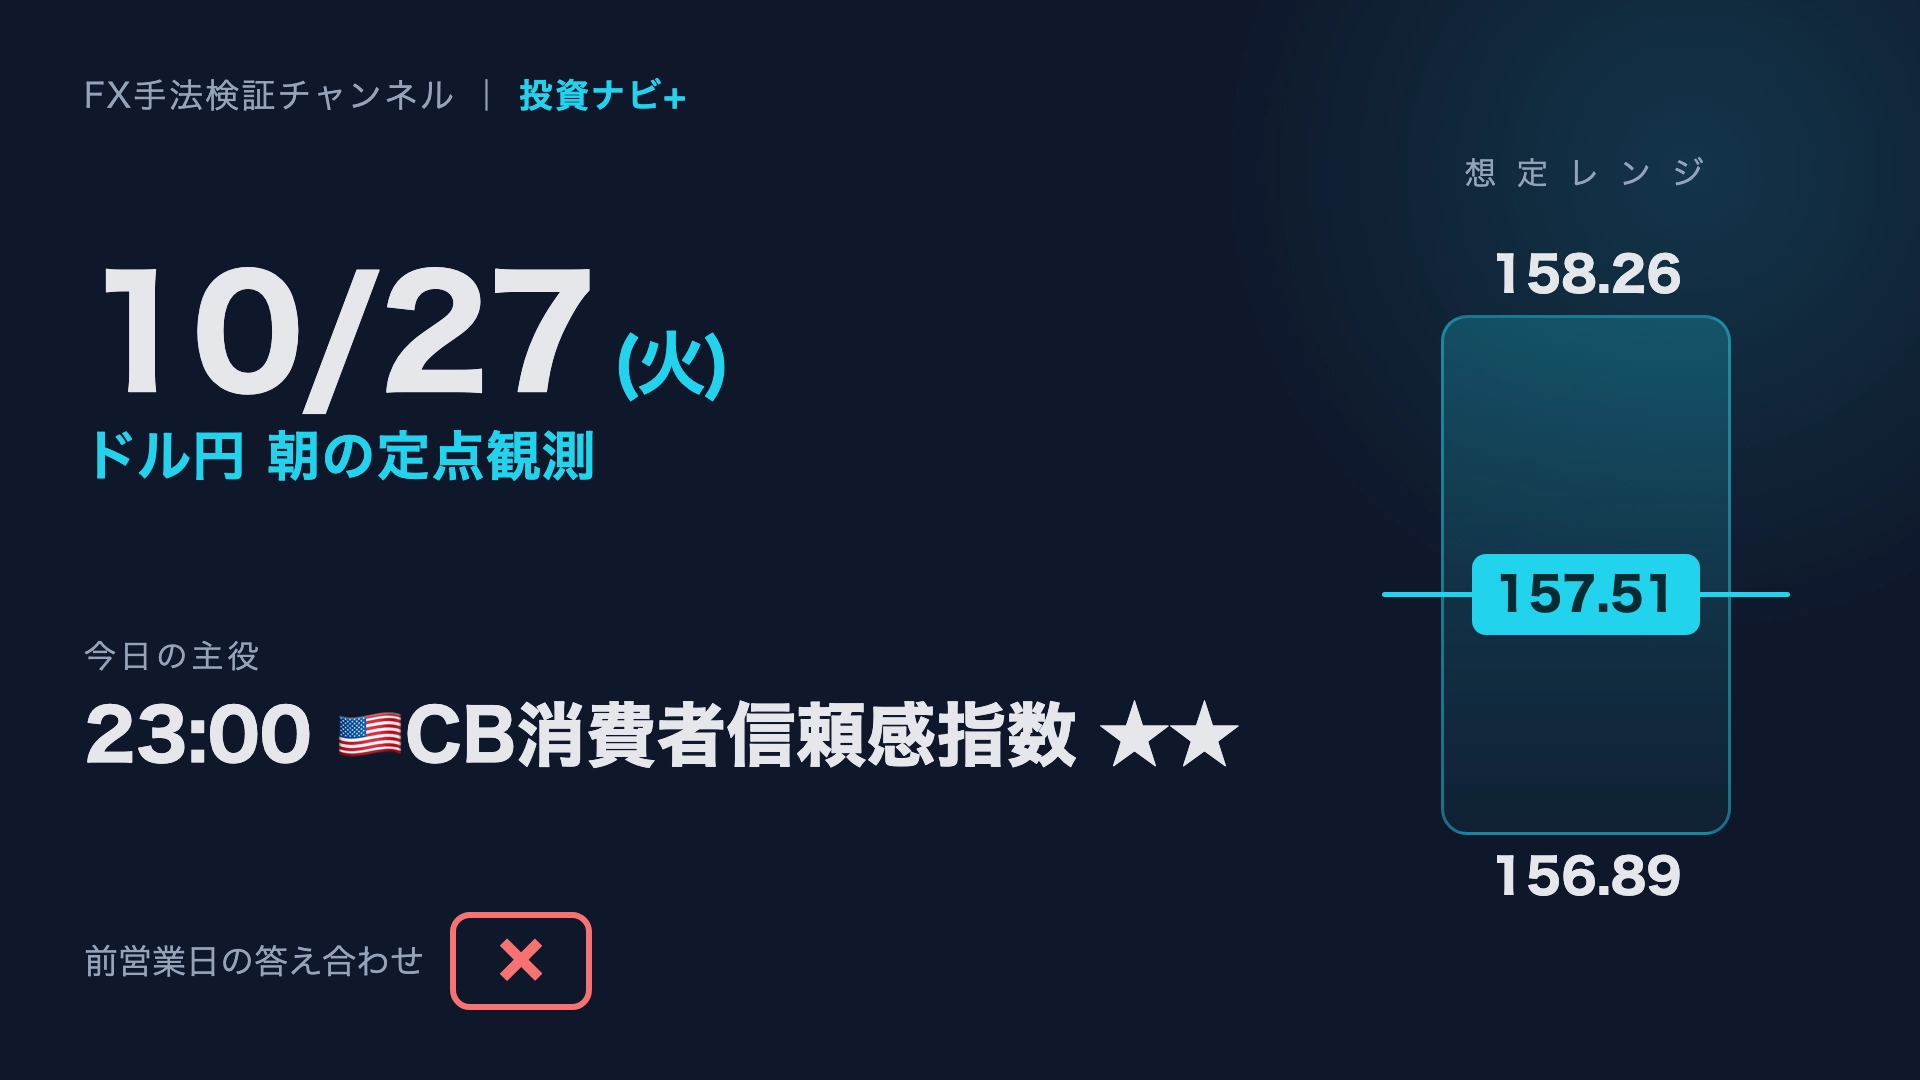
[Oct 27 Tue] Dollar-Yen Morning Fixed Observation|Star is 23:00 U.S. CB Consumer Confidence Index★★
This is the morning record for Tuesday, October 27. Today's star is 23:00 USD CB Consumer Confidence Index★★. USD/JPY is currently 157.51 yen, with an expected range of 156.89 to 158.26 yen.
The answer for the previous business day was a miss. Below are the indicators, charts, and scenarios in order.
First 60 seconds | Today's economic indicators

Today's economic indicators (10/27 8:30 ~ next day 8:29 JST)
| Time (JST) | Country | Indicator | Importance | Forecast | Previous |
|---|---|---|---|---|---|
| 08:50 |  | Capex Services Price Index (YoY) | ★ | 3.7% | 3.7% |
| 09:01 |  | BR C Market Price Index (YoY) | ★ | 1.6% | 1.4% |
| 14:00 | | BOJ Core CPI (YoY) | ★ | 1.9% | 1.8% |
| 17:00 |  | West Unemployment | ★ | 9.9% | 9.9% |
| 18:00 | | M3 Money Supply (YoY) | ★ | 3.5% | 3.5% |
| 18:00 | | Loans to Private Sector (YoY) | ★ | 3.1% | 3.1% |
| 21:15 |  | ADP Weekly Employment | ★ | — | 18.5K |
| 21:30 | | Durable Goods Orders ex Transportation (MoM) | ★ | 0.6% | 0.3% |
| 21:30 | | Durable Goods Nondefence (MoM) | ★ | 2.0% | 0.0% |
| 22:00 | | FHFA Home Price Index (MoM) | ★ | 0.2% | 0.3% |
| 22:00 | | S&P Case-Shiller Home Price Index (20-City YoY) | ★ | 2.6% | 2.5% |
| 23:00 | | CB Consumer Confidence | ★★ | 81.2 | 81.9 |
| 23:00 | | New Home Sales | ★ | 651K | 684K |
| 23:00 | | Richmond Fed Manufacturing Index | ★ | 0 | -2 |
| Next 05:30 | | API Weekly Crude Oil Stock | ★ | — | — |
Tonight's movers
The 23:00 US CB Consumer Confidence Index is expected to 81.2 vs. the prior 81.9, and the market anticipates a slight deterioration. If it beats expectations, the dollar tends to rise; if it misses, the dollar tends to weaken. It reflects consumer sentiment and, since the DI of the employment outlook is watched together, it can ripple into USD/JPY as well. With FOMC starting tomorrow, there may be periods where cautious watching is favorable today as well.
USD/JPY—Current Position
Current Value157.51 (Previous close 157.50 / +0.67 from the previous day)
Forecast Range156.89 (Pivot S1) ~ 158.26 (Pivot R2)
Main scenarioChop between 156.89 and 158.26. Direction awaits US data after 23:00
AlternativeBreak above 158.26 to test 158.52 / Break below 156.89 to 156.28
Daily chart environment
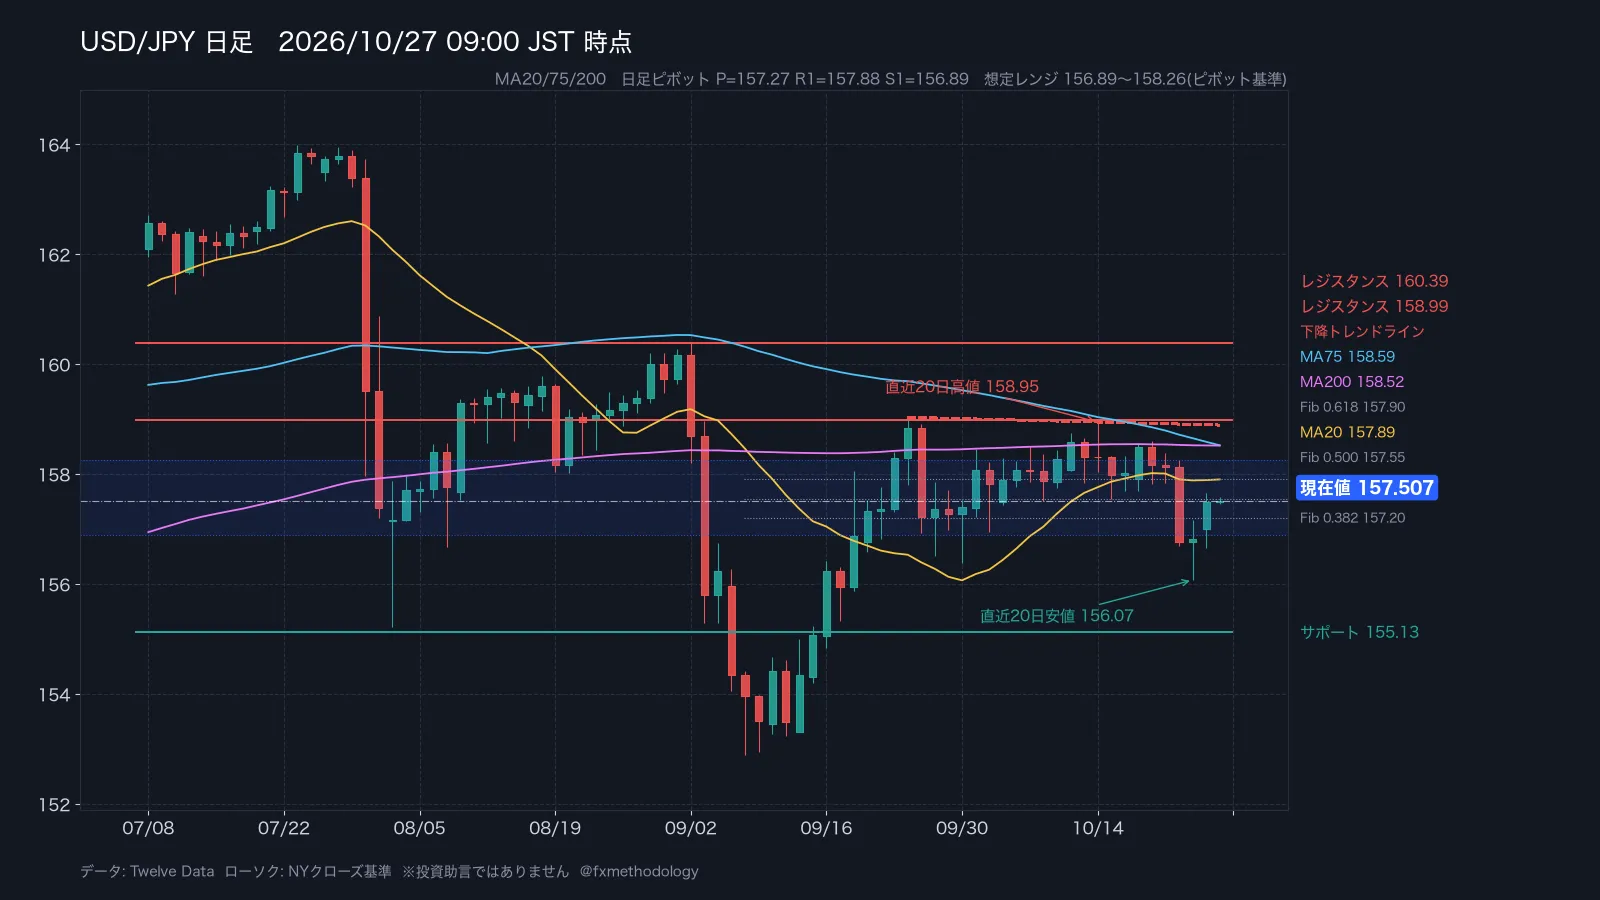
The daily chart is in a range, with MA crossings having no clear order. The three moving averages are intertwined with no clear directional bias. The current value 157.51 is below MA20 at 157.89. The upper boundary is detected at 158.99 and the lower at 155.13. The 20-day high is 158.95 (10/14), the low is 156.07 (10/23). As a retracement from 159.03 to 156.07, 0.5 corresponds to 157.55 and 0.618 to 157.90, placing the current level near the halfway mark. ATR14 is 85 pips.
4-hour chart: notable lines
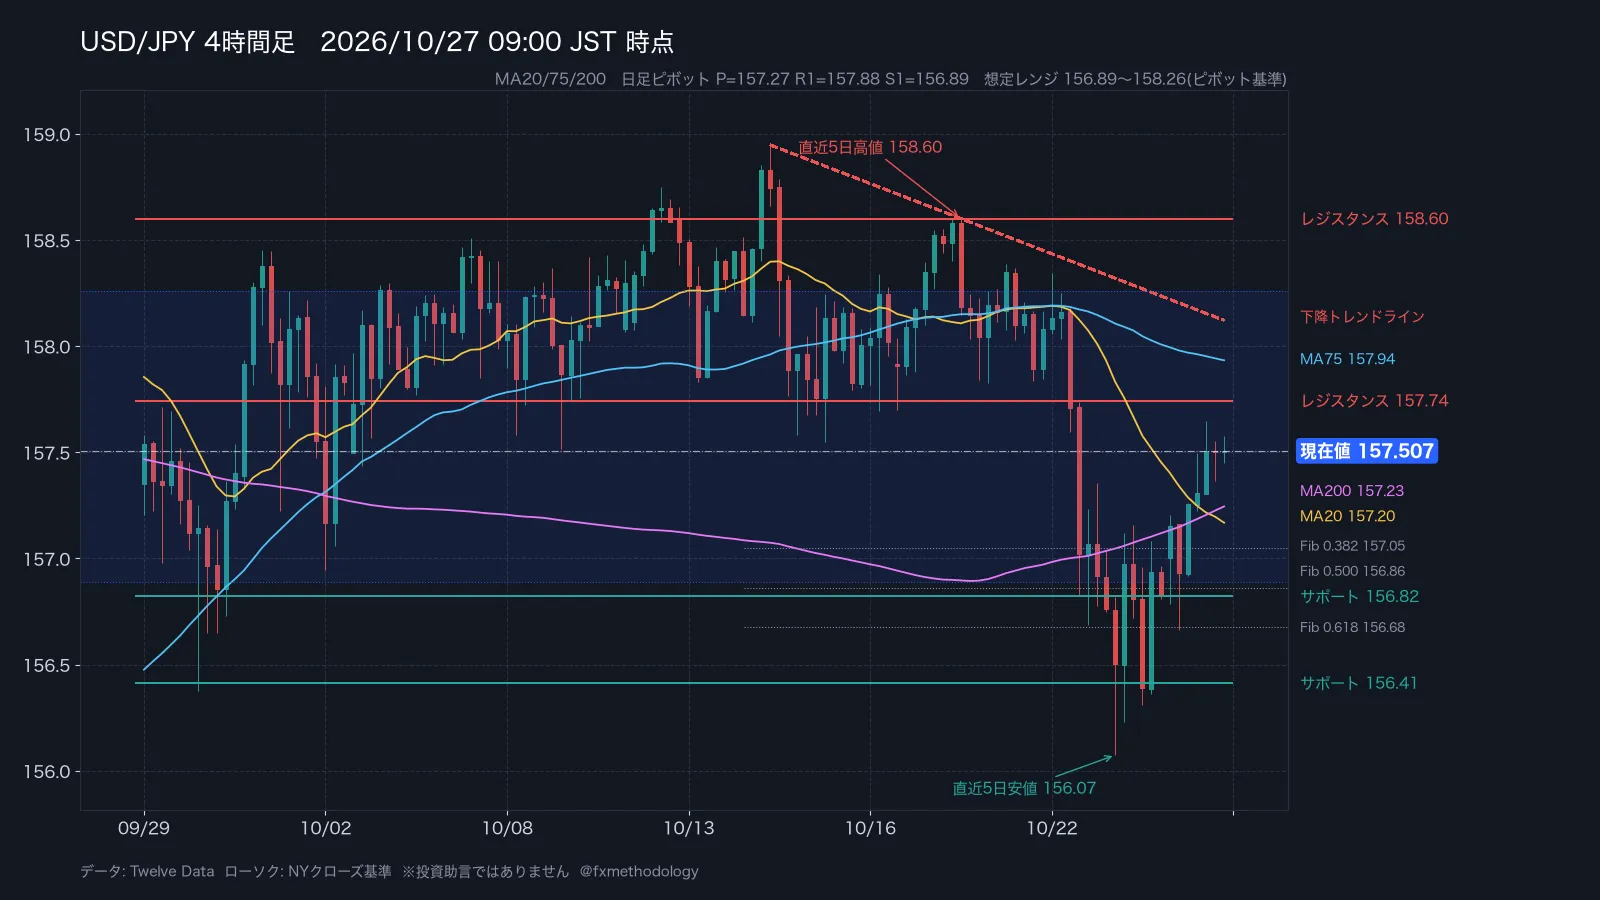
The 4-hour chart also shows MA crossings (no clear order). The current price remains above MA20 at 157.20. Up targets are 157.74, then 158.60; down targets are 156.82 and 156.41. The downtrend line starting 10/14 (not 9/24) sits near 158.14 this morning. For the rise from 156.07 to 157.65, the 0.382 level is at 157.05, close to 156.82.
Connecting indicators and charts
Focus on 23:00 US CB Consumer Confidence Index (★★). Until then, movements tend to center around Tokyo and London time, with a likely emphasis on oscillation around Pivot P (157.27). The expected range is Pivot S1 (156.89) to R2 (158.26); a breakout above 158.26 could target 158.52, and a break below 156.89 could target 156.28 as the next reference points.
Also in video | USD/JPY Morning Fixed Observation

Answer for Previous Business Day
Miss. The expected range was 156.21–157.30, but yesterday’s close was 157.50, breaking the upper bound and ending there. It moved upward while remaining within the assumed range, so we accept the miss as such ^^;
Yesterday, USD/JPY closed at 157.50, +0.67 from the previous day, with a 99-pip gain and a bullish day. The high was 157.65 and the low 156.66, rising within roughly a 1-yen range.
Verification data
Average intraday USD/JPY range 1 hour after the US CB Confidence release (38 cases) is 35 pips, and the share of times the direction persisted after 1 hour was 66%.★★ This indicator tends to extend more than expected. With discretionary trading, riding that initial move can be challenging ^^;
Today’s morning is a day where the close was below all three moving averages. The next day’s bullish occurrence after a close below all three MAs (over the past 10 years, 515 cases) is 56%, with an average change of +4 pips. The bias is small, making it hard to predefine the direction.
Today’s question
Which will be tested first: 158.26 or 156.89?
If you’d like, please tell us with a like or comment.
This is from FX Methodology Institute published on GogoJungle


※ The verification data is based on USD/JPY hourly data from January 2016 to March 2026. It does not guarantee future performance.
Indicator data: self-edited based on Forex Factory / Tradays. Price: Twelve Data (as of 2026-10-27 09:00)
※ This is the personal view of Tsuji. Please make your own investment decisions.