

[10/27 Night Gold] Summary | Structure of the market as seen by LIGHTHOUSE and recent target opportunities
About LIGHTHOUSE
LIGHTHOUSE (Lighthouse) automatically displays the chart's “readings” sectionas a discretionary trading auxiliary indicator.
・Displays the direction of the higher timeframe and the current candle in five levels at the upper left of the chart
・Automatically displays high/low updates (HH/HL/LH/LL) and the BOS/CHoCH lines
・Shows pullback and retracement zones, support-resistance reversal zones, and range boxes
・The marks for peaks and valleys are confirmed and do not move or disappear afterward (no repaint)
・Because definitions are shown at the lower left of the chart, you can learn them while looking
While making your own trading decisions, it is a tool to quickly gather the basis for decisions.
【Key Points】Gold market memo up to the close on Monday, October 26
・From the high on January 295598.15to the low on October 233975.63it has fallen
・The close on October 26 (Monday) is4017.04(high 4029.88, low 3978.13 on that day)
・The highs are4029.88 and 4034.11, the lows are3978.13 and 3975.63, which are the price ranges likely to be watched first
1. Latest market feel (weekly, daily, 1-hour)
Weekly: from the week of October 12, close fell from 4164.16 to 3997.85
The weekly closes were 4285.20 for the week of September 21, 4139.39 for the week of September 28, 4194.50 for the week of October 5, 4164.16 for the week of October 12, and 3997.85 for the week of October 19–23. The week of October 19–23 had a high of 4190.35 and a low of 3975.63, finishing about 166 lower than the previous week's close.
Daily: after about a 117-point drop on the 22nd, in the range 3975–4030
The close on October 21 was 4141.20. On the 22nd, it moved from a high of 4145.39 to a low of 4021.06, closing at 4024.37. On the 23rd, it fell to a low of 3975.63 and closed at 3997.85; on the 26th (Monday), it moved between 3978.13 and 4029.88, closing at 4017.04.
Hourly: the October 22 low was not breached on the 26th
After falling to 3975.63 around 17:00 on the 23rd, the 26th saw a low of 3978.13 at 04:00 and 3988.75 at 16:00, but the 23rd's low was not broken. A high of 4029.88 was reached around 20:00, and from 21:00 to 23:00 the range was 4008–4022.
Price ranges that tend to attract attention (based on chart facts)
| 4145.39 | High on October 22 (start of this decline) |
| 4034.11 | High on the 23rd (16:00) |
| 4029.88 | High on the 26th (20:00) |
| 4017.04 | Close on Monday, October 26 |
| 3978.13 | Low on the 26th (04:00) |
| 3975.63 | Low on the 23rd (17:00) |
Around events like economic releases and remarks from officials, price movements tend to be large, so please check the schedule yourself. The chart image also includes slightly the session around 1:00 server time on Tuesday, October 27 (numbers in parentheses refer to the close on October 26).
2. When you view the same chart with LIGHTHOUSE
From here, we will view the same gold chart with LIGHTHOUSE included.
Daily chart (higher timeframe is weekly): both weekly and daily show a “strong sell”
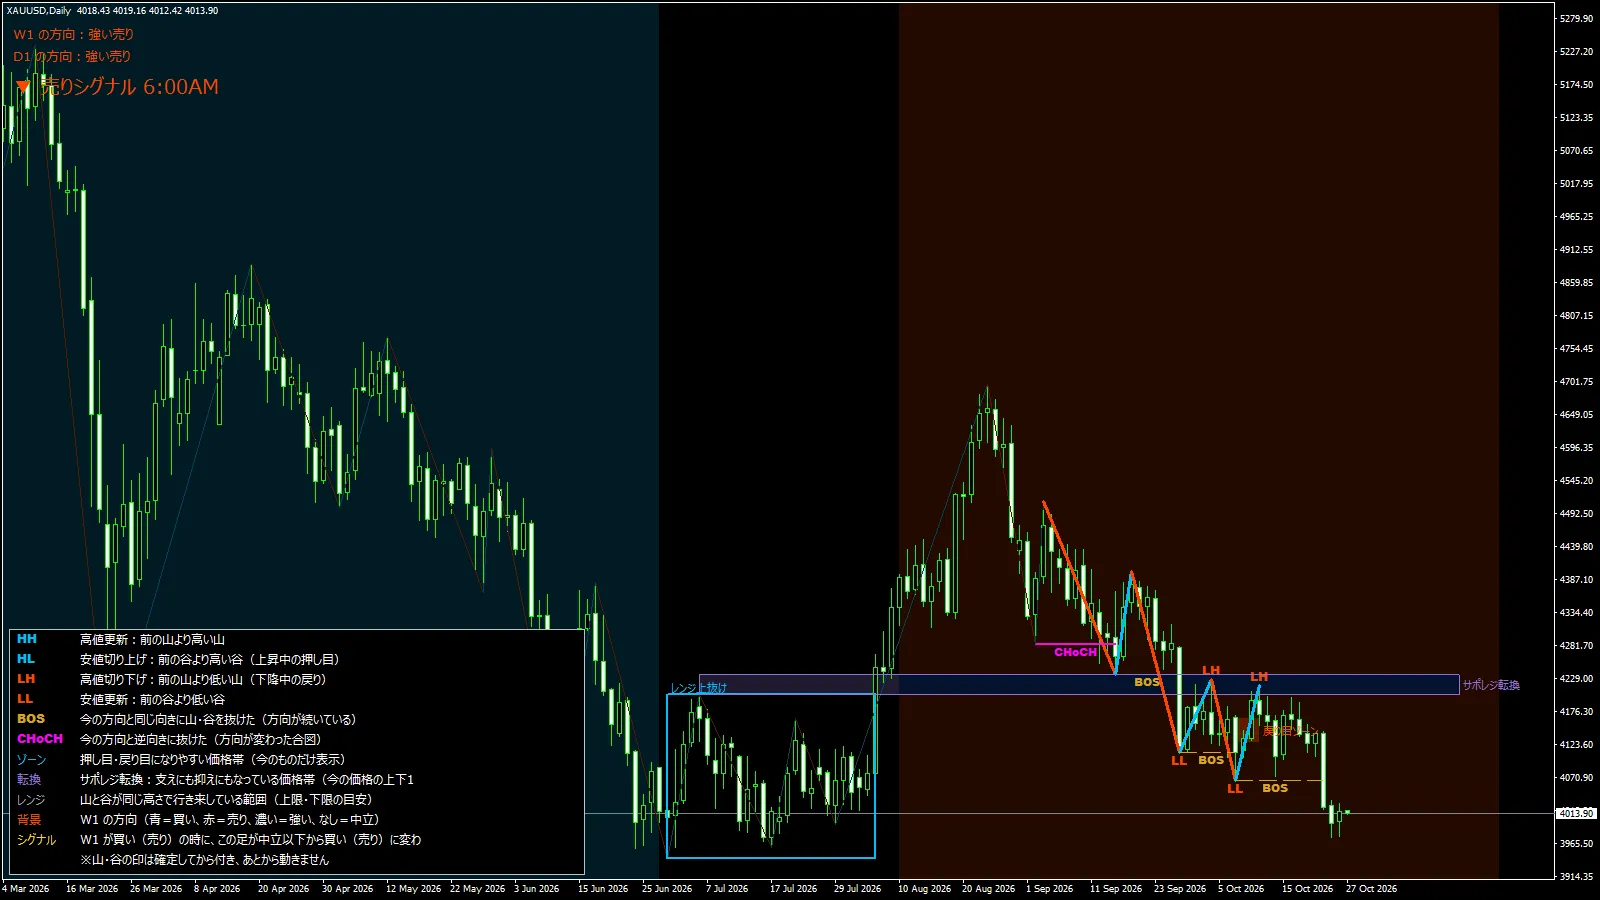
In the upper left, the direction is “W1: strong sell” and “D1: strong sell.” From September through October, at the valleysLL andBOS appeared, and at the peaksLH appeared.
Above price, near 4205–4235, there is asupport-resistance reversal zone displayed. The current price is well below this zone.
1-hour chart (daily is the higher timeframe): daily is strong sell, 1-hour is neutral
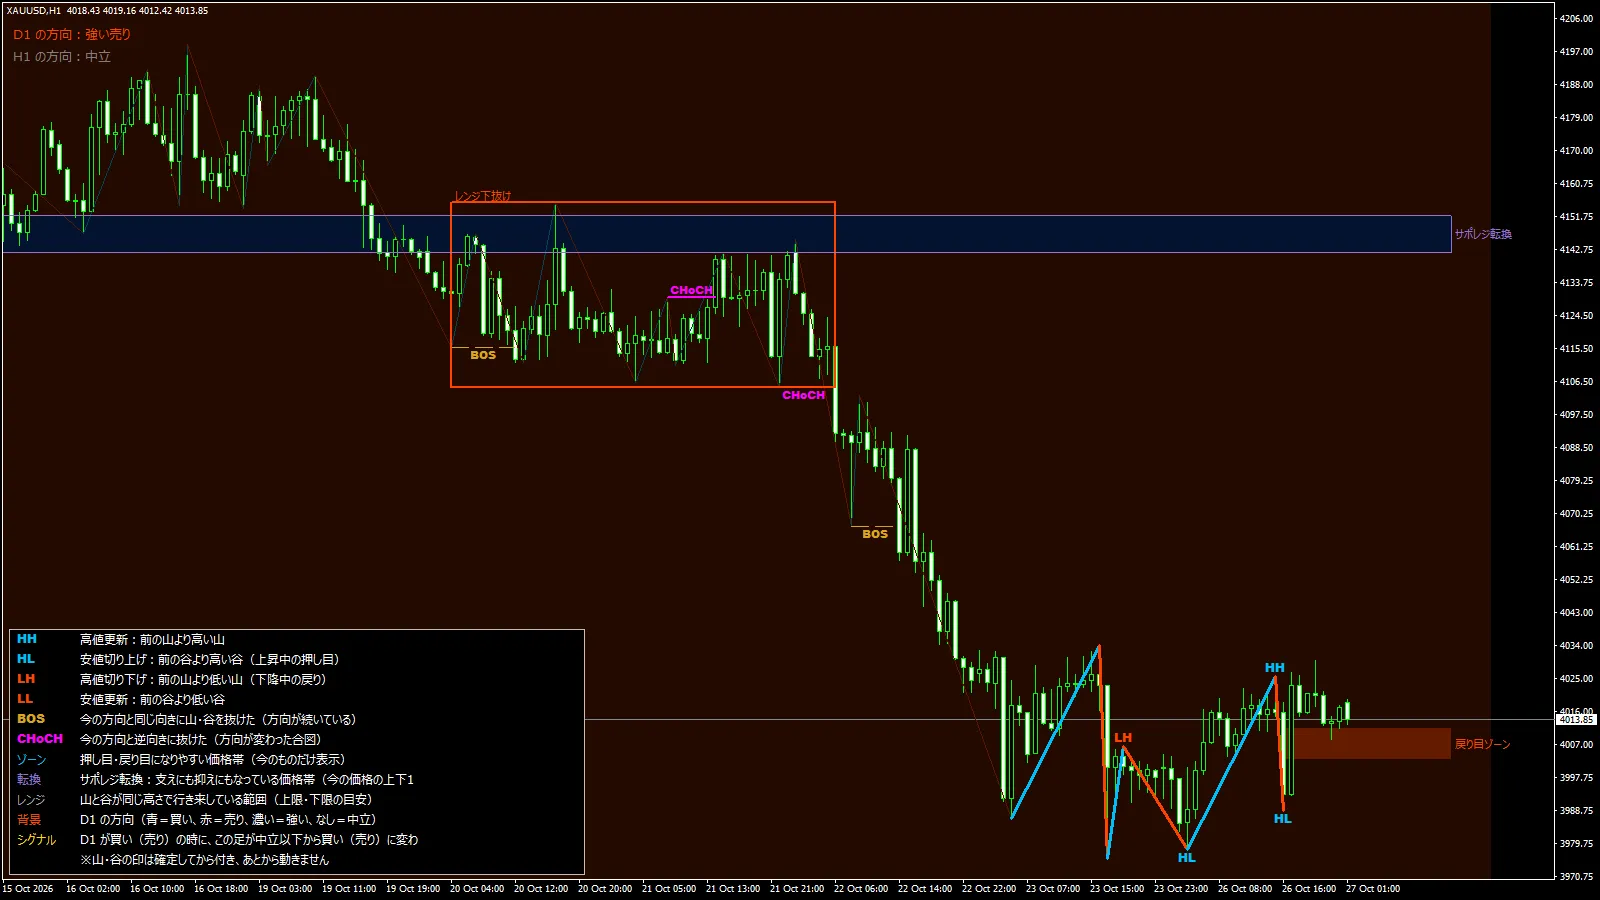
In the upper left, the direction is “D1: strong sell” and “H1: neutral.” After the 23rd low, the 26th 04:00 valley formedHL, and at the subsequent peakHH formed.
Below price, there is aretracement zone around 4003–4011. Above, you can also see a support-resistance reversal zone around 4142–4152.
5-minute chart (hourly higher timeframe): hourly is neutral, current candle is strong sell
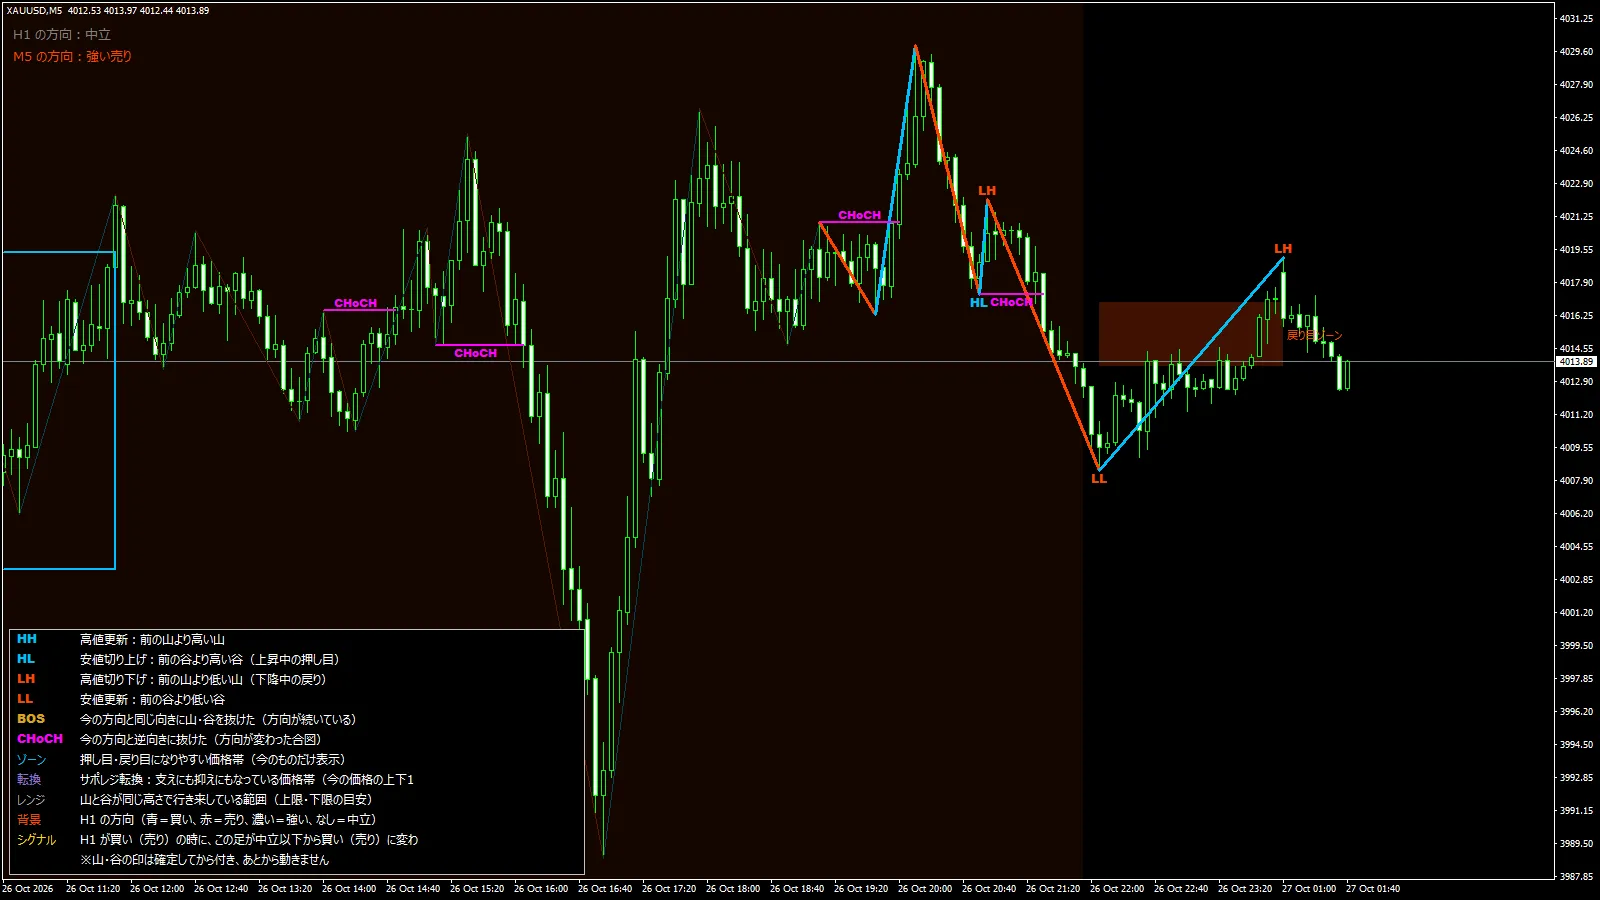
In the upper left, the direction is “H1: neutral” and “M5: strong sell.” On the night of the 26th, from the high of 4029.88 at 20:00, it fell toLL (4008.38) and then retraced, with a peak of LHLH forming.
Near price, there is aretracement zone displayed around 4013–4017. When the higher timeframe is neutral and the current candle is selling, you can observe which timeframe's move flips first.