
Everyday Nikkei 225: 2026/10/27
Analysis Tool Details Link
Note: We have steadily received high praise.
■ Newly Developed Profit Share + Indicator DAVID
https://www.gogojungle.co.jp/tools/indicators/73936?via=users_products
■ Superb Trendline Drawing Indicator “Unmatched Sword”
https://www.gogojungle.co.jp/tools/indicators/54499?via=users_products
■ Indicator Pack MT4/5 Version Monthly
“天下無双” Synchronization System
https://www.gogojungle.co.jp/tools/indicators/50319
“David” Synchronization System
https://www.gogojungle.co.jp/tools/indicators/73939?via=users_products
Trial Version · Ultimate · Synchronization SystemMonthly
https://www.gogojungle.co.jp/tools/ebooks/50353
Below: Current Analysis Article
One-line Comment: In a downtrend, can it hold its ground?
Daily Chart:MAX Oscillator: Synchronization Band“Neutral”
4-hour Chart“Strong Upward” Indication Signal
Weekly Chart “Weak Down” Signal Indication
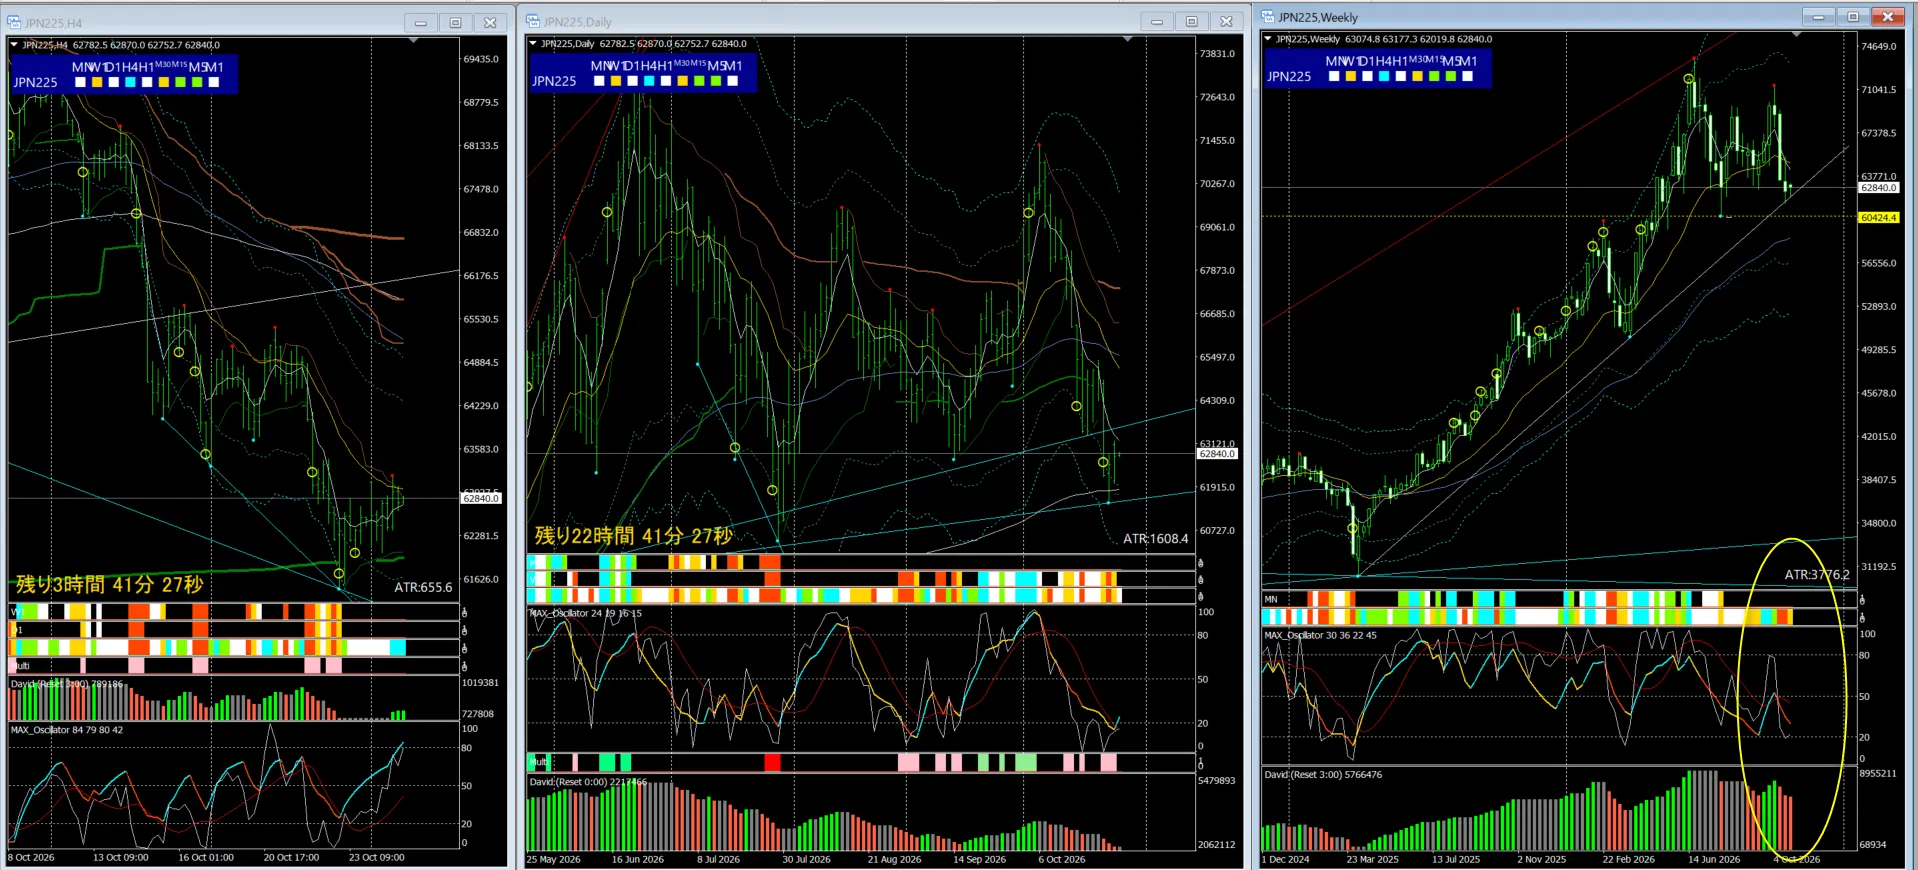
※ In a downtrend, but currently pulling back a bit
Weekly lower signal on, Daily lower signal “off”
In the near term, a slight rebound after a decline
From the MAX Oscillator on the weekly chart, it is in a downtrend, but
It may pull back slightly from the lower daily resistance and weekly trendline
Whether it can hold here is important
Price action can become very volatile depending on the time frame
If you think it's risky, best to retreat immediately, and practice risk management
Caution remains essential.
Do not ignore near-term trends; stay flexible to short-term waves
Be sure to watch out for sudden, extreme changes!
※ Notes
Volatility is quite large, so pay close attention to capital management.
Important Notes
Original indicator-based,Current analysis commentsand
do not constitute buy/sell recommendations or guaranteed future movements.