
【10/27 Morning Pound-Dollar】Rises for the second week, pulled back in the early 1.34s|Market structure as seen on LIGHTHOUSE and the latest targets
About LIGHTHOUSE
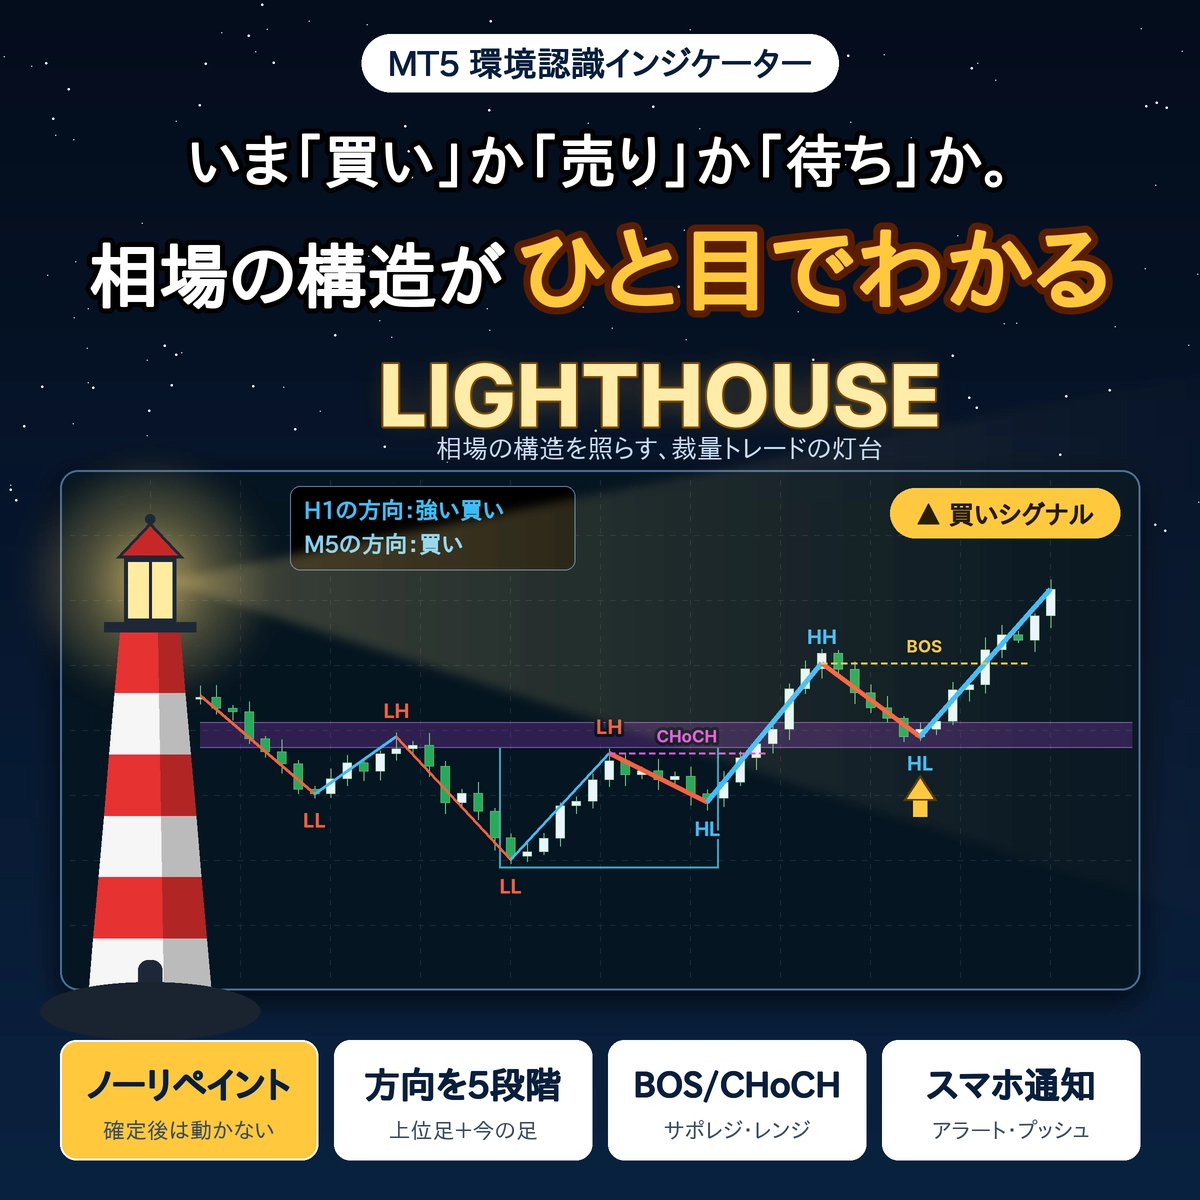
LIGHTHOUSE (Lighthouse) automatically displays the “reading” part of the chartan auxiliary indicator for discretionary trading.
・Displays the direction of the higher timeframe and the current candle in five levels at the top left of the chart
・Automatically displays the high/low updates (HH/HL/LH/LL) and the BOS/CHoCH lines
・Displays pullback and retest zones, support/resistance reversal zones, and range boxes
・The markings for peaks and valleys appear after they are confirmed and do not move or disappear later (no repaint)
・Meanings of terms are displayed at the bottom left of the chart, so you can learn while looking
Trading decisions should be made by you, and this tool helps you gather the material for decision at a glance.
[Key points] Pound/Dollar market memo up to the close on Friday, Oct 23
・From 1.31364 on Oct 14 to1.34183on the 22nd, the weekly close rose for two weeks in a row
・The close on Fri Oct 23 is1.33728(high of the day 1.34069; low 1.33602)
・Upper zone is1.3407–1.3418, lower zone is1.3360–1.3136, these are the price ranges that are likely to be watched first
1. Latest market feel (weekly/daily/1-hour)
Weekly: two consecutive closes higher
Weekly closes were 1.32265 for the week of Oct 5, 1.33246 for Oct 12, and 1.33728 for Oct 19–23, rising for two consecutive weeks. The high for this week is 1.34183, and the low is 1.32965.
Daily: retrace from 1.3136 to 1.3418
After dropping to 1.31364 on Oct 14, it rose on Oct 15–16 and reached a high of 1.34086 on the 20th. Since then, the highs on Oct 22 (1.34183) and Oct 23 (1.34069) have capped around 1.340–1.342.
1-hour: oscillating in the 1.3360–1.3418 range
From the 22nd, it rose to 1.34183 but pulled back; on the 23rd, it fluctuated between 1.34069 and 1.33602. It closed near 1.337 in the evening.
Price ranges that attract attention (based on chart facts)
| 1.3407–1.3418 | Highs on Oct 20, 22, and 23 align in this band |
| 1.33728 | Close on Oct 23 (Friday) |
| 1.3360 | Low on the 23rd (1.33602) |
| 1.3354 | Low on Oct 22 (1.33543) |
| 1.3136 | Low on Oct 14 (daily LL) |
Around key economic announcements or remarks from officials, price moves tend to be more volatile, so please check the schedule yourself as well.
2. When viewing the same chart with LIGHTHOUSE
From here, we will look at the same pound/dollar chart with LIGHTHOUSE applied.
Daily (higher timeframes: weekly): W1 shows “Sell,” D1 shows “Strong Sell”
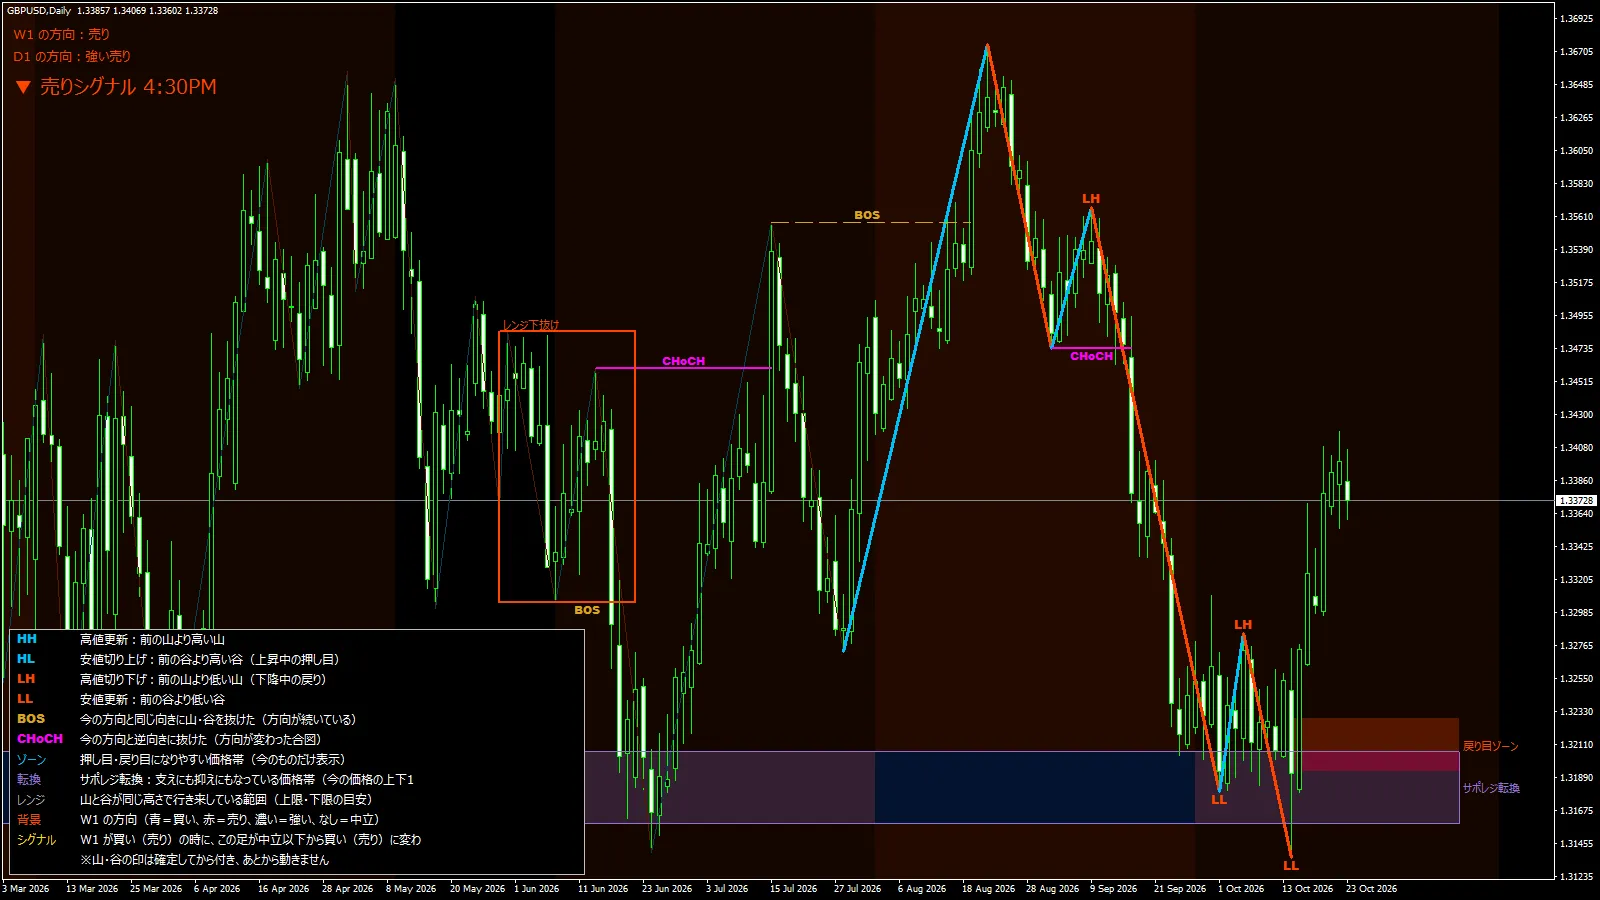
The upper left indicates “W1 direction: Sell” and “D1 direction: Strong Sell.” In August’s peaks,HH, followed by a peak,LH, and at the valleys of late September and October 14,LL appear.
The price has risen from the October 14 low and is now well above the retracement zone around 1.32. When the direction indicator and price position diverge, LIGHTHOUSE lets you verify which peaks and valleys underpin the reading with chart markings.
1-hour: in the high price area, after HH/HL comes LH/LL
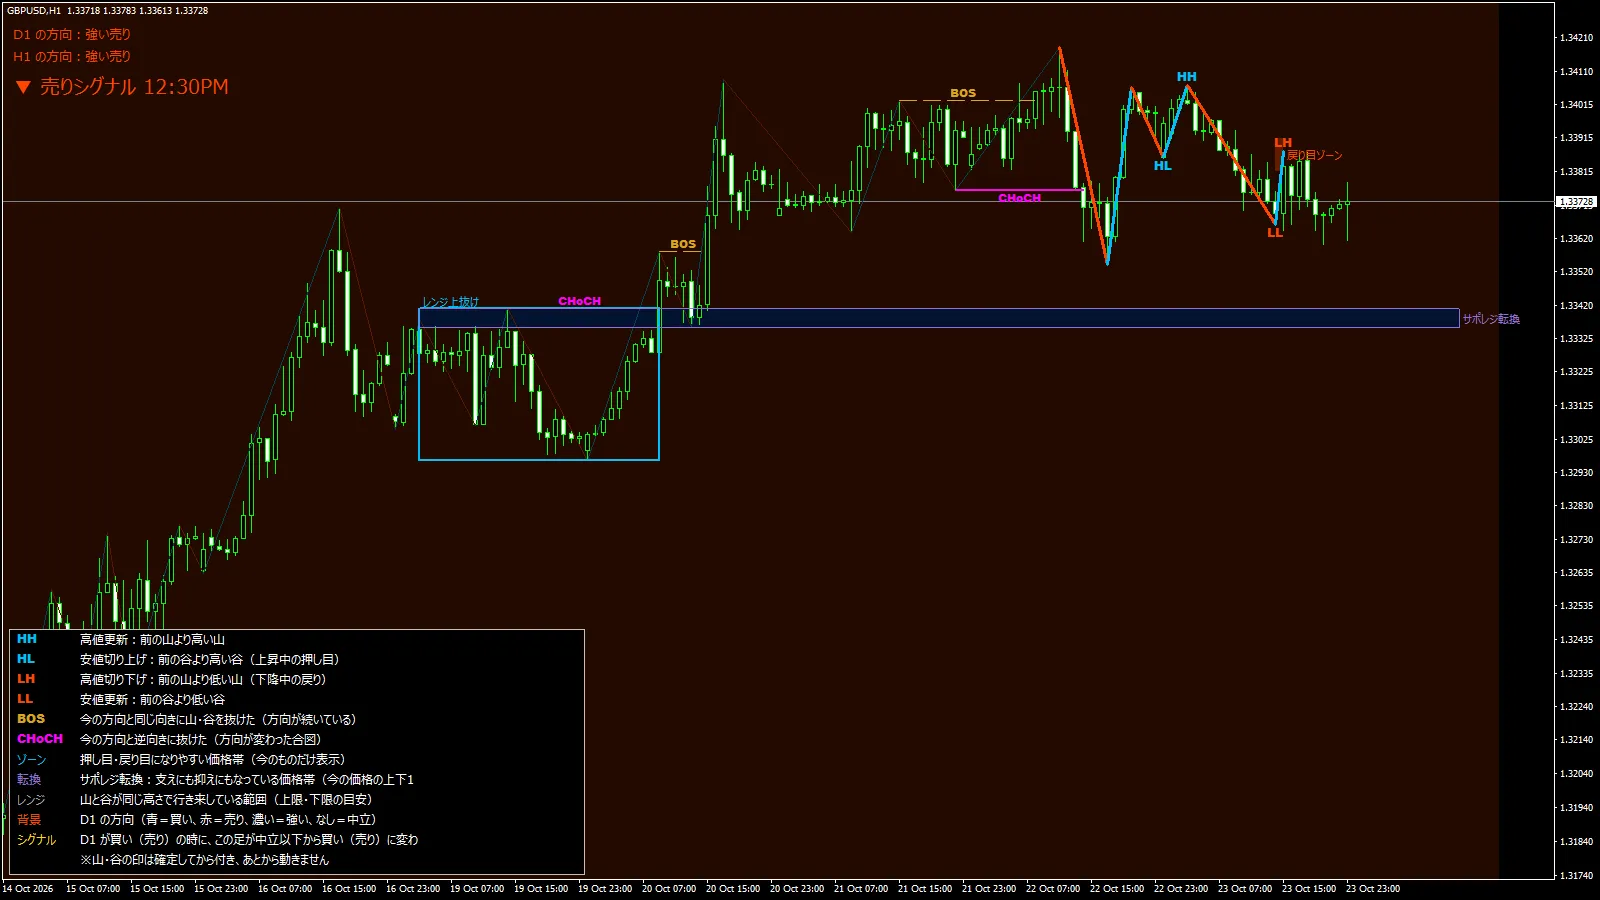
From the 22nd to the 23rd,HH andHL appeared, after which the highs trended lower andLH formed, with a valley at 1.33602 formingLL. Before that, aCHoCH appeared, leaving a tail of the rising move.
Below, there is a support/resistance reversal zone around 1.333–1.334, and above there is a retracement zone around the 1.338s. The Friday close of 1.33728 sits between these two bands.
5-minute: after a decline, a rebound in the final 5 minutes
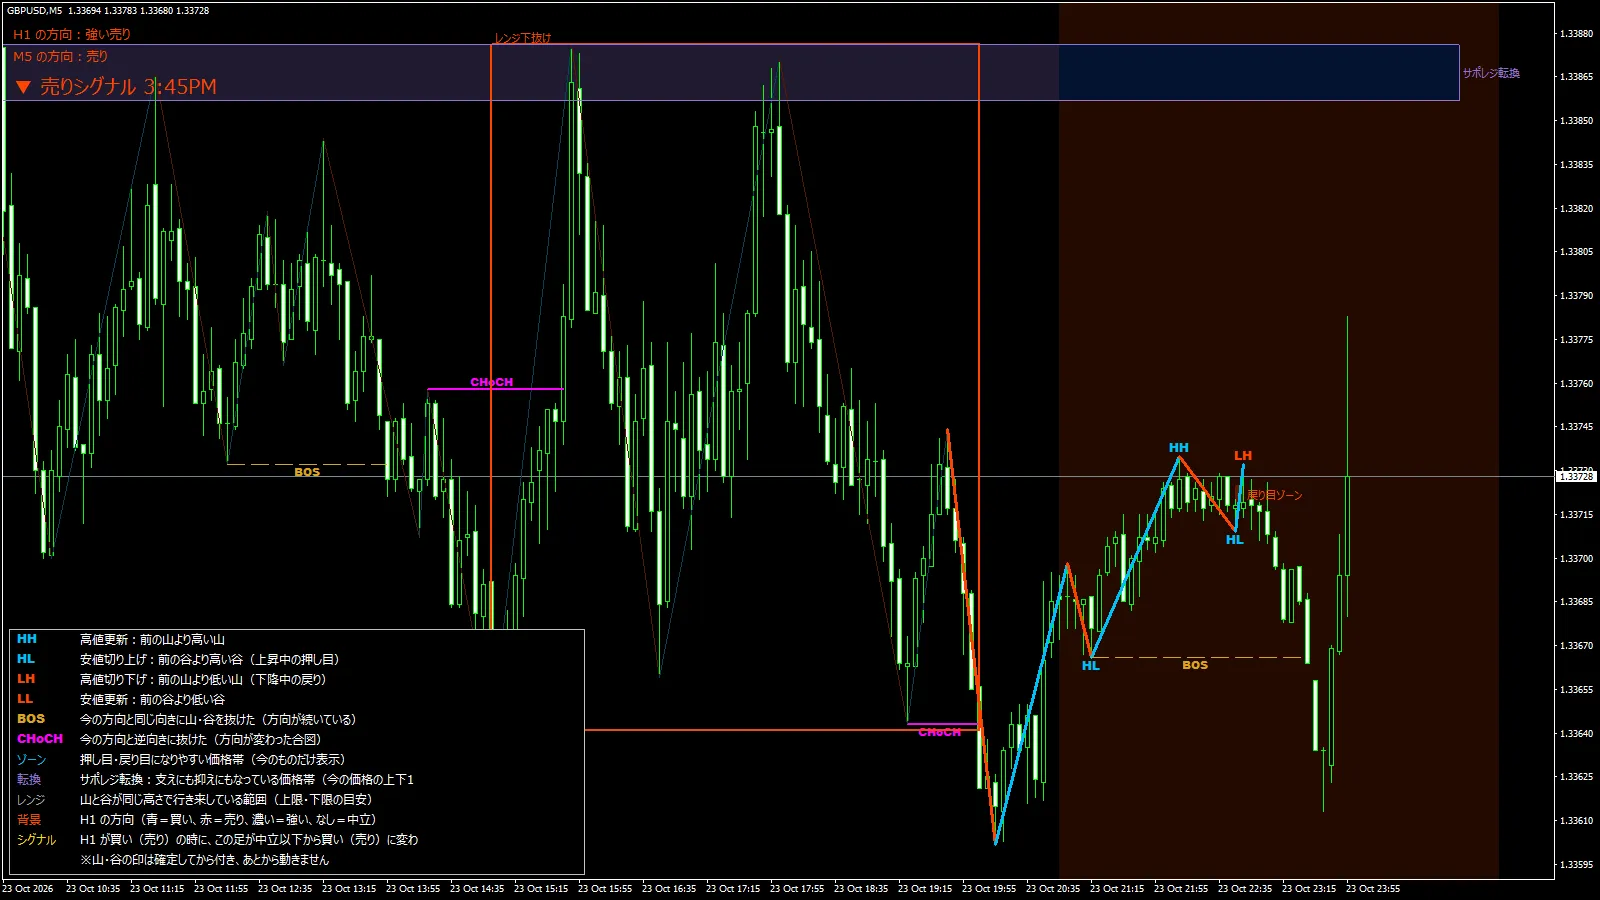
The upper left shows “H1 direction: Strong Sell” and “M5 direction: Sell.” On Friday night it fell to the 1.3360s, but in the last 20 minutes recovered to 1.33613–1.33728 and closed. You can compare whether the short-term rebound reaches the retracement zone on the 1-hour chart as you review it alongside the higher timeframe.
▼ From here, paid content (recent targets)
※Set the “paid range” in the posting screen at this position
3. Recent targets (points of interest on the chart)
Here, we list price ranges observed on the chart so far with conditions like “what to exceed” or “what to break,” not to predict movements,a checklist for chart viewing.