
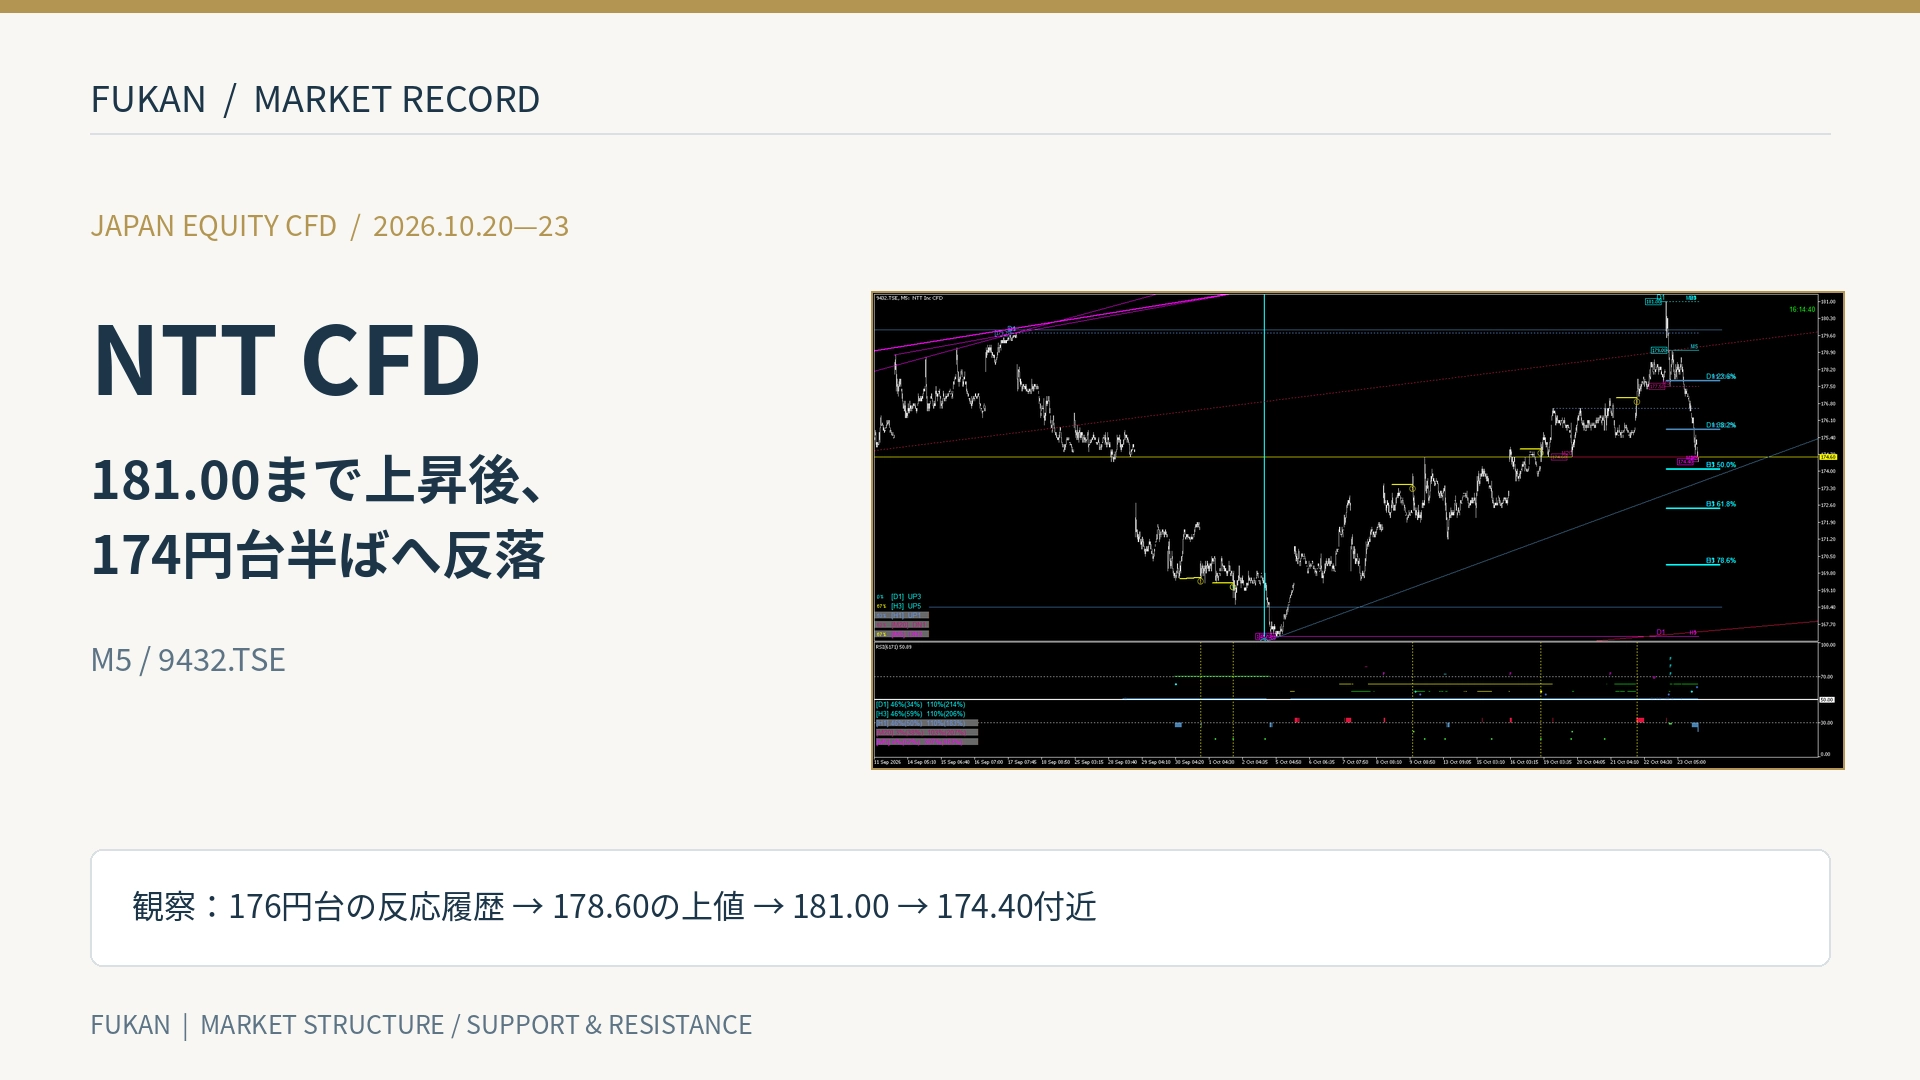
NTT CFDs rise to 181.00 and then move to the mid-174 yen range—yellow reaction history and changes in the positions of support and resistance
NTT CFD rises to around 181.00, then moves to the mid-174s — Yellow reaction history and changes in support/resistance positions
NTT’s Japanese stock CFD (9432.TSE) showed changes from October 20 to 23: approaching a horizontal band in the 176 yen range, a pullback at around 177 yen, a rise toward the 178 yen range, and a retreat from near 181.00. The four images captured from FUKAN’s M5 chart allow tracking not only price movements but also where the yellow reaction history and multi-timeframe lines are positioned relative to the price. The following values are the display values on the photographed CFD charts and may not match the actual exchange stock prices.
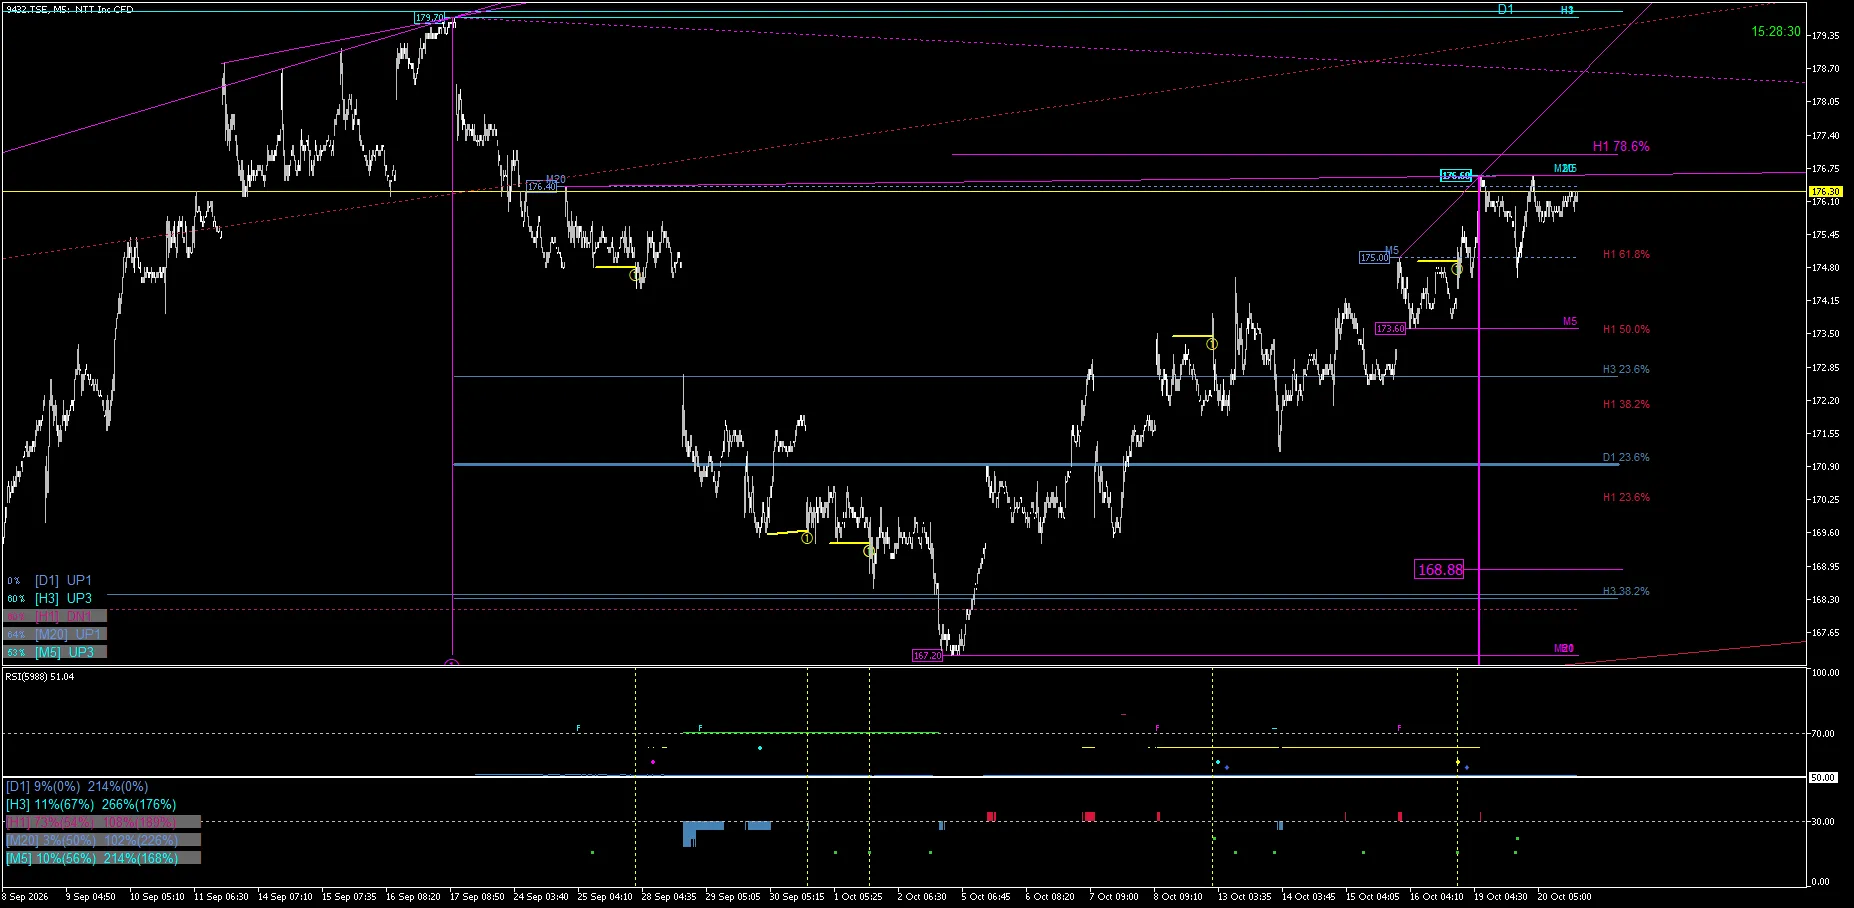
October 20 — approaching the 176 yen horizontal band
In the image around 15:28 on the 20th, the price is approaching the yellow horizontal line near 176.30. On the downside lies the M5 low line near 173.60, yellow reaction history remains in the mid-174s, and above there are overlapping multi-timeframe lines in the 177 yen range. Here the upper price band and the lower reaction level were separated.
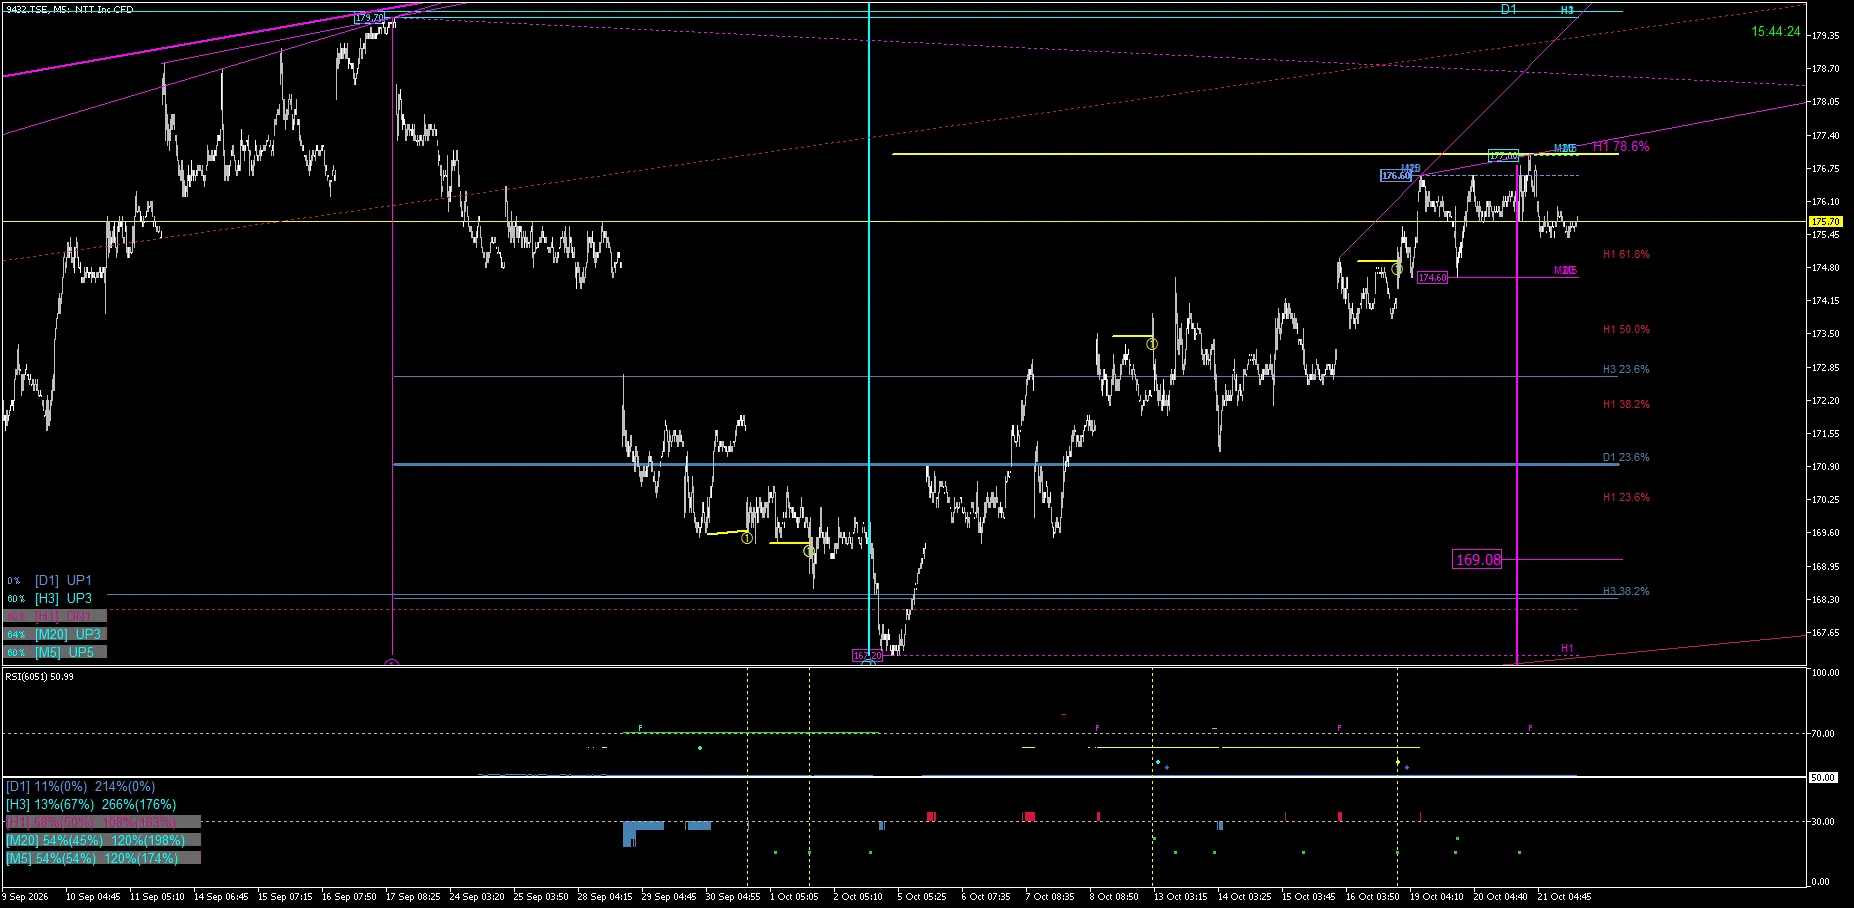
October 21 — after approaching 177, retreating to around 175.70
In the image around 15:44 on the 21st, after approaching the 177 yen zone with the M20 display and the H1 line, the price is pulled back to around 175.70. The M5 low line near 174.60 remains below the price, and the reaction from the upper price band on the 20th continues into the next day’s chart.
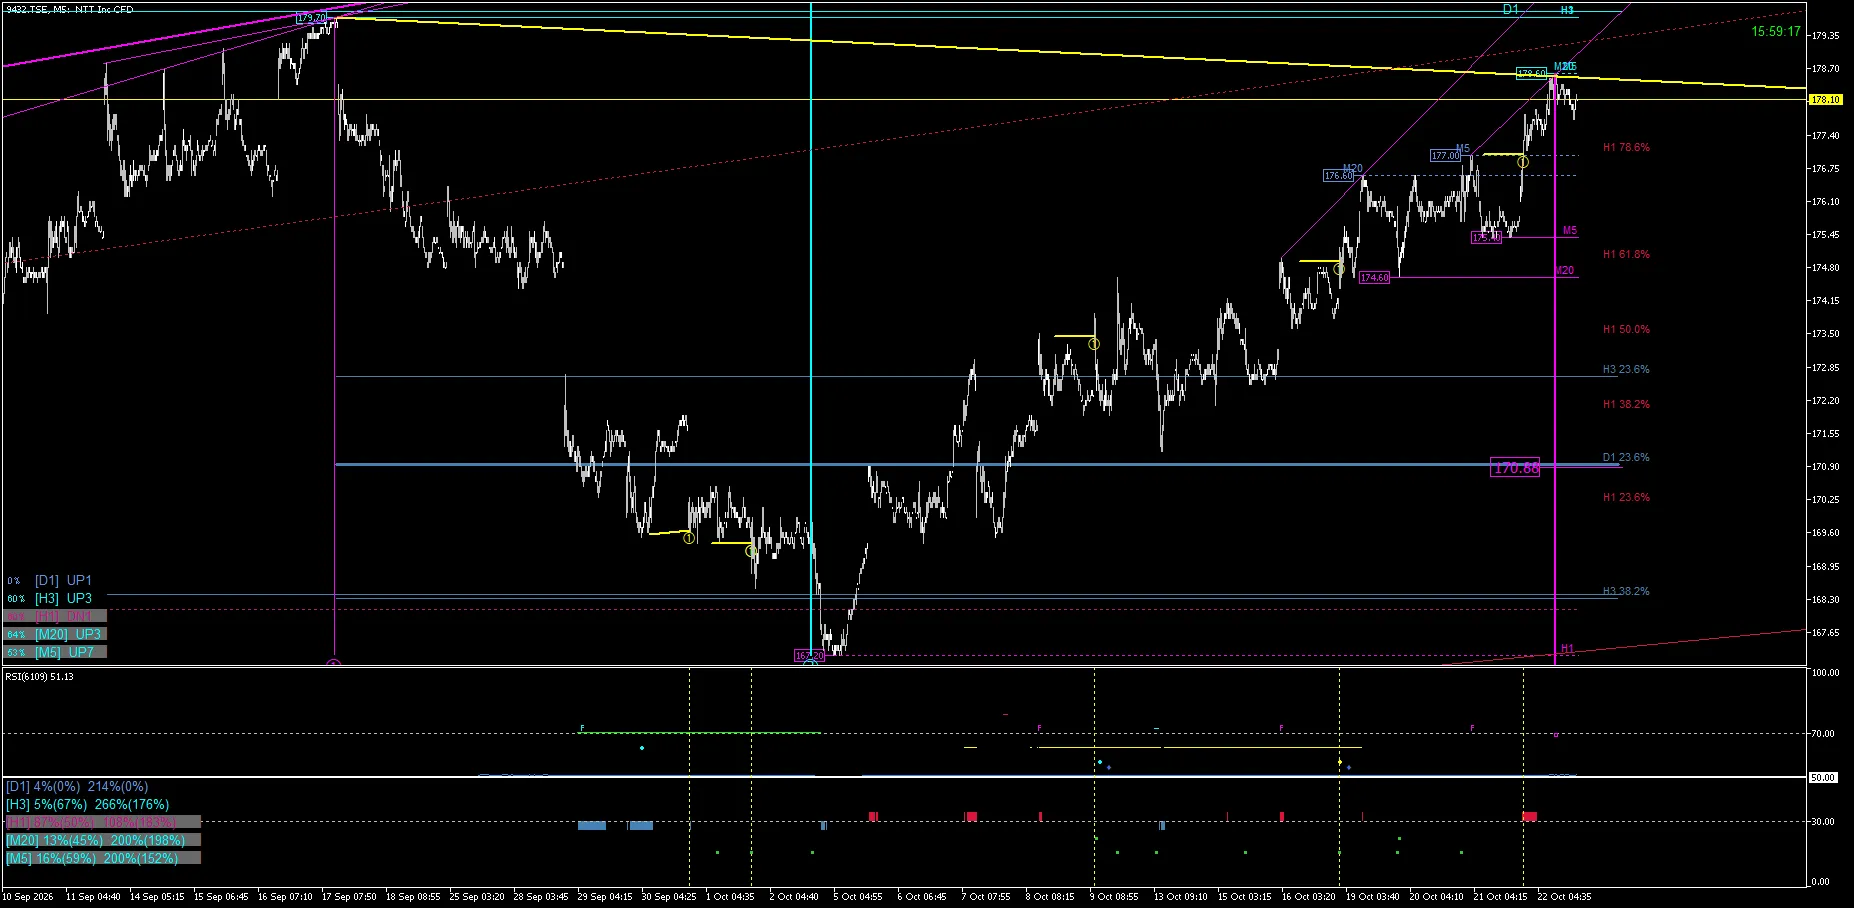
October 22 — rising toward around 178.60
In the image around 15:59 on the 22nd, an M5 high is shown near 178.60. On the upside, yellow diagonal line and purple line come into proximity, and the price turns around around that area to sit near 178.10. The price has moved from the 177 range of the previous day to a higher level, and pullback is also observed around the high price area.
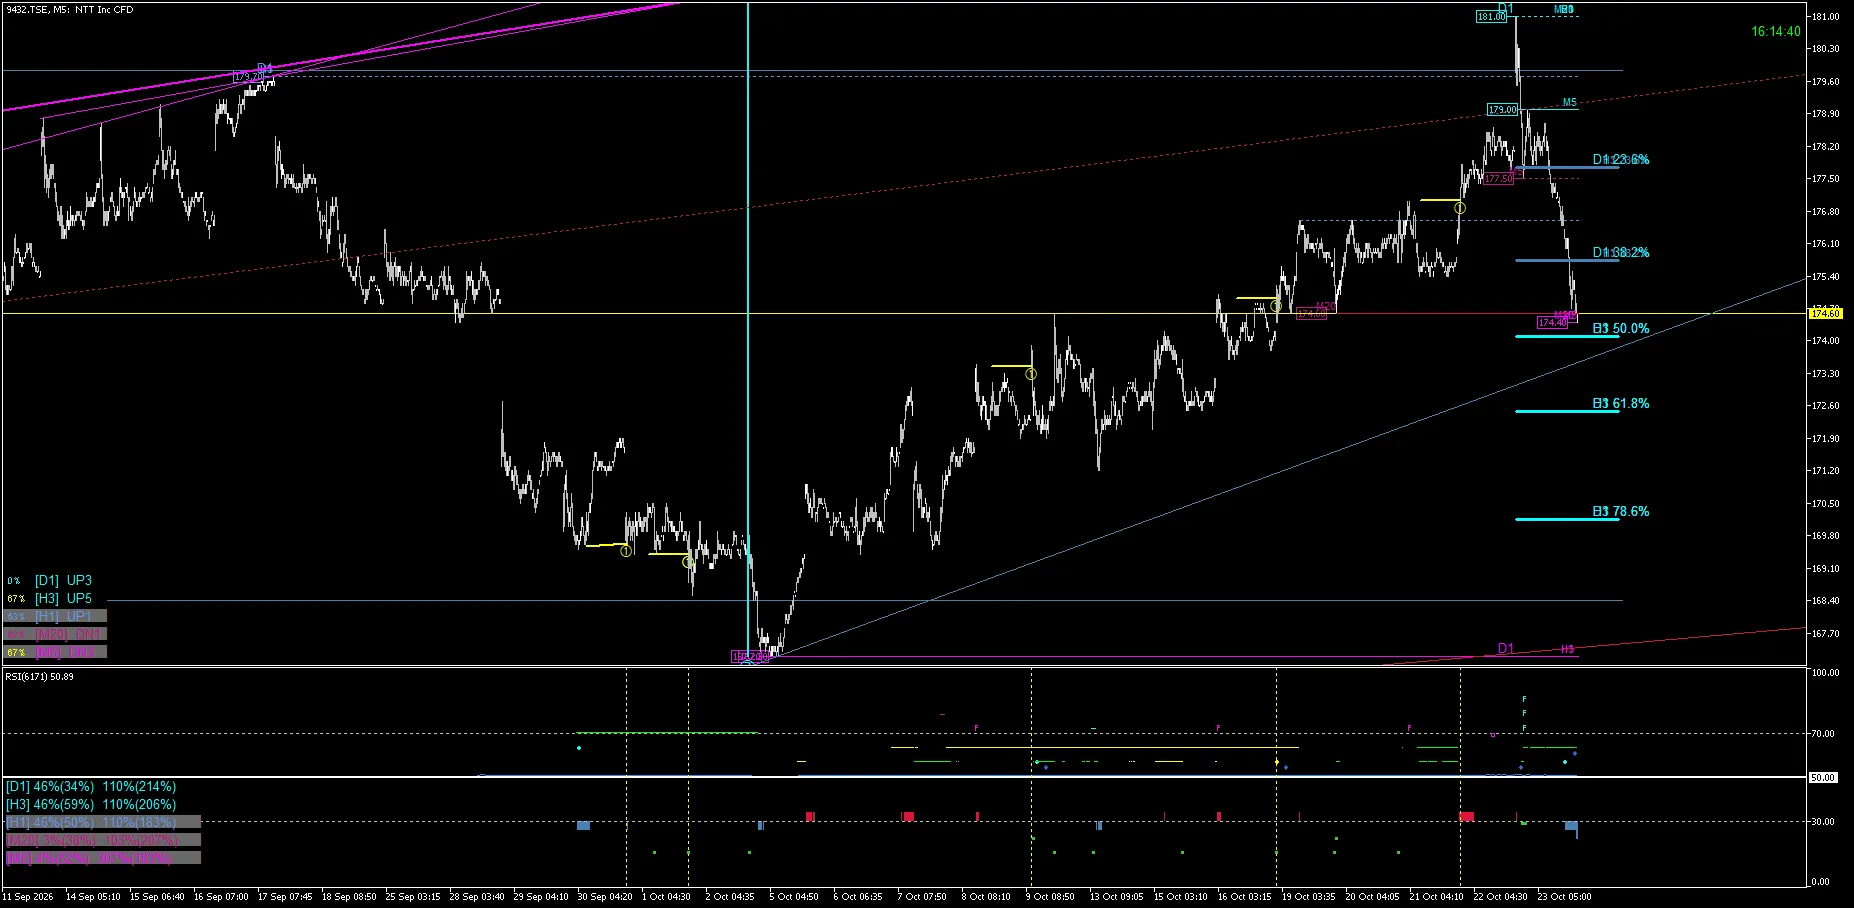
October 23 — from 181.00 to the mid-174s
In the image around 16:14 on the 23rd, an M20 high is shown near 181.00. Following the subsequent decline, the price passes through the 179s and 177s, and the M5 low display drops to around 174.40. The price at the time of capture is around 174.60, near the lower horizontal band. The yellow reaction levels in the 176s, which were near the lower price range on the 20th–22nd, are positioned above the price in the image for the 23rd.
Changes in support and resistance visible in FUKAN
When looking at four days in sequence, the price tests higher levels from the 176s to the 177s and 178s, reaches around 181.00 on the 23rd, and retreats to the mid-174s. What’s important is not only the high price figures; the horizontal bands that previously elicited price reactions can move above the current price after rises and falls, changing the relationship between support/resistance candidates and the price in a short period. In FUKAN, you can compare the yellow reaction history, M5 highs and lows, and horizontal/diagonal lines from higher timeframes on the same screen.
For the display features of FUKAN and the terms for a 7-day trial, please check the GoGoJungle product page.
This article is a market observation and analysis record and is not investment advice or a buy/sell recommendation. It does not guarantee future price movements, profits, or win rates.