

Five things to check before automatically moving the arrow sign: repaint, confirm leg, duplicate orders, indicators, consecutive losses
Set it to automatically place orders when the sign appears, and step away. When I was pressing the button manually, there were times when my own eyes stopped me before I pressed. With full automation, none of that stops.
The things that would stop my eyes were five in number. All of them can be checked in a demo account before running the tool. In this article, I will sequentially explain what to count and what results are considered a pass.
First, the conclusion
- The five things to verify are repaint, confirmed bar, double entries, indicators, and consecutive losses. If even one is missed, an order may occur that did not happen when I pressed manually.
- For all five, count them and set the criterion that “if even one is off, it fails.” If the number of confirmations is small, it can pass through, so I look at repaint 30 to 50 times.
- Consecutive losses are not a test for the absence of them. It is a test of whether it stops when they occur. Even with a 50% win rate, if you trade 100 times, the median maximum losing streak is 6 consecutive losses.
1. Repaint: is the order arrow still visible after the fact
Fully automated systems place orders on the chart when the arrow is visible. If the arrow later disappears, moves, or appears delayed, the “arrows that looked right” in past charts and the arrows actually placed may be different. The exact method is described in another article, so here I only explain how to check it.
Record the arrows that appeared when the bar was confirmed, then compare them with the same bar in the past chart. If there is even one arrow that appeared at confirmation but disappeared later, or did not appear at confirmation but appeared later, it is a fail.
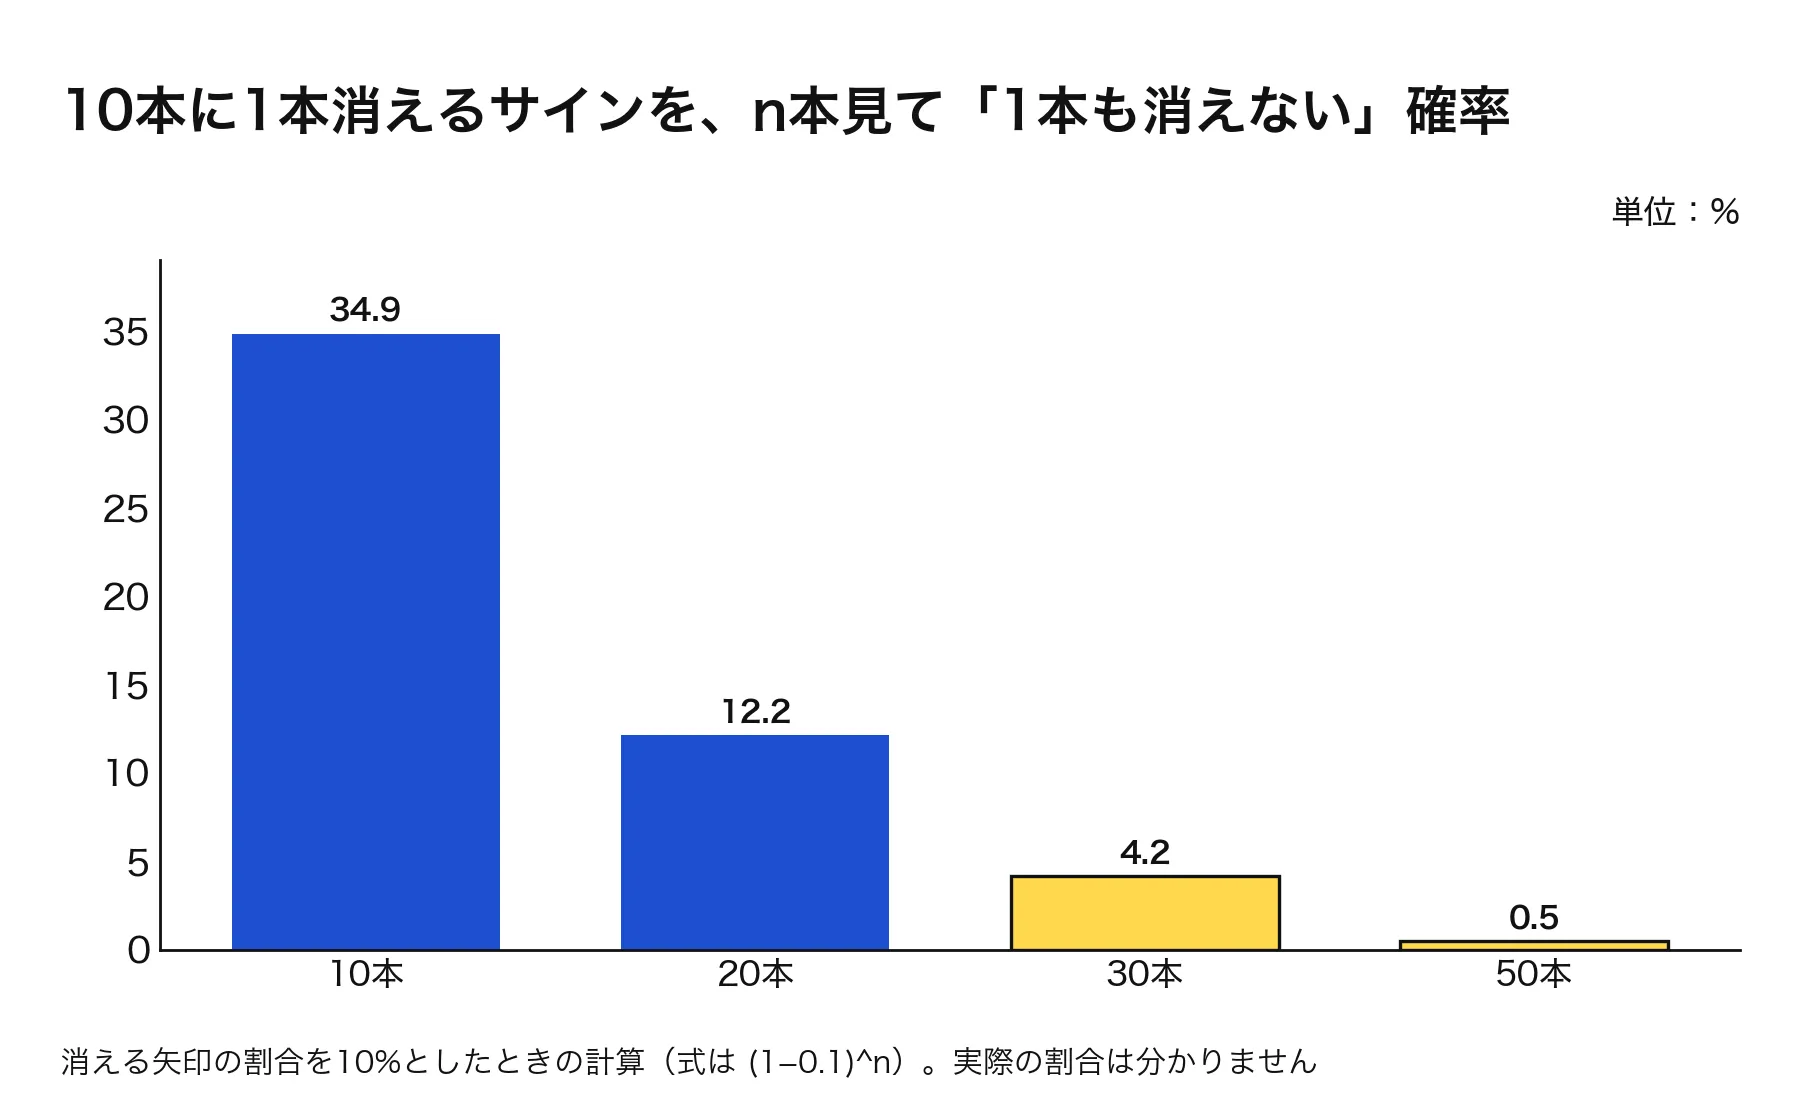
The required number can be calculated. If an arrow disappears with probability p from the total, the probability that none disappear after viewing n bars is (1−p)^n. With a sign that disappears 1 in 10 (p = 10%) and n = 20, 0.9^20 = 12.2%. Even when you look at 20 bars, you will miss a disappearing sign about 1 in 8 times.
2. Confirmed bar: which bar’s arrow are you reading and when
If you read an arrow from a bar that has not yet been confirmed, you may place an order based on an arrow that disappears before confirmation. Check whether you are reading only the bar that has been confirmed (one bar earlier).
Another pitfall found in MT5: MT5 calculates indicators for the same instrument in a single column sequentially. If there is a slow indicator on another chart of the same instrument, the signal tool may still be calculating only up to one bar earlier, returning the value of the previous bar as the current bar. If read as is, you might read the arrow for the previous bar as the current bar’s signal and place orders in the opposite direction.
On the Mac version of MT5 used for testing, placing a slow indicator on a separate chart and delaying its calculation by 5 seconds caused the delay in 6 out of 6 cases. I have not verified whether the same happens in other environments.
How to check: align the order records with the “signal bar time” and the “ordered bar time.” If you only read confirmed bars, the signal bar will be one bar before the ordered bar. If it happens for all bars and the arrow direction matches the order direction, it passes.
3. Double entries: does the same signal trigger two entries?
The arrows on confirmed bars remain on the chart until the next bar closes, and during that interval every tick is judged as “a signal is present.” If there is no memory of “this bar was ordered,” the same signal may trigger multiple orders. If you keep memory only in the tool’s variables, restarting MT will erase it, and you may place the same order again after reopening.
There are two ways to verify. For each signal, is there exactly one order? After closing MT while holding a position and reopening, does the same signal increase the number of orders? If either occurs, it’s a fail. When I tested my own fully automated tool on a demo account (GOLD—MT5 and MT4), both cases produced zero orders. Memory is retained both in MT’s common variables and in the broker’s order comments.
4. Indicators: will new orders stop around the release time?
Fully automated systems do not stop at indicator releases. It’s not enough to simply have a stop function; verify the following three points.
- From where the indicator time is obtained, and how it is corrected to Japan time. Daylight saving time changes in the US can shift the Japan-time announcement by one hour
- During the period to observe, there are zero orders, and after the period ends, it returns to ordering
- Even immediately after starting the tool, can it observe the release period
The second point has a trap. Even when there are zero orders during the observation window, it might be that there was no signal at that time. Place a control that stops because of the indicator at the same time and confirm that there were signals inside the time window as well.
I ran my own fully automated tool around real indicators (October 21–22, 2026, demo account, arrows for testing, no new signals in the 30 minutes before/after the indicator). The charts with the setting to observe the indicator had zero orders in both observation periods. The control placed 20 orders and 17 orders in the same time window.
5. Consecutive losses: when losses keep occurring, does the full automation stop?
When I pressed manually, after a string of losses I could decide to stop for the day. The full automation does not do that. A losing streak cannot be avoided, even with a high win rate. If we assume independence of outcomes and run a simulation for 20,000 trials, with a 50% win rate, the maximum losing streak after 100 trades has a median of 6 losses, and in 1 out of 10 runs, there are 8 or more consecutive losses (the method is described in another article).
Therefore, what we check is not that there will be no losing streak, but that if the day’s consecutive losses reach a certain threshold, new orders for that day stop. The amount by which it reduces before stopping depends on what percentage of the account is affected by a single loss. If each loss is 1%, the remaining balance after 10 consecutive losses is (1−0.01)^10 = 90.4%. If each loss is 5%, it is 59.9%.
Following this, I have included five quick-reference tables and the procedure to verify them on a demo account (accessible via read request).