
[10/26 Mon] Dollar-Yen Morning Fixed Observation|Today there are no★★★ indicators
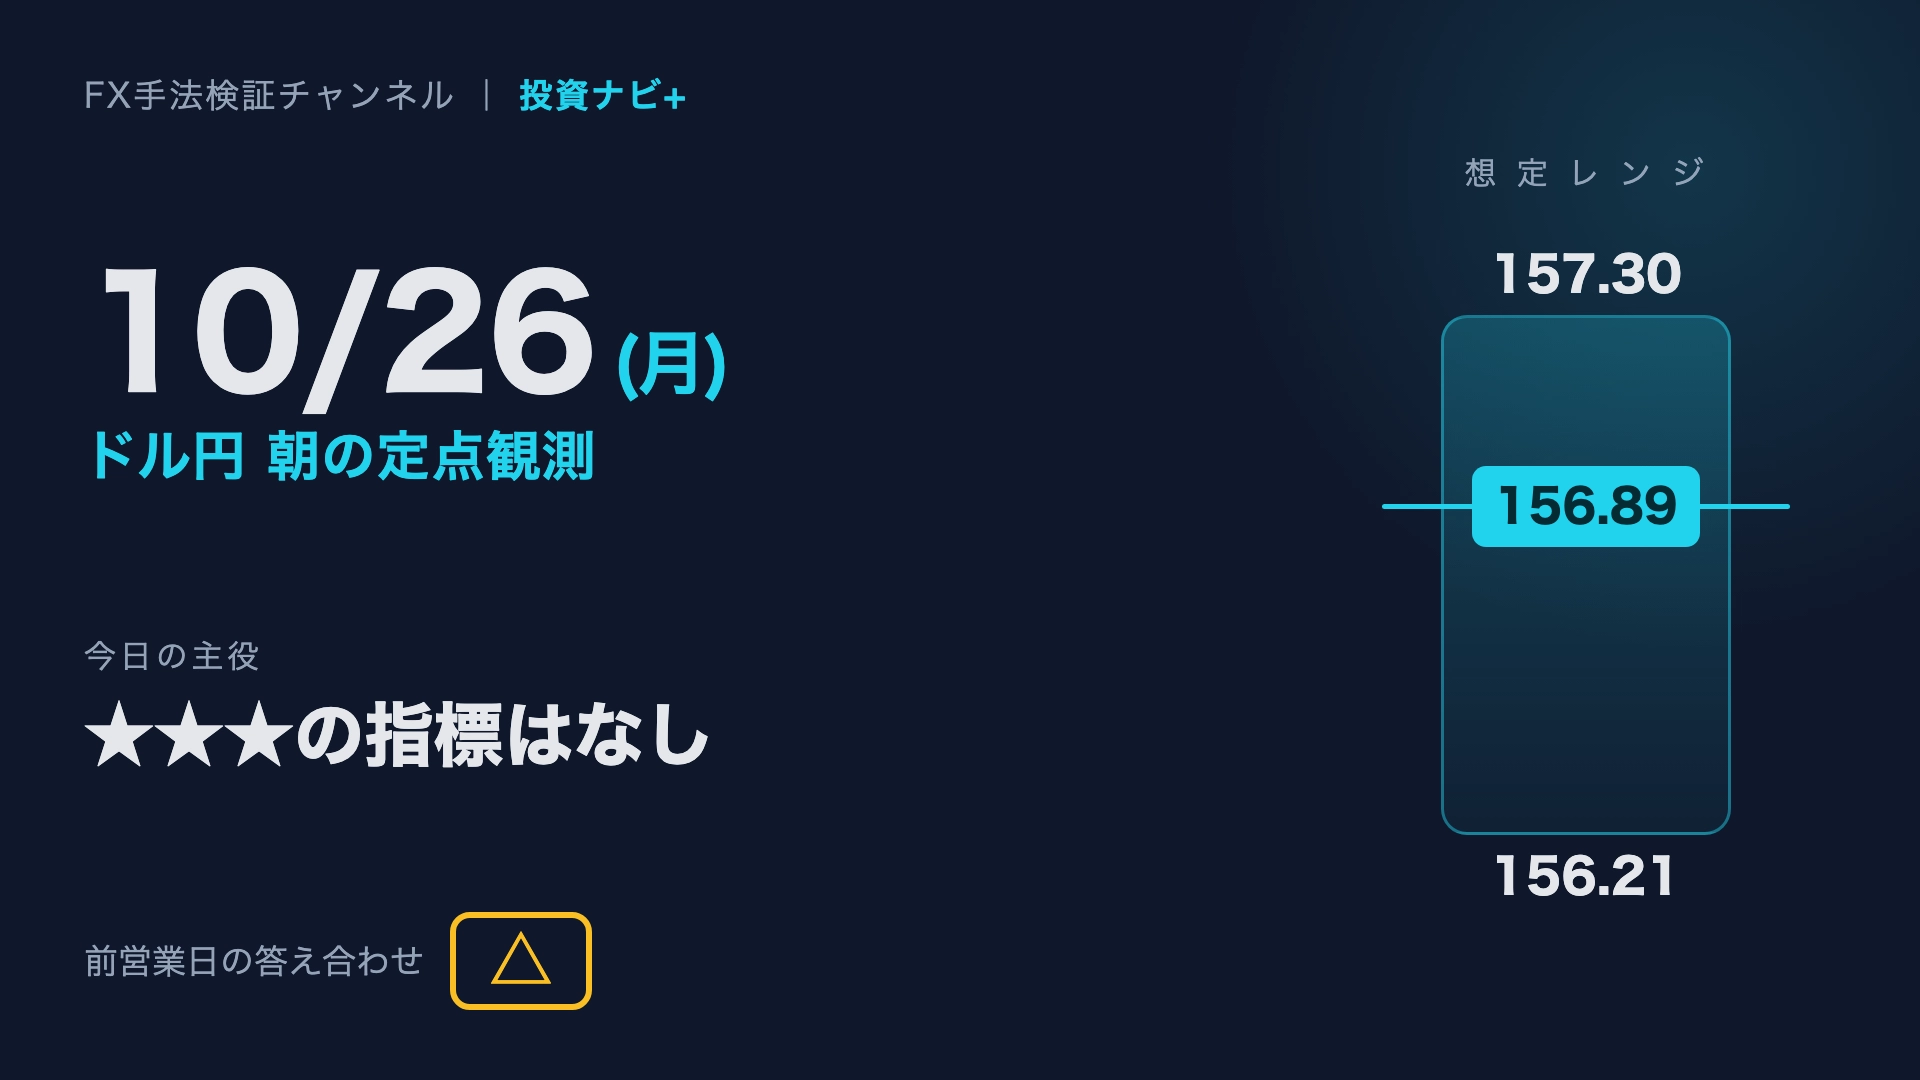
This is the morning record for Monday, October 26. Today is a valley day with no★★★ indicators. The current USD/JPY price is 156.89 yen, and the expected range is viewed as 156.21 to 157.30 yen.
The answer check from the previous business day was △. Next, the indicators, charts, and scenarios are laid out in that order.
First in 60 seconds|Today's Economic Indicators

Today's Economic Indicators (10/26 8:30 to next 8:29 JST)
| Time (JST) | Country | Indicator | Importance | Forecast | Previous |
|---|---|---|---|---|---|
| 18:00 |  | Germany: Ifo Business Climate | ★ | 90.0 | 89.9 |
| 20:00 |  | Canada: CBI Retail Sales | ★ | -47 | -55 |
Today’s Movers
There are no★★★ level indicators today; it’s a so-called valley day. Focus is on the 18:00 Germany Ifo Business Climate Index (forecast 90.0, previous 89.9) and the 20:00 CBI Retail Sales (forecast -47, previous -55). Neither is likely to cause large moves in USD/JPY. The main events are the budget proposal in the UK on 10/28 (time to be announced) and the FOMC on 10/29 (Thu). So today, I’d be more cautious about abrupt moves from officials’ remarks or headlines^^
USD/JPY Right Now
Current156.89 (previous business day close 156.83 / Day-over-day +0.06)
Expected Range156.21 (Pivot S1) ~ 157.30 (Pivot R1)
Main ViewConsolidation in 156.21–157.30. Direction awaits overseas-session moves
AlternateBreak above 157.30 to test 157.77 / Break below 156.21 to push to 155.60
Daily Chart: Environment
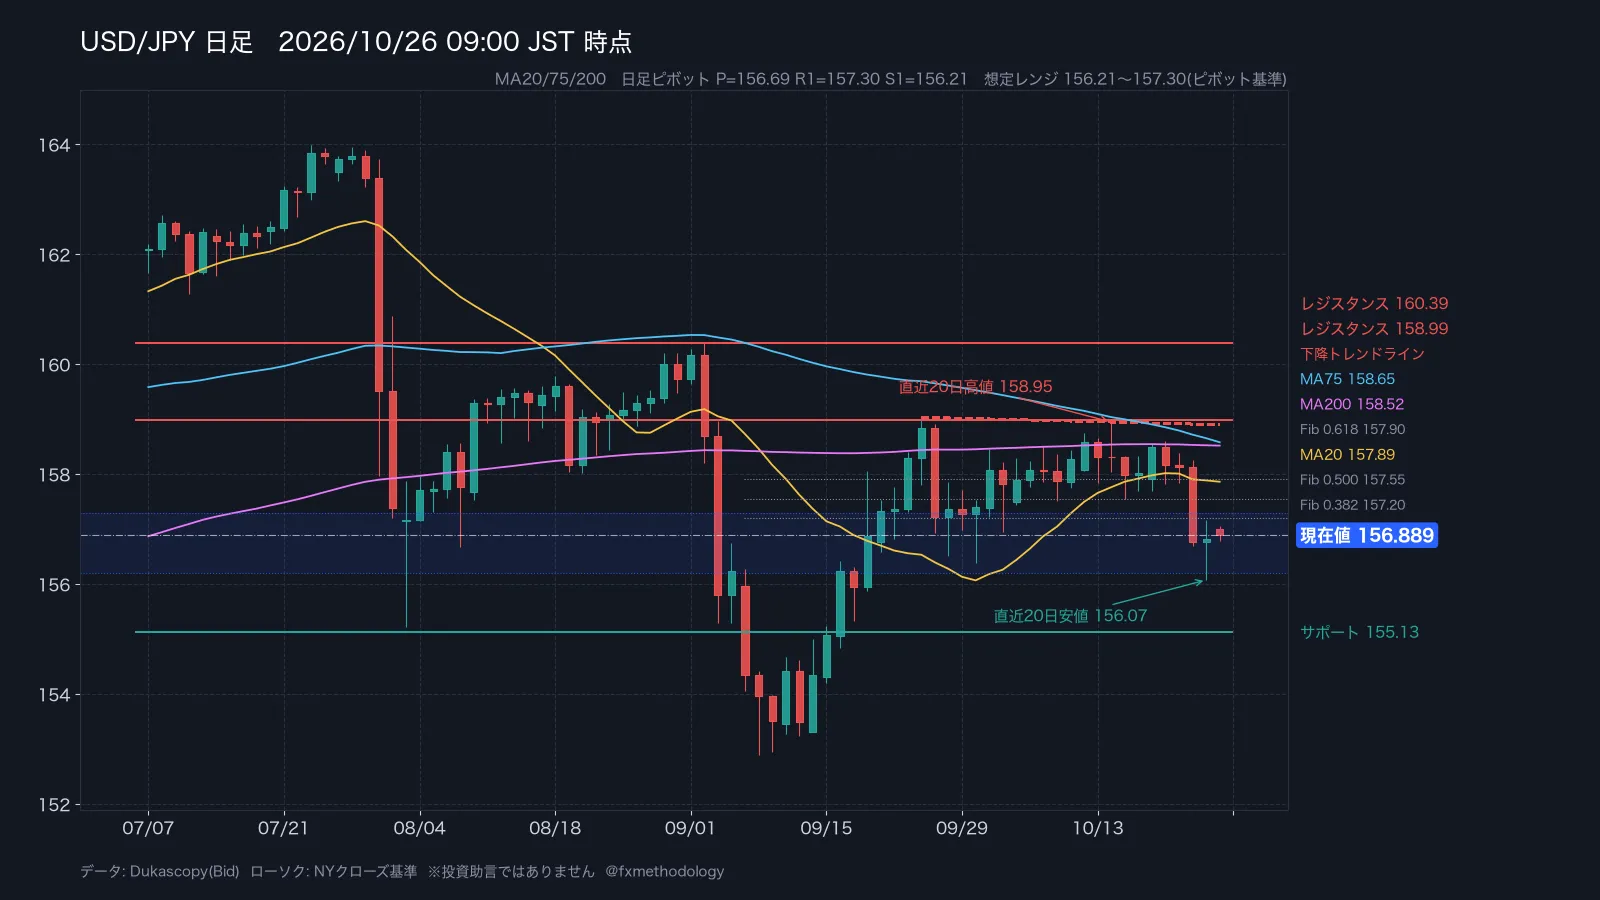
The daily chart is in a consolidation with MA lines crossing; three moving averages are crossing and there is no clear directional bias. The current price of 156.89 is below MA20 at 157.89. On the upside, resistance is noted at 158.99 and 160.39. On the downside, 155.13 is a candidate support. Looking at a rebound from 159.03→156.07, the 0.382 level is around 157.20 and the 0.5 level around 157.55.
4-Hour Timeframe: Key Lines
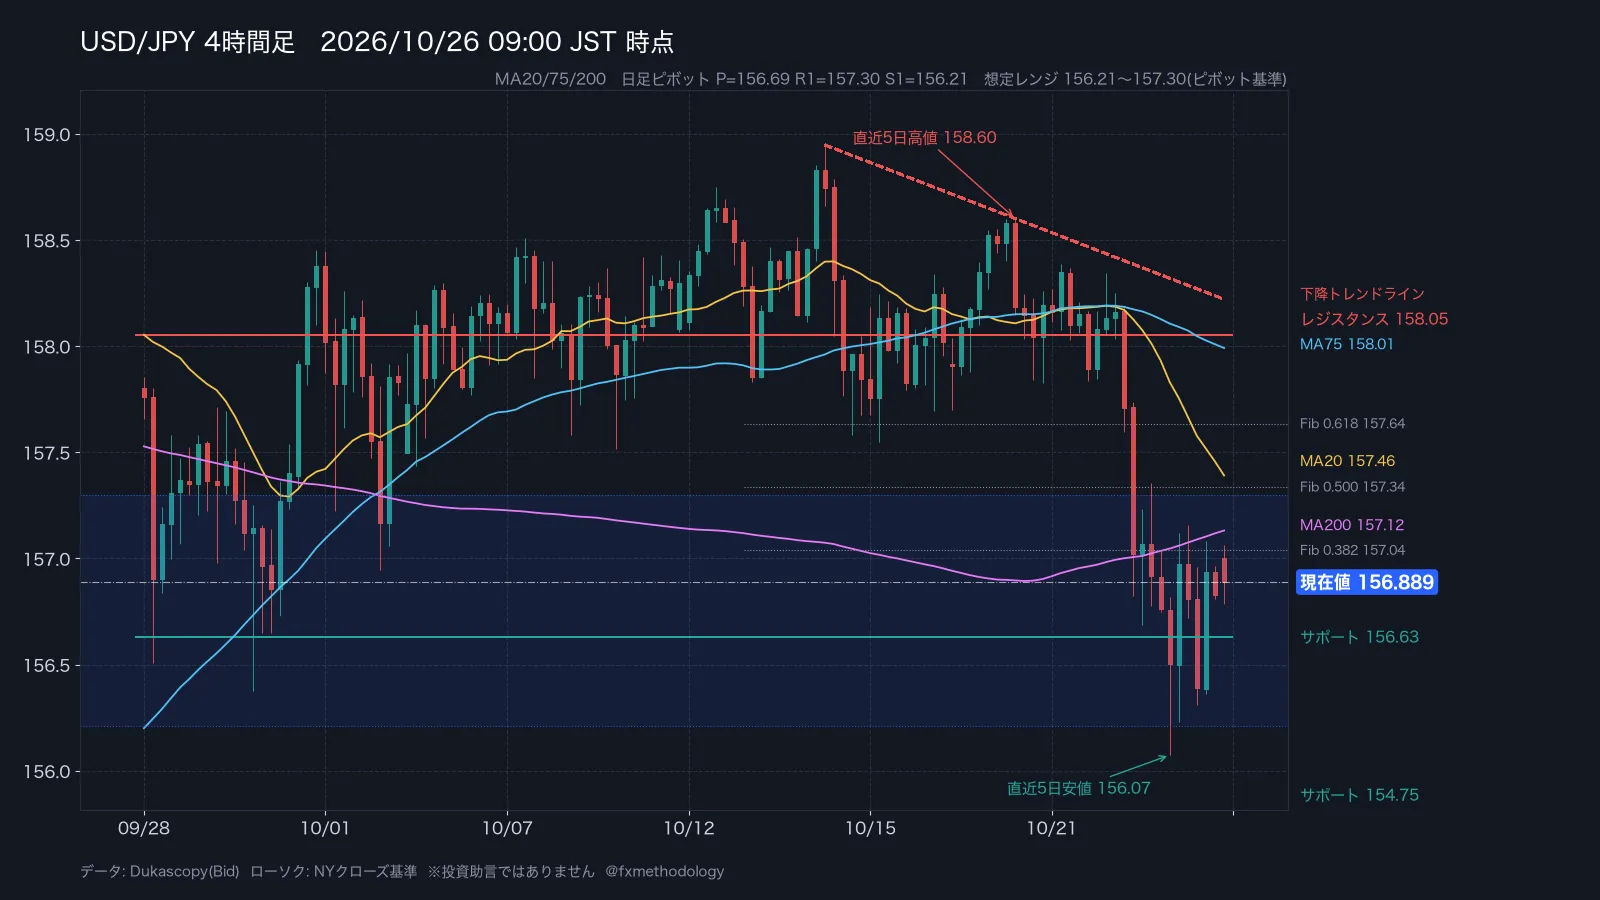
The four-hour timeframe also shows three MAs crossing without a clear pattern. On the upside, 158.05; on the downside, 156.63 and 154.75 are mechanically extracted. The downward trendline starting from 10/14 22:00, not from 9/24, sits near 158.24, leaving room for upside movement. The nearest inflection point appears near 156.63.
Connecting Indicators and Charts
Today there are no indicators registered on the fact sheet. On such days, market moves tend to hinge on waiting for catalysts, with reactions often limited to the range edges. Pivot P is at 156.69, and the current price sits slightly above it. Upward targets are 157.30 (Pivot R1) and downward targets 156.21 (Pivot S1); a clear breakout beyond either may be needed to warrant a directional bias.
In the Video|Morning Fixed Observation for USD/JPY

Answer Check from Previous Business Day
On Friday, the forecast favored a range of 156.22–157.78. In reality, the high was 157.16 and the low was 156.07, briefly breaking the lower bound, but the close at 156.83 remained inside the range. The verdict was △. The lower wick extended, but a full breakout did not occur^^;
On Friday, the nationwide core CPI (YoY) at 08:30 was expected 2.1% but came in at 2.2%. After the release, 15 minutes moved 12.6 pips and 60 minutes moved 52.5 pips, with the direction being down in both cases. The daily chart opened at 156.76 and closed at 156.83, with high of 157.16 and low of 156.07, a 109-pip range that ended slightly higher.
Verification Data
In Tokyo hours on Monday (9–15) the average USD/JPY range over 156 occurrences is 62 pips, and the daily average range is 118 pips. Since Tokyo often moves only about half the day, chasing aggressively from the morning is less likely to pay off^^;
Since Friday, the low of the 20th was breached, giving this figure: the bullish rate after breaching the 20th’s low (over the past 10 years, 232 occurrences) is 57%, with an average move of +5 pips. The bias is minor, making it unlikely to rely on direction alone.
Today’s Question
Which is likely to be tested first, 157.30 or 156.21?
If you’d like, please share your thoughts with a like or comment.
The four RCIs referenced in this article can be produced by the free indicator distribution.Free 4-Indicator-RCI (MT4/MT5 inclusive)
Items published by FX Method Institute on GogoJungle


※ The verification uses USD/JPY hourly data from January 2016 to March 2026. It does not guarantee future performance.
Indicator data: edited from Forex Factory / Tradays; Price: Dukascopy (Bid) at 2026-10-26 09:00
※ This is my personal opinion. Please make investment decisions on your own.