
【10/26 Night USD/JPY】From the 158 Yen range to the 156 Yen range to end the week|Market structure and near-term targets seen on LIGHTHOUSE
About LIGHTHOUSE
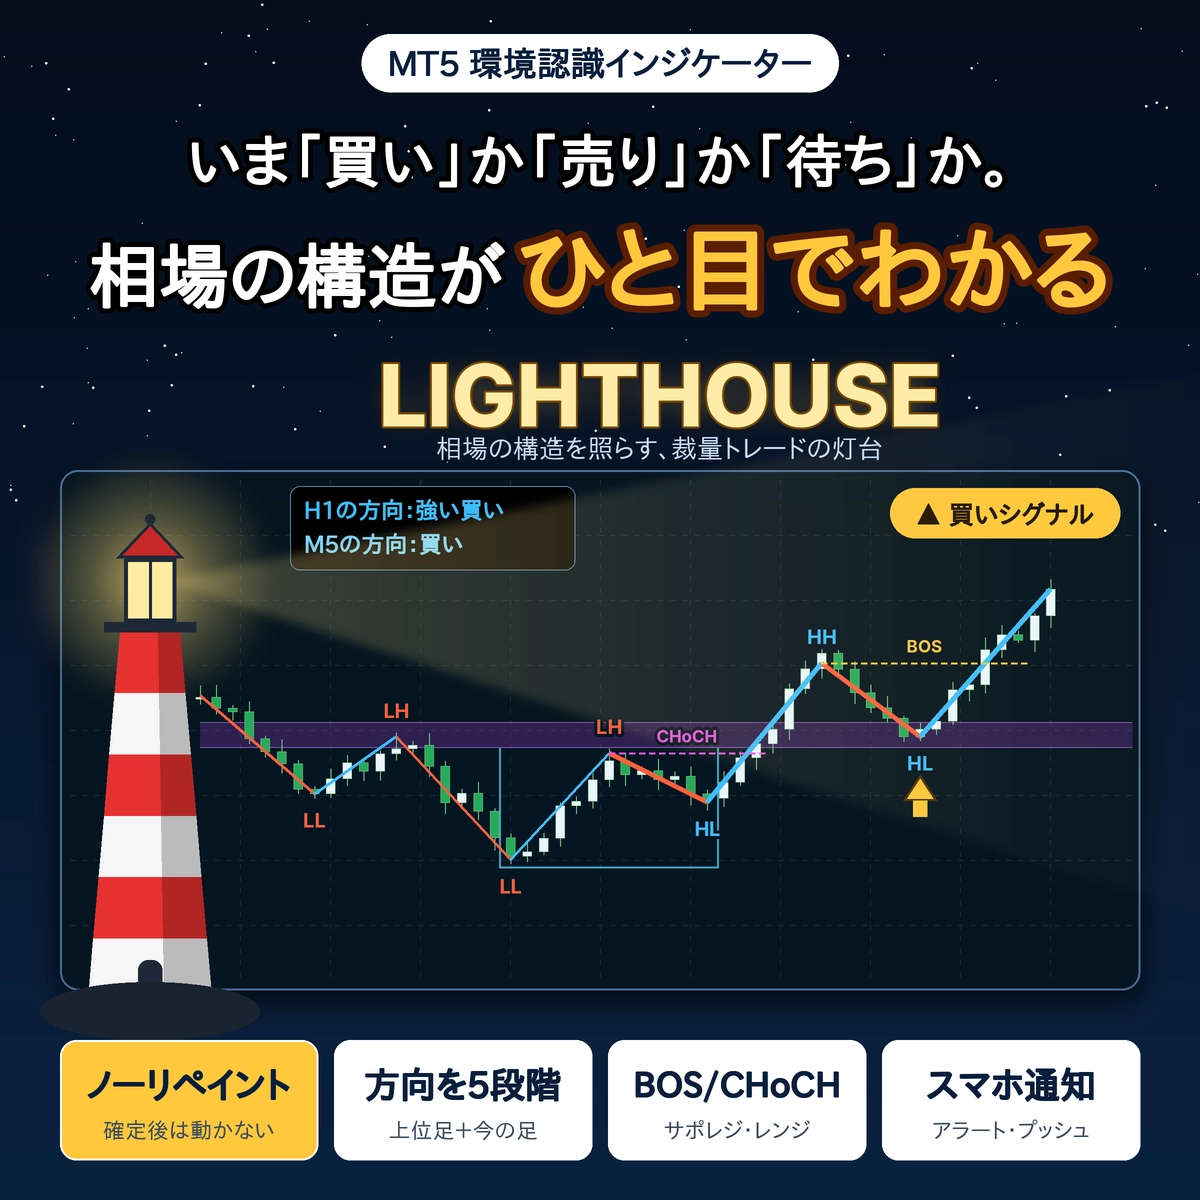
LIGHTHOUSE (Lighthouse) is the indicator that automatically displays the “reading” portion of the chartA discretionary trading support indicator.
・Displays the direction of the higher timeframe and the current candle in five levels at the top-left of the chart
・Automatically displays highs/lows updates (HH/HL/LH/LL) and the BOS/CHoCH lines
・Displays pullback/retracement zones, support-resistance reversal zones, and the range box
・Markers for peaks and troughs appear after confirmation and do not move or disappear afterward (no repaint)
・Meanings of terms are shown at the bottom left of the chart, so you can learn by looking
Trading decisions are made by you, and this tool helps you gather decision-making materials at a glance.
【Key Points】 Currency pair USD/JPY market memo up to the close on Friday, October 23
・Week high of October 20158.596to, on Friday, October 23,156.072it fell to
・The close on Friday, October 23, was156.835(High that day 157.153, Low 156.072)
・On the upside,157.153・157.350, on the downside,156.305・156.072are the price ranges that are most likely to be watched first
1. Recent market feel (weekly, daily, 1-hour)
Weekly: two consecutive weeks of closing lower
The weekly close was 158.268 for the week of October 5, 157.992 for the week of October 12, and 156.835 for the week of October 19–23, marking two straight declines. This week’s high was 158.596 on the 20th, and it dropped to 156.072 in the latter half of the week.
Daily: more than 1 yen drop on the 22nd
From October 19–21, closes were in the 158.1–158.5 range, but on the 22nd it fell from 158.126 to 156.757, about 1.4 yen lower. On the 23rd, after making a low of 156.072, it recovered to 156.835 to close.
1-hour: retracement high keeps stepping lower
After the retracement high of 157.350 on the 22nd, the retracement high on the 23rd was slightly lower at 157.153. On the 23rd, it dropped to 156.072 around 3 o’clock, then fluctuated in the 156.3–157.1 range, settling in the 156.8s at night.
Price ranges likely to be watched (based on chart facts)
| 158.596 | High on Oct 20 (this week’s high) |
| 157.350 | Retracement high on the 22nd |
| 157.153 | High on the 23rd |
| 156.835 | Close on Oct 23 (Friday) |
| 156.305 | Low around 3 PM on the 23rd |
| 156.072 | Low on the 23rd (around 3 o’clock) |
In the period around economic releases and remarks by key figures, price movement tends to become more volatile, so please check the schedule on your own.
2. When you view the same chart with LIGHTHOUSE
From here, we will view the same USD/JPY chart with LIGHTHOUSE applied.
Daily (higher timeframe is weekly): both weekly and daily indicate a “sell”
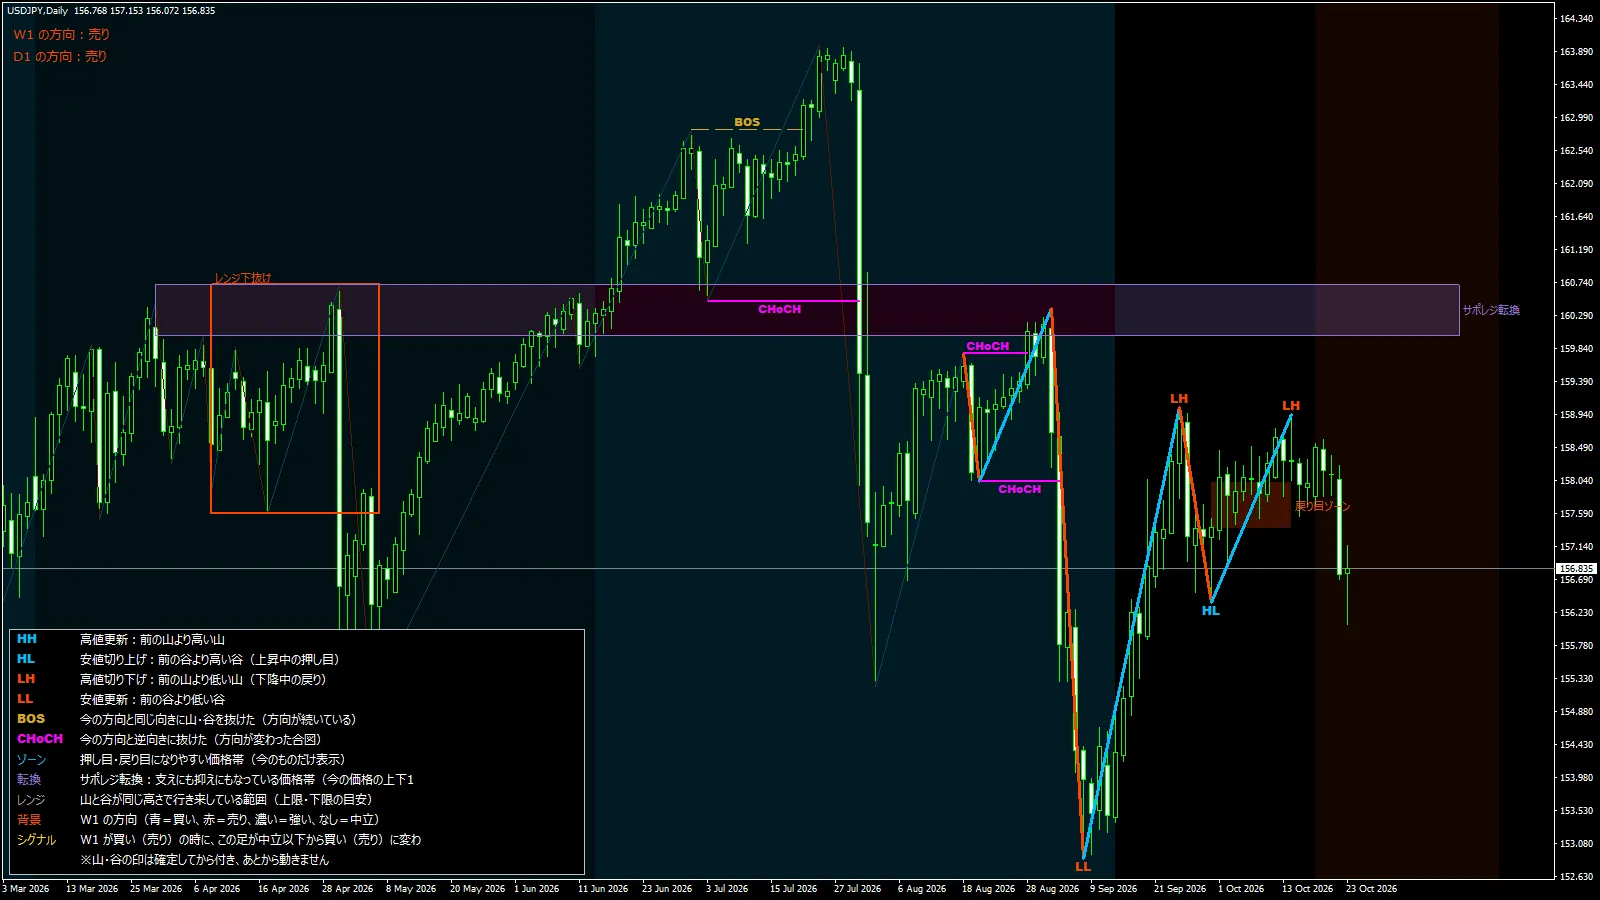
Top-left shows “W1 direction: sell” and “D1 direction: sell.” It dropped to 152.883 in early SeptemberLL, then rose to the peak on October 14 (158.942) andLH appeared. Since the peak is lower than the previous peak, the directional indication is sell.
Above price, around 157–158 yen,retracement zoneis displayed. On the daily chart, it also appears below the zone due to the drop on the 22nd.
1-hour chart (higher timeframe is daily): two LH in a row, and LL is also updated
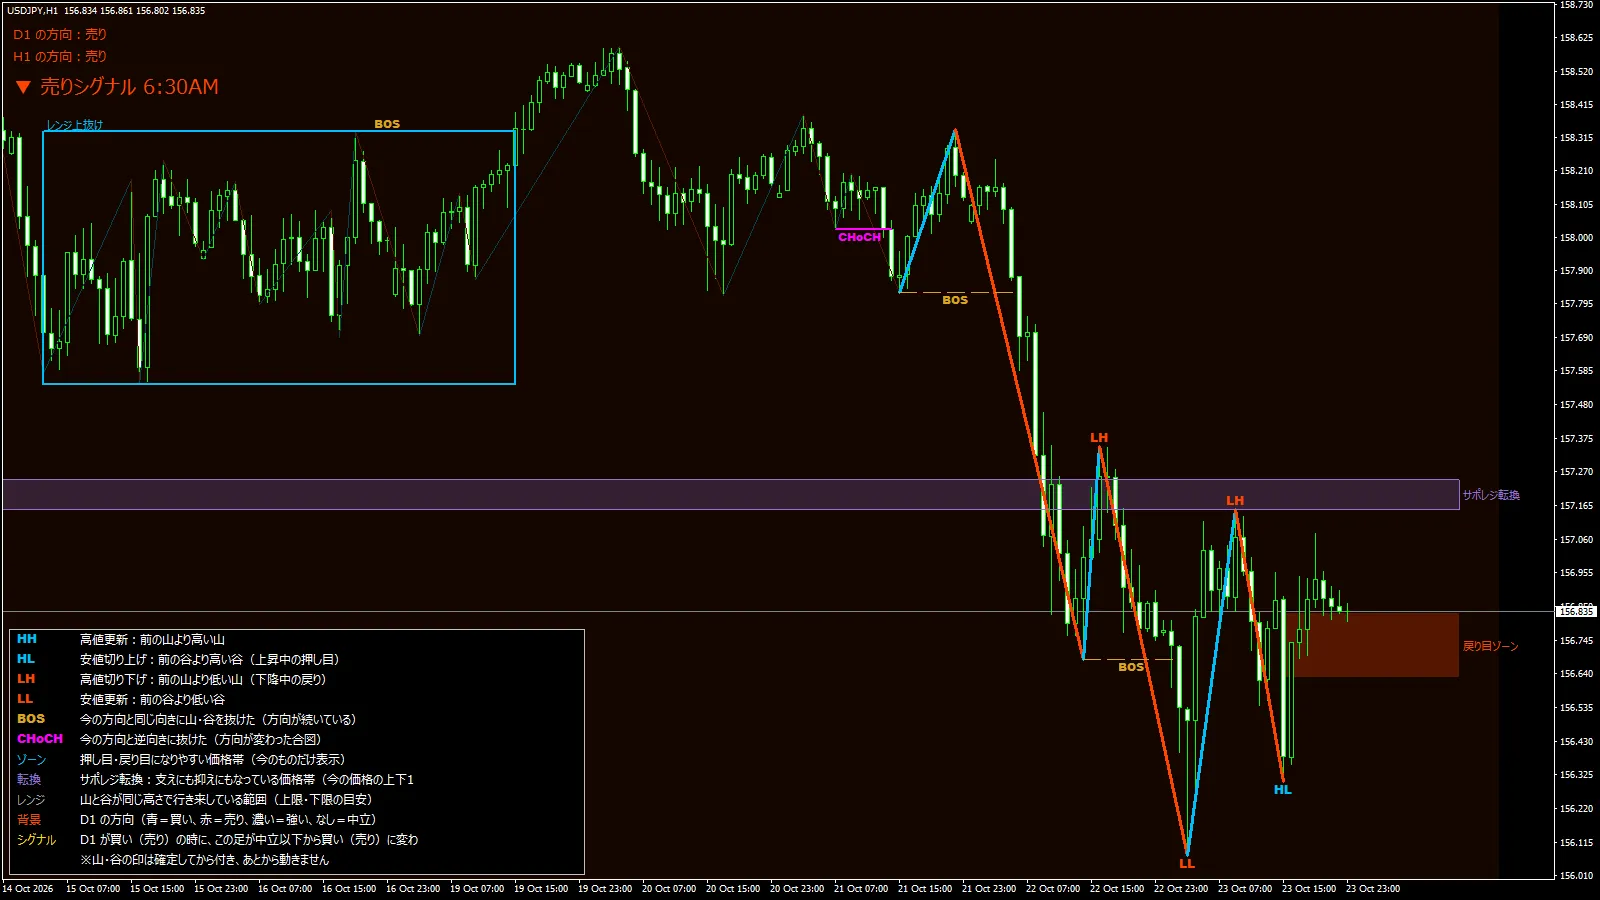
On the 22nd peak 157.350 and the 23rd peak 157.153,LH appeared, and the trough at 156.072 around 3 o’clock on the 23rd hasLL appeared. The subsequent trough (156.305) forms anHL, and whether this trough breaks is the key point on the 1-hour chart.
The closing price 156.835 is near the upper edge of theretracement zone (around 156.7–156.8). Above it, around 157.2, there is also a supply-resistance reversal zone displayed.