

【10/26 Morning EURUSD】After five weeks of declines, range-bound around 1.11–1.12|Structure of the market seen on LIGHTHOUSE and the recent targets
About LIGHTHOUSE
LIGHTHOUSE (Lighthouse) automatically displays the “reading” portion of the chartan auxiliary indicator for discretionary trading.
・Display the direction of the higher timeframe and the current candle in five levels at the top-left of the chart
・Automatically display the updates of highs and lows (HH/HL/LH/LL) and the BOS/CHoCH lines
・Display pullback and retracement zones, support/resistance reversal zones, and the range box
・The marks for peaks and valleys appear after confirmation and do not move or disappear later (no repaint)
・Since the meanings of terms are displayed at the bottom left of the chart, you can learn while looking
The trading decisions should be made by you, and this is a tool to quickly gather the elements for decision-making.
[Key points] EUR/USD market memo up to the close on Oct 23 (Friday)
・From the high in August (around 1.17) to the close on Oct 14 at 1.11122After a large drop, these last three weeks have traded around 1.11–1.12
・The close on Oct 23 (Friday) is1.12023(this day’s high 1.12258; low 1.11839)
・The upper range is1.1226–1.1269, the lower range is1.1184 and 1.1112and these are the price zones that are likely to be watched first
1. Recent Market Feel (Weekly, Daily, 1-Hour)
Weekly: after five consecutive weeks of decline, the down move is stalling
From the week of September 7 to the week of October 5, the weekly close fell for five straight weeks, reaching 1.11122 on Oct 14. In the following three weeks, the closes were around 1.12003, 1.12381, and 1.12023, staying near 1.12.
Daily: movement within 1.1112–1.1269
There has been oscillation between the low of 1.11122 on Oct 14 and the high of 1.12687 on Oct 16. On the 20th and 22nd, prices rose to the mid-1.125s, but both were pushed back by upper wicks, and on the 23rd the price closed at 1.12023.
1-Hour: lower highs through pullbacks
After rising to 1.1255 on the 22nd, there was a sharp drop, and the subsequent retracement highs have gradually fallen to 1.1231 and 1.1226. On the 23rd, the price fell to 1.11839 and closed in a narrow range of 1.119–1.121.
Price zones that are likely to be watched (based on chart facts)
| 1.1255–1.1269 | A band where the highs on the 16th, 20th, and 22nd align |
| 1.1226–1.1231 | Retracement highs on the 22nd–23rd |
| 1.12023 | Close on Oct 23 (Friday) |
| 1.1184 | Low on the 23rd |
| 1.1171 | Low on the 19th |
| 1.1112 | Low on Oct 14 (this move’s low) |
Before and after major economic releases or speeches, price moves tend to be larger, so please check the schedule yourself as well.
2. When you view the same chart with LIGHTHOUSE
From here, we will view the same EUR/USD chart with LIGHTHOUSE applied.
Daily (higher timeframes are weekly): both weekly and daily show a “strong sell”
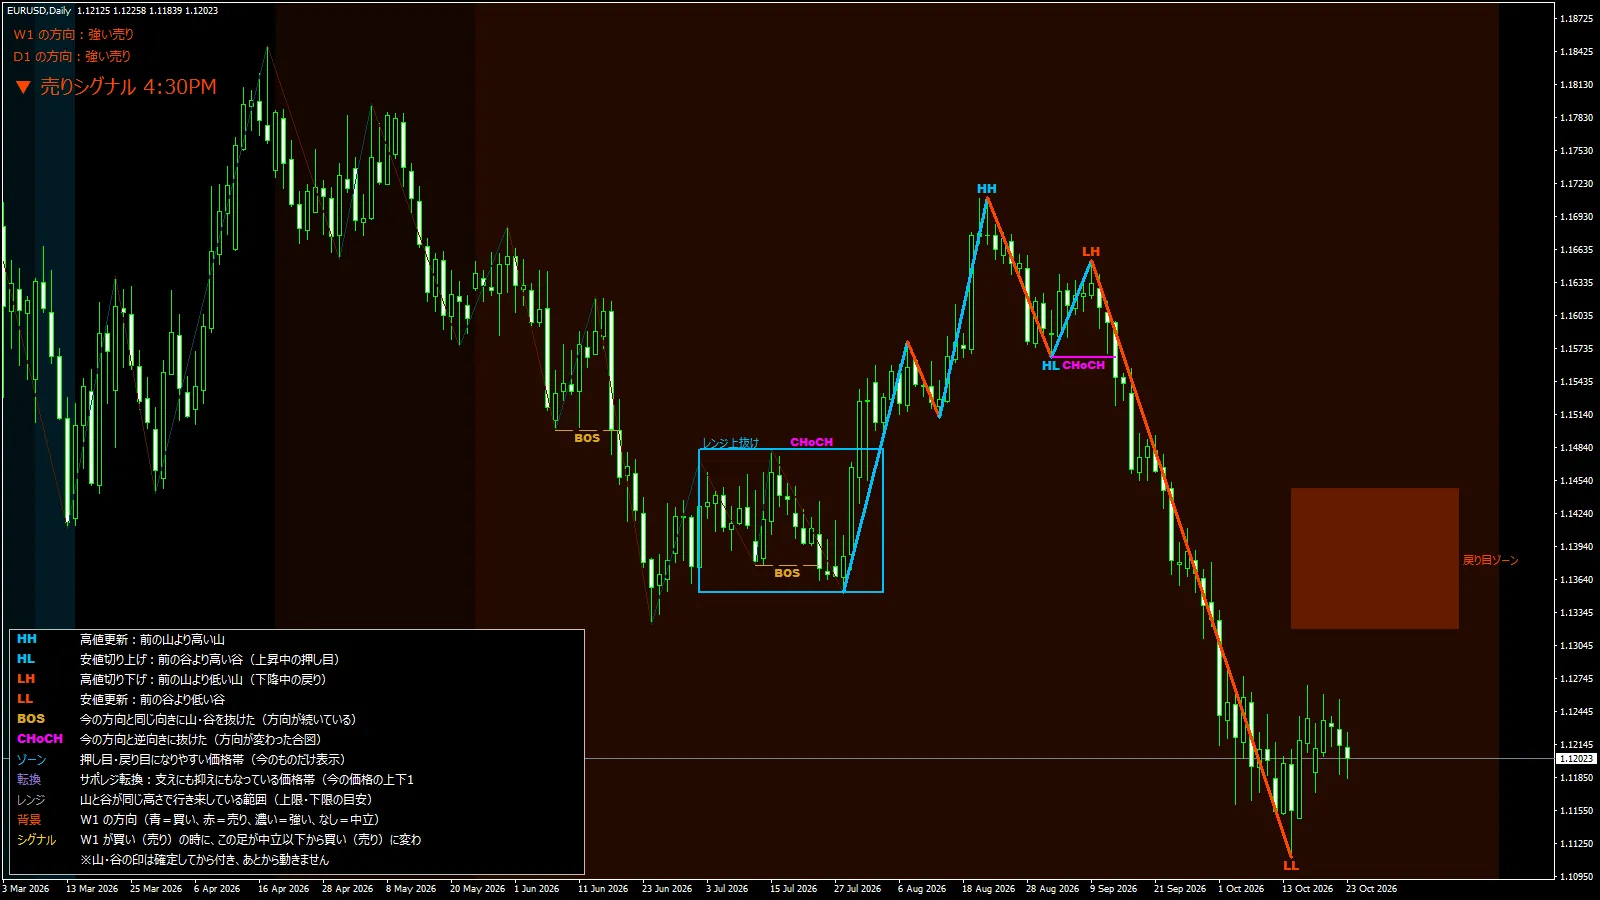
The top-left shows the direction of W1: strong sell; D1: strong sell. At the August peakHH, at the early September peak aLH appeared, and in the subsequent decline the October 14 trough formed aLL. The arrangement of peaks and troughs shows the shift from rising to falling momentum.
There is a retracement zone above the current price in the 1.13–1.14 rangeretracement zone. Since it is well above the current consolidation upper limit (around 1.127), viewed on a daily chart, the retracement is still shallow.