
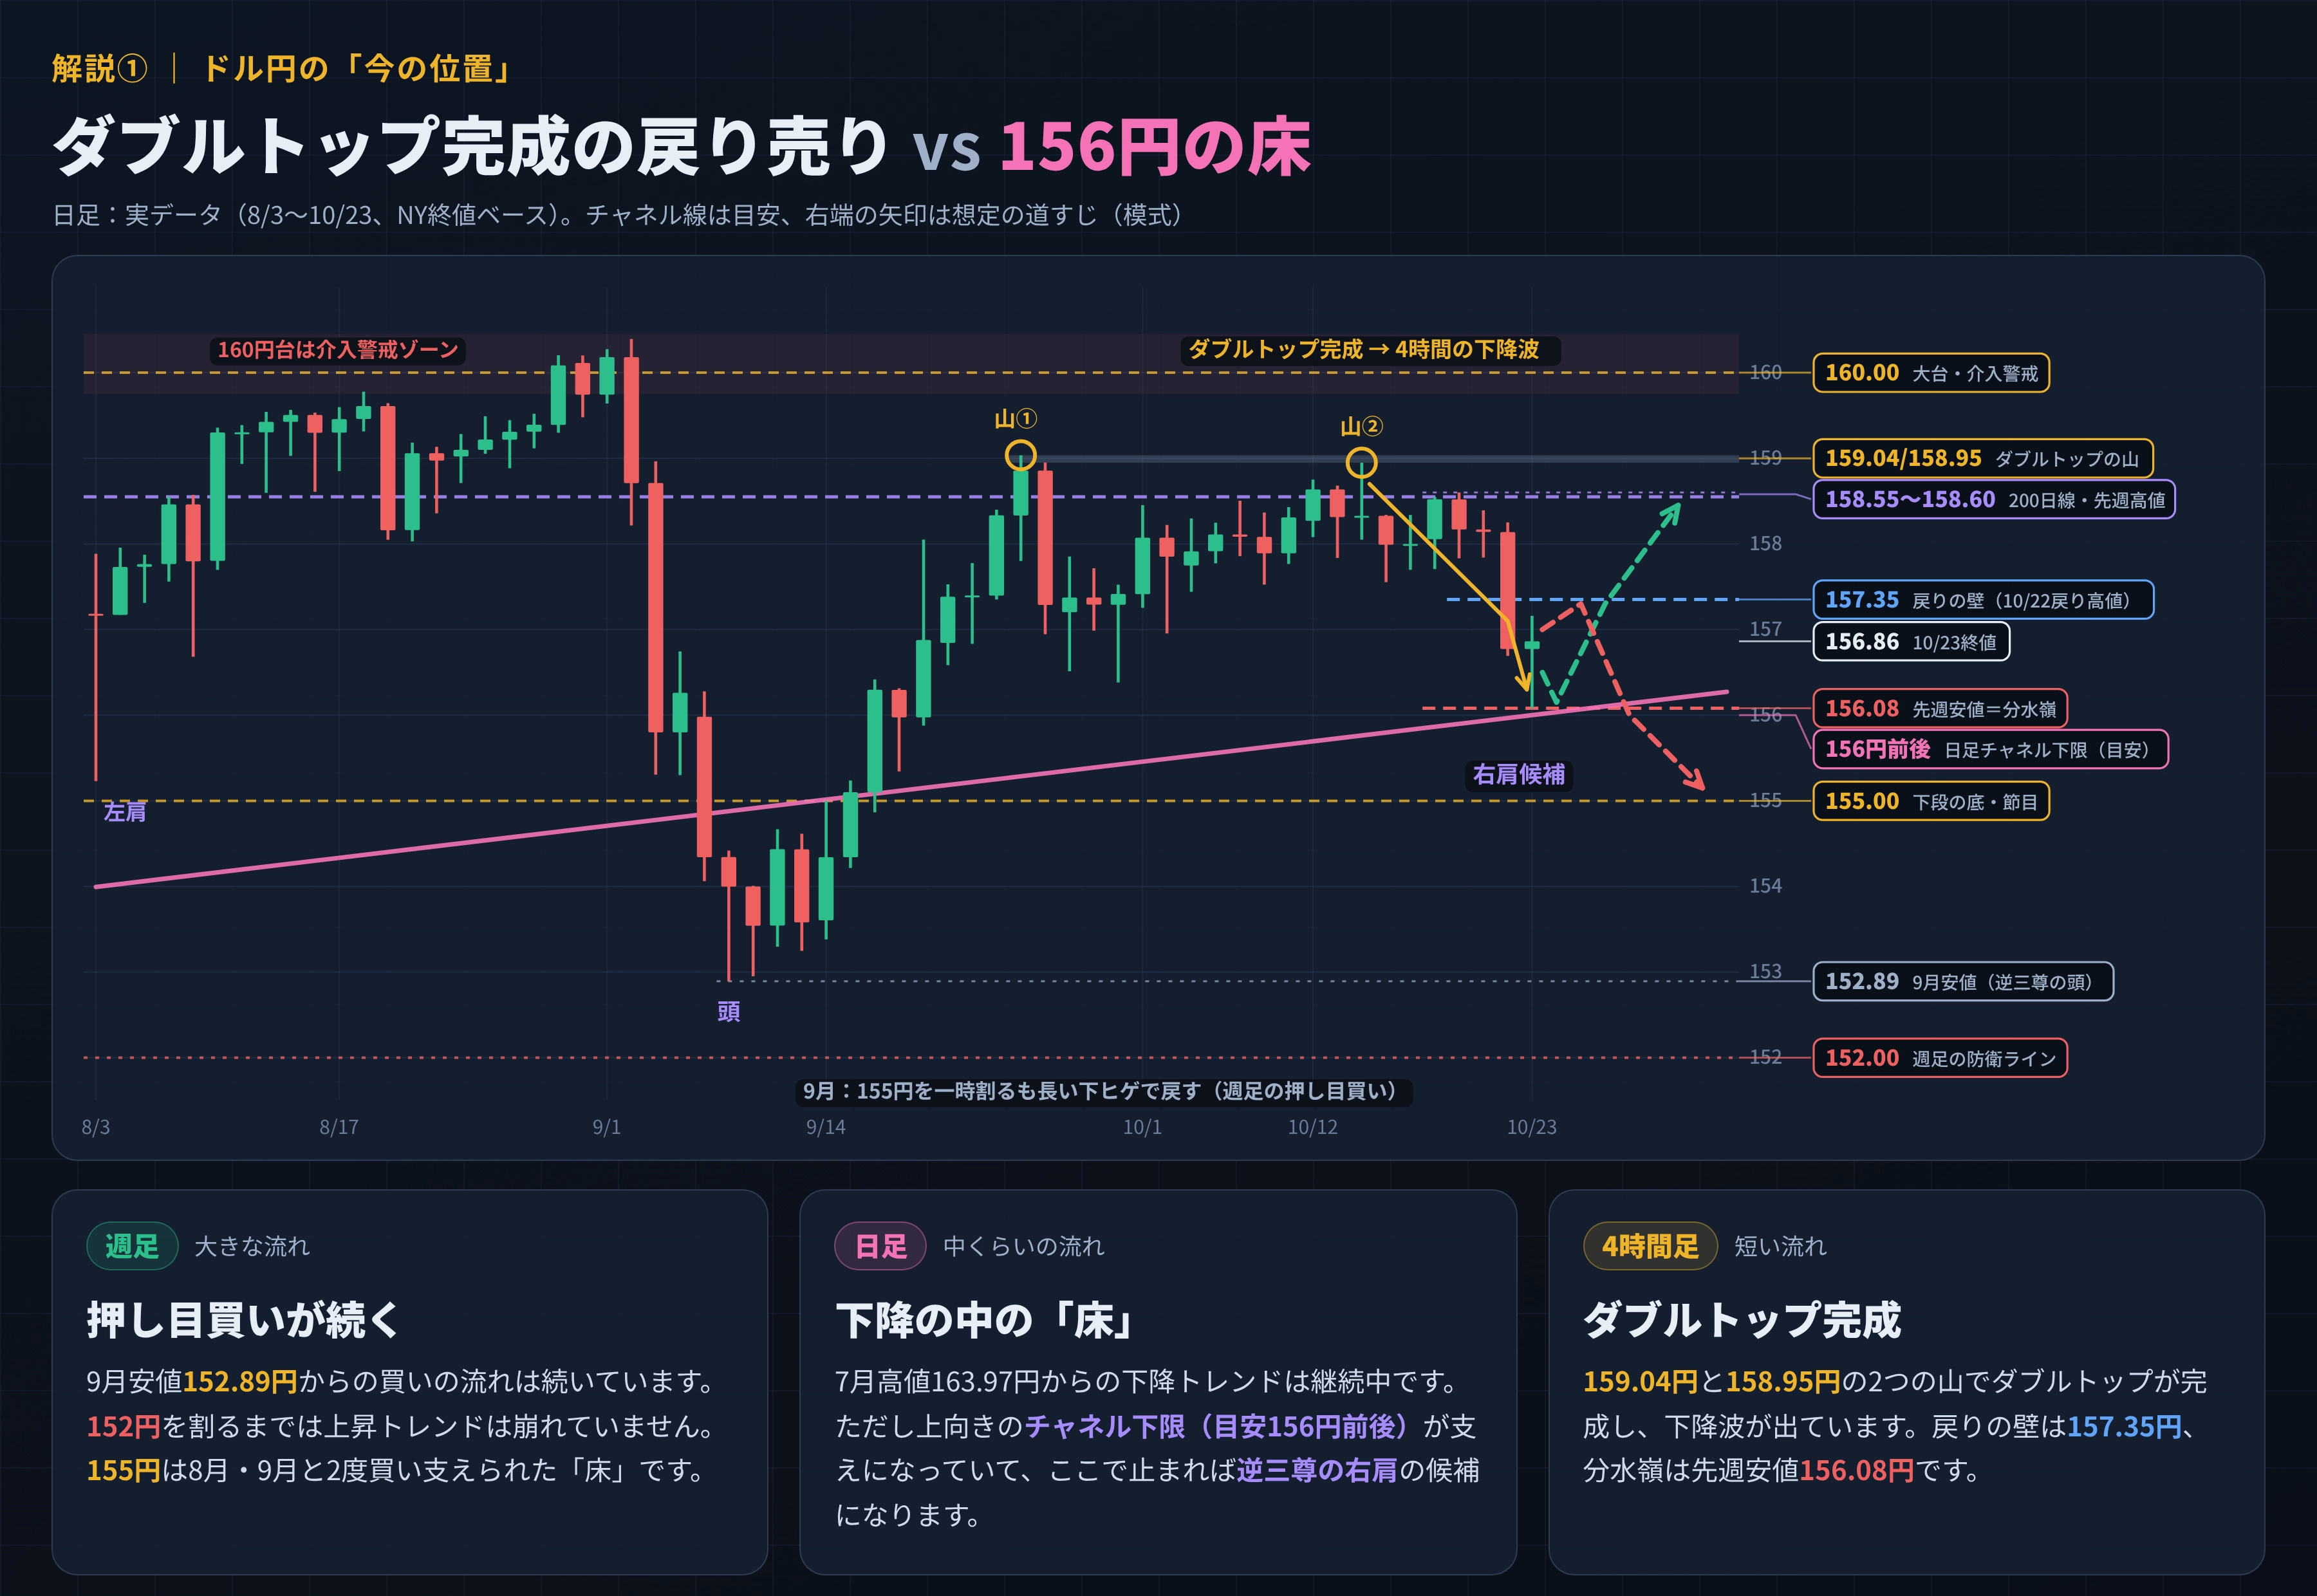
A pullback selling after the completion of the 4-hour double top, with FOMC, the Bank of Japan, and month-end rebalancing all converging, so prices tend to be volatile near key levels.
“Sell on the rally after a completed four-hour double top”and
“the week when the floor at the daily lower bound (around 156 yen) supported by the weekly pullback buying meets the weekly chart”.
The watershed is last week’s low of 156.08 yen.
FOMC, Bank of Japan, and month-end rebalancing coincide, so prices tend to be volatile near key levels.
■What happened last week (10/19–10/23)
────────────────────────────────────────
Weekly four-price: Open 158.06 / High 158.60 / Low 156.08 / Close 156.86
10/19 (Mon) 158.06→158.52. Reverted near the 200-day moving average (158.55)
10/20 (Tue) Weekly high 158.60. Could not break through the 200-day line and closed at 158.17
10/21 (Wed) Small movement between 157.84 and 158.39. 21-day line supported
10/22 (Thu) Nikkei stock average plunges on AI and semiconductor stocks; risk-off yen buying and U.S. yields fall.
Fell from 158.25 in Tokyo morning to 156.69 in London.
In New York, briefly recovered to 157.35 but closed at 156.77
10/23 (Fri) Tokyo morning low 156.08 (briefly broke below the 3-week low of 156.38).
Then rebounded to 157.16, NY range 156.30–157.08, close 156.86
→ On the four-hour chart, the “two peaks” at 159.04 (9/24) and 158.95 (10/14) formed a double top, creating a downward wave.
■The current position in three timeframes
────────────────────────────────────────
【Weekly chart: overall trend】 Pullbacks continue
The buying momentum from the September low of 152.89 yen remains. The uptrend remains intact until it breaks below 152 yen.
152 yen is a floor supported by buyers in August and September. Although it briefly dipped below 155 yen in September, it recovered with a long lower wick.
【Daily chart: intermediate trend】 The floor within a downtrend
Downtrend from the July high of 163.97 yen continues.
However, the upward-sloping lower boundary of the channel (around 156 yen) provides support.
If this holds, it could become the right shoulder of an inverted head-and-shoulders pattern.
【Four-hour chart: short-term trend】 Double top completed
The barrier on the rebound is 157.35 yen (retracement high on 10/22).
This is almost the same level as half of last week’s down move from 158.60 to 156.08 (about 157.34).
watershed is last week’s low of 156.08 yen.
Trading range (three tiers)
Upper: 157.35–158.60 (top near last week’s high and around the 200-day line)
Middle: 156.08–157.35 (current position)
Lower: 155.00–156.08 (lower bound around the 155 yen milestone)
■In event weeks, battle with a timetable
────────────────────────────────────────
The market’s “storm” has a predetermined time.
Write the times, and during the storm hold off on judging the lines. This is the core of this section.
[Diagram image]
Mon 26 Tue 27 Wed 28 Thu 29 Fri 30 Sat 31
───────────┬─────┬───────┬──
FOMC GDP, PCE Bank of Japan Month-end
3:00 ECB 21:30– Lunch 15:30 1:00
Barrier 157.35 ─ ─ ─ ─ ─ ─ ─ ─ ─ ─ ─ ─ ─
Price movement ~~~~~~|~~~~~↑~~~~|~~~~|〜
Floor around 156 ▓▓▓▓▓▓▓▓▓▓|▓▓▓▓▓▓▓▓▓▓|▓▓|▓
↓ briefly breaks but returns = wick (do not judge here)
1. Enter storm times first (all in Japan time)
FOMC 10/29 (Thu) 3:00 press conference 3:30
U.S. GDP速報・9月PCE 10/29 (Thu) 21:30
ECB 10/29 (Thu) 22:15
Tokyo CPI 10/30 (Fri) 8:30
Bank of Japan 10/30 (Fri) around noon (time not set) Governor Ueda press conference 15:30
Month-end fix 10/31 (Sat) 1:00 (London 16:00)
2. Do not judge by the wick during the storm
Immediately after releases, lines tend to briefly break and then return with a wick.
Whether the floor is protected is decided by the 1-hour closing price and shape after the storm passes.
(Second bottom, lower highs)
3. What is month-end rebalancing
It’s like restoring the household budget allocations at month end.
Asset managers adjust ratios of currencies whose values have diverged due to stock and bond movements at month end.
Orders tend to accumulate around London 16:00 (in this case Japan time 10/31 (Sat) 1:00),
and the direction of buying/selling depends on stock market monthly performance, making it hard to read in advance.
4. Three decisions before the storm
① Should you carry positions through the storm
② If carrying, reduce position size from usual
③ “If floor holds, then this; if breaks, then that” plan
Decide in advance to avoid panic when things get rough.
■This Week’s Scenario