
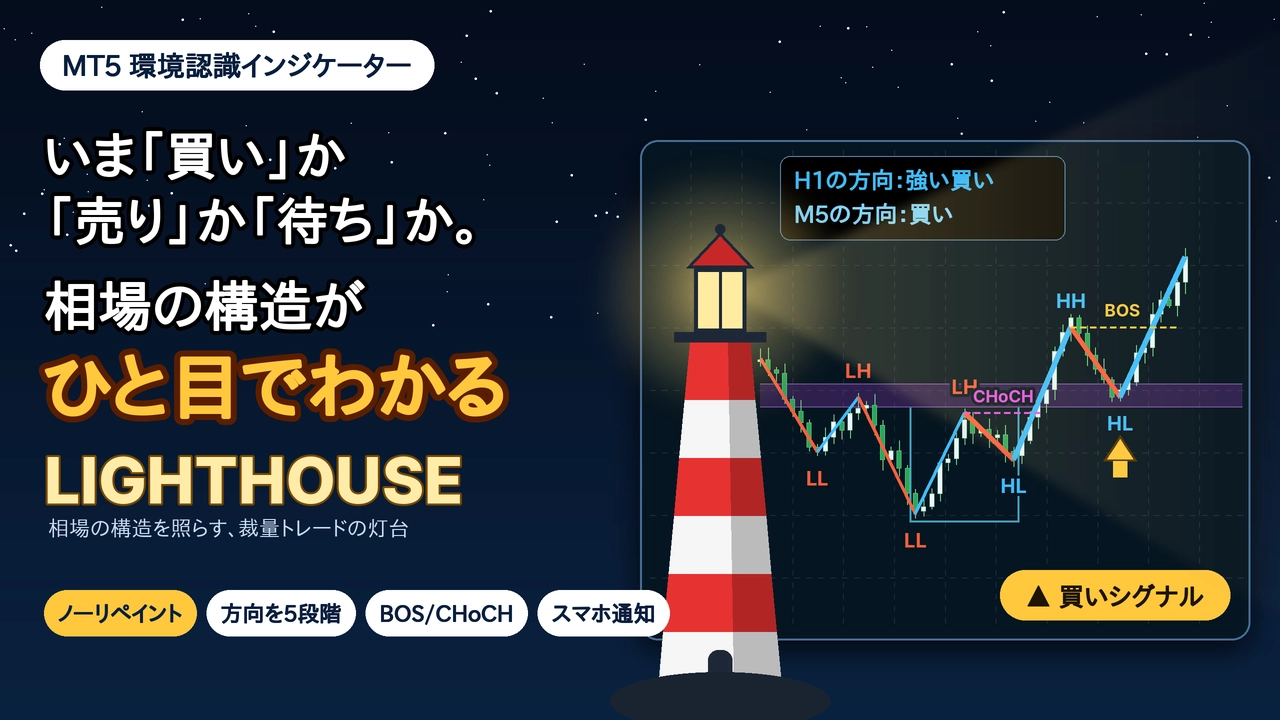
【10/26 Night EUR/USD】5 weeks of declines followed by range around 1.11–1.12 | Market structure seen on LIGHTHOUSE
Key points: Euro-Dollar Market Memo at Week Start
From the August high around 1.17 to the October 14 low of 1.1112fell sharply, and in the last three weeks has been range-bound around 1.11–1.12
Last week's close was1.12023(high 1.12599, low 1.11714)
Resistance is1.1226–1.1269and support is1.1184 and 1.1112– these are notable price zones to watch first
1. Recent Market Feel (Weekly, Daily, 1-Hour)
Weekly: after five weeks of decline, looks like a halt near bottom
After touching 1.171 in August, from the first week of September to the first week of October the weekly chart fell for five consecutive weeks, bottoming at 1.11122 on October 14. Since then, for three weeks the closes have been 1.12003, 1.12381, 1.12023, settling around 1.12.
Daily: moving up and down in 1.1112–1.1269 range
Volatility between the October 14 low of 1.11122 and the October 16 high of 1.12687. Last week rose to the 1.125s on the 20th and 22nd, but both attempts were capped by upper wicks, ending on the 23rd at 1.12023.
1-Hour: Lower highs indicate a retreat
After a rally to 1.1255 on the 22nd, prices plunged, and the subsequent rallies formed lower highs of 1.1229 and 1.1226. On the 23rd, it fell to 1.11839 and closed the week in a tight range around 1.119–1.121.
Conscious price zones (facts from the chart)
| 1.1255–1.1269 | Highs on the 16th, 20th, and 22nd aligning |
| 1.1226–1.1229 | Rally highs on the 22nd–23rd |
| 1.12023 | Last week's close |
| 1.1184 | Low on the 23rd |
| 1.1171 | Last week's low (19th) |
| 1.1112 | Low on October 14 (this move's low) |
This week, there are continued releases of monetary policy from Japan, the United States, and Europe. Volatility tends to rise around these announcements, so please check the schedule on your own as well.
2. When viewing the same chart in LIGHTHOUSE
From here, we will add an indicator that displays market structure on the euro-dollar chartLIGHTHOUSEand observe.
Daily chart (higher timeframe is weekly): both weekly and daily show a “strong selling” signal
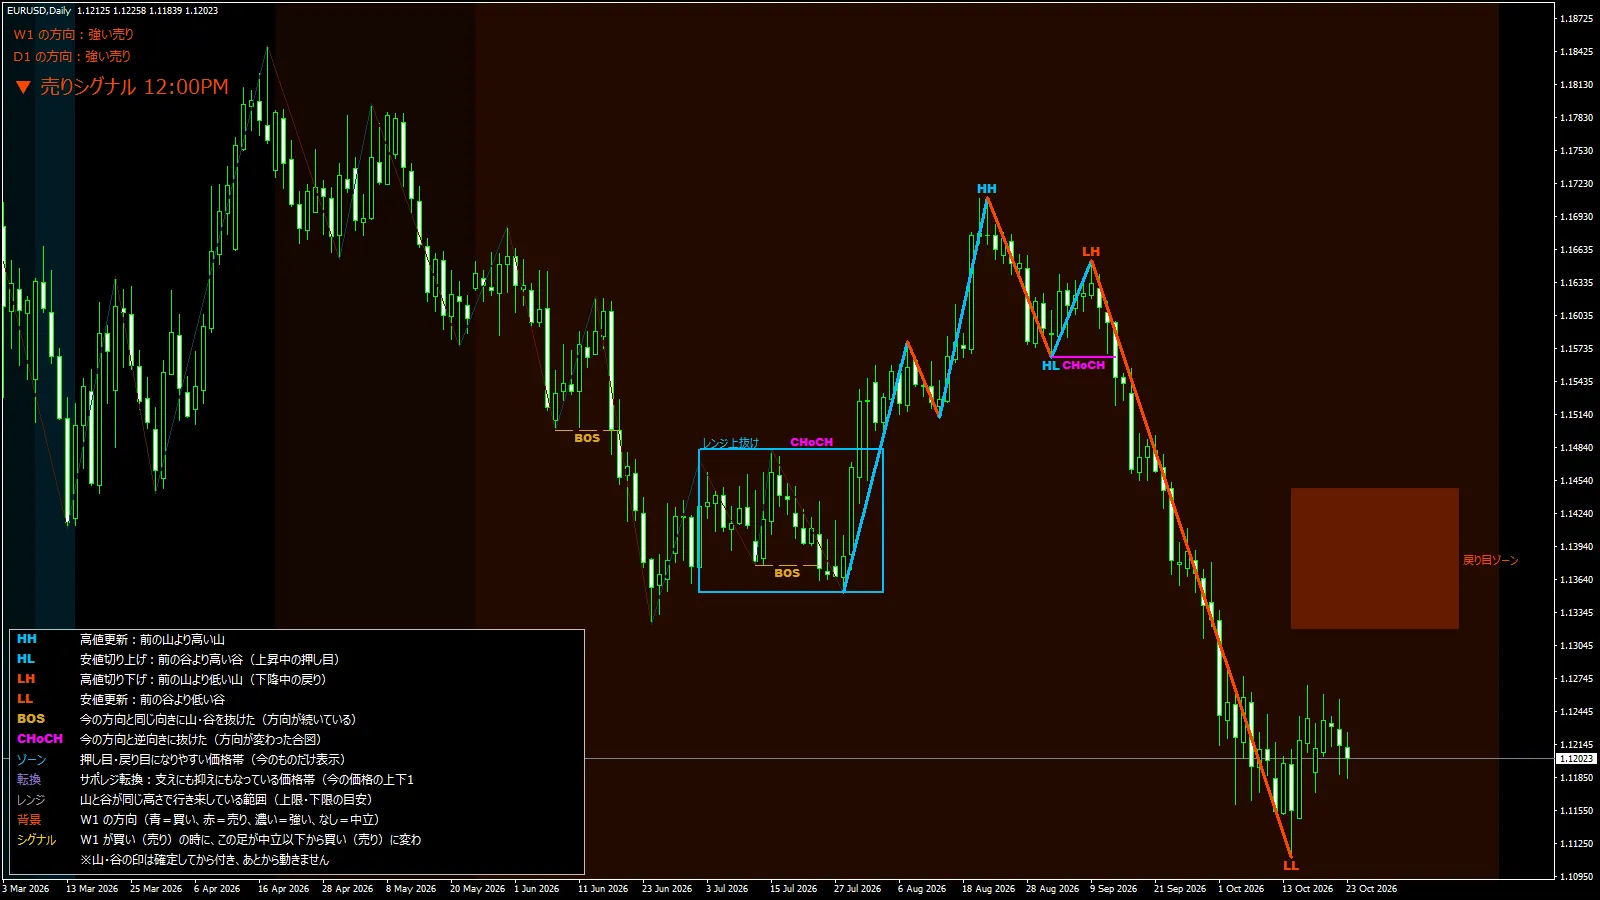
Top-left shows the direction of W1: strong sell and D1: strong sell. From the August peak,HH, to the early September peak,LH appeared, and the subsequent decline produced the October 14 troughLL. The sequence of highs and lows reveals a shift from up to down.
In the price zone above current levels, theretracement zoneis displayed. Since the current consolidation is well above the upper bound around 1.127, on the daily chart it indicates that the retrace is still shallow.
1-Hour chart (daily is the higher timeframe): two consecutive lower highs indicate price is inside a retracement zone
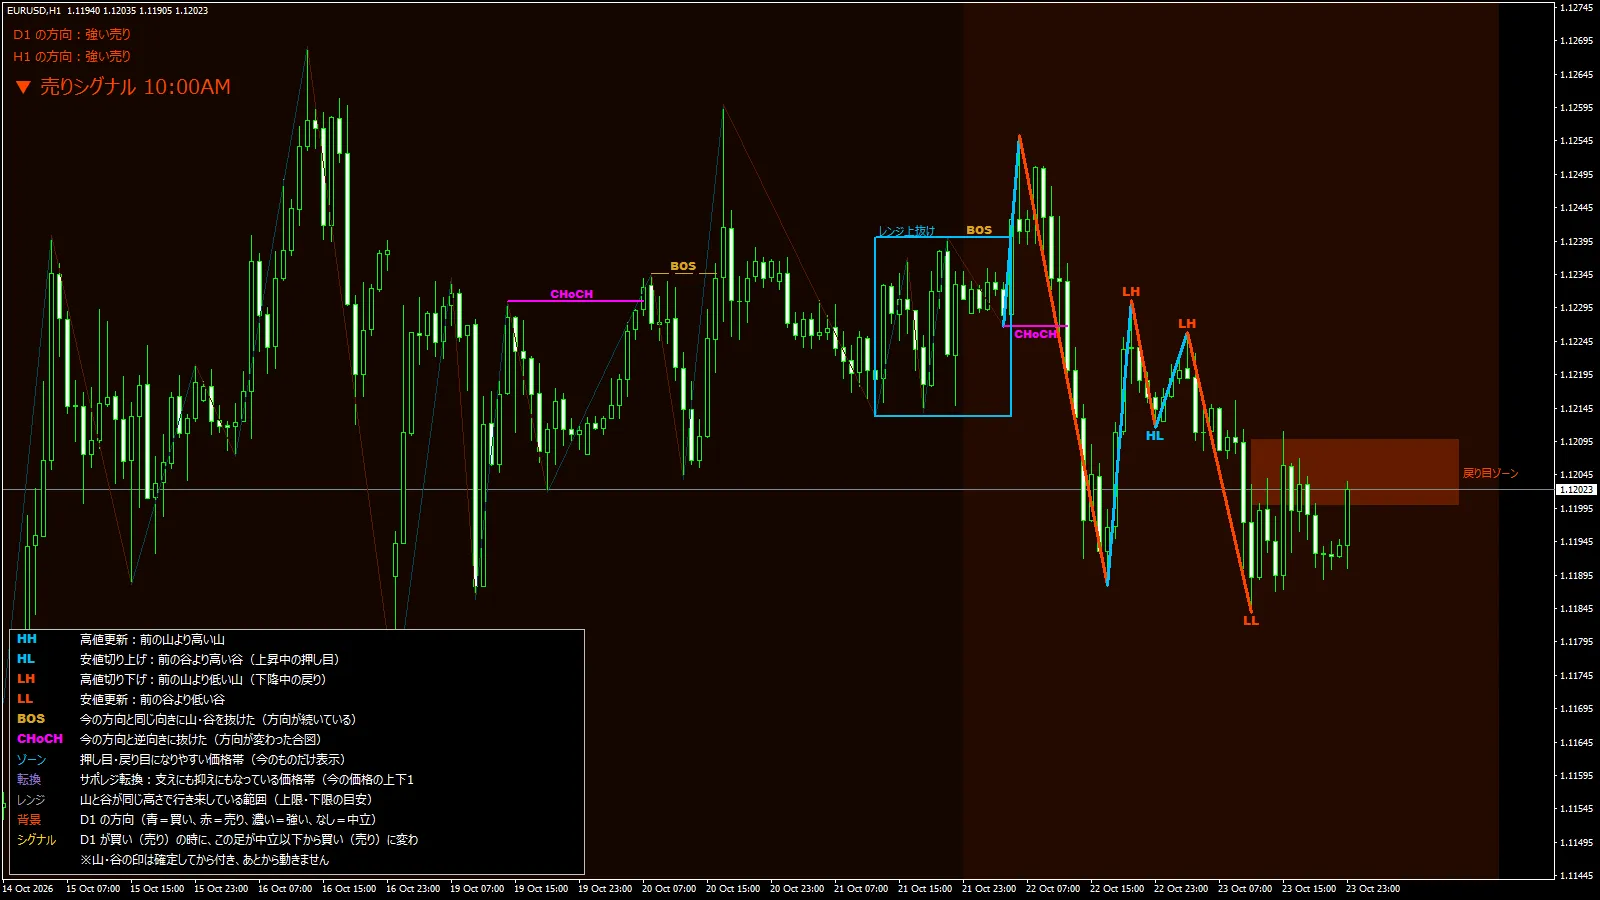
After the drop on the 22nd, two consecutive LHs appeared in the retracement rally, and the following LL appeared on the 23rd. Before that, after breaking out of a range upward, a CHoCH signal appeared (a sign of a trend reversal as the direction changes), indicating that an upward breakout did not persist.LH andLL are noted. The CHoCH signal shows the direction may have changed.
Friday's close sits inside the displayedretracement zone(around 1.1200–1.1210). At Monday’s start, will this band push back the price or break higher toward LH 1.1226–1.1229? The 1-hour view is the key here.
5-minute chart (daily is the higher timeframe): the higher timeframe and the current leg are opposite
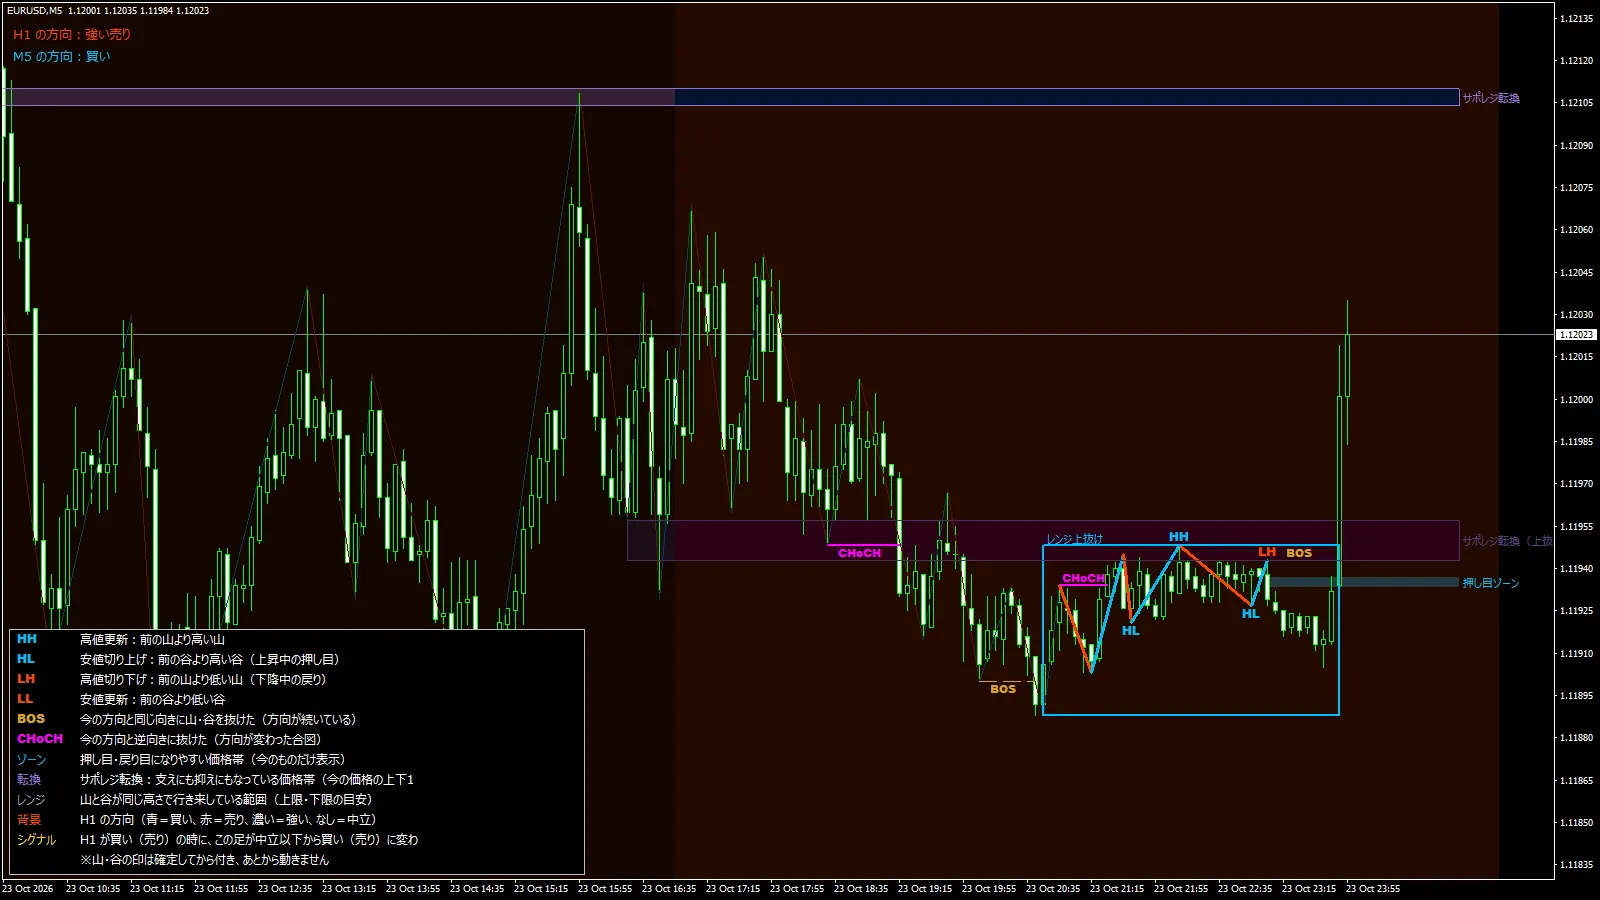
In the final hour of Friday, price rose from 1.1191 to 1.1203, turning the 5-minute chart to a bullish bias. Meanwhile, the 1-hour chart remains in a strong sell state.When the higher timeframe and the current leg point in opposite directions, short-term gains can still fit within the higher timeframe retracement. This is where LIGHTHOUSE excels, presenting the top-left two lines together. An upside target around 1.1210 in the support/resistance zone is also displayed above.
Summary
Direction indicators on the weekly, daily, and 1-hour charts all align with a “strong sell,” but the price has been range-bound around 1.11–1.12 for three weeks. The upper bound is 1.1226–1.1269, and the lower bounds are 1.1184 and 1.1112, so this week will likely involve watching which of these zones is tested first.
About LIGHTHOUSE
LIGHTHOUSE helps automatically display the chart’s interpretive aspectsas a discretionary trading aid indicator.
・Displays the direction of higher timeframes and the current candle in five steps at the chart’s top-left
・Automatically displays highs/lows updates (HH/HL/LH/LL) and BOS/CHoCH lines
・Shows pullback and retracement zones, support/resistance reversal zones, and a range box
・Labels for highs and lows appear only after they are confirmed and do not repaint or disappear later
・Definitions are shown at the bottom-left to help you learn as you watch
The tool is for compiling decision-making materials while you make trading decisions on your own.
・This article整理s past price movements and does not guarantee future price movements. Please make investment decisions at your own risk.
・Prices and dates are based on Big〇〇〇 (demo account) MT4 charts (server time). They may vary slightly by broker.
・LIGHTHOUSE is intended to aid market analysis and does not perform automated trading.