
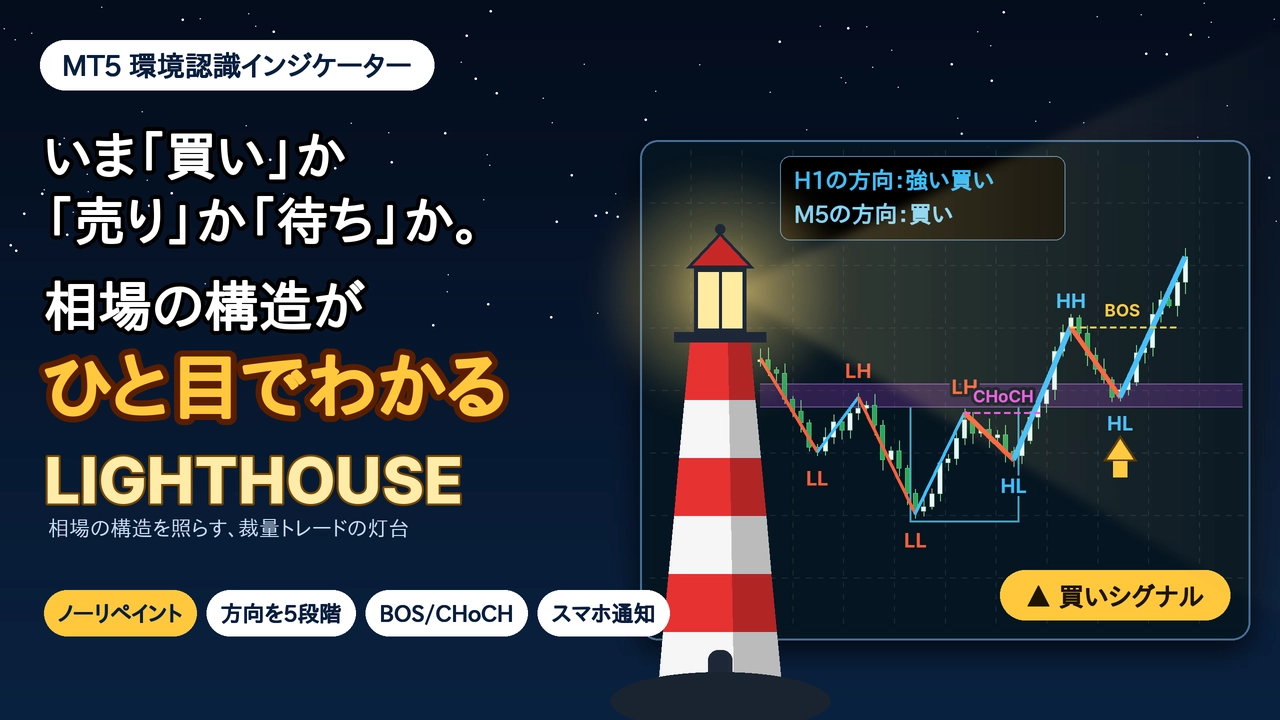
【10/26 Morning Euro-Dollar】After five weeks of declines, it trades in a range around 1.11–1.12|Market structure seen in LIGHTHOUSE
[Key Points] EUR/USD Market Memo for the Start of the Week
From the August high around 1.171 to October 14 at 1.1112, it fell sharplyafter a large decline, for the past three weeks it has been ranging around 1.11–1.12
・Last week's close1.12023(High 1.12599 · Low 1.11714)
・Resistance1.1226–1.1269, and support1.1184 · 1.1112are the price levels that are likely to be watched first
1. Recent Market Feel (Weekly, Daily, 1-Hour)
Weekly: After five consecutive weeks of decline, a pause in the downtrend
After hitting 1.171 in August, the weekly chart fell for five weeks from the first week of September to the first week of October, reaching 1.11122 on October 14. Since then, over the next three weeks, the closes were 1.12003, 1.12381, and 1.12023, settling around 1.12.
Daily: Oscillating in the range 1.1112–1.1269
The price has been moving between the October 14 low of 1.11122 and the October 16 high of 1.12687. Last week it rose to around 1.125 on the 20th and 22nd, but both attempts faded and closed on the 23rd at 1.12023.
1-Hour: Lowering of the swing high
After rising to 1.1255 on the 22nd, it plunged, and the subsequent swing highs have gradually been lowered to 1.1229 and 1.1226. On the 23rd it fell to 1.11839 and ended the week in a tight range of 1.119–1.121.
Price zones likely to draw attention (based on chart facts)
| 1.1255–1.1269 | Highs on the 16th, 20th, and 22nd align |
| 1.1226–1.1229 | Pullback highs on the 22nd–23rd |
| 1.12023 | Last week's close |
| 1.1184 | Low on the 23rd |
| 1.1171 | Last week's low (19th) |
| 1.1112 | Low on Oct 14 (low of this decline) |
This week, Japan, the US, and Europe are scheduled to publish more monetary policy decisions. Moves can become more volatile around announcements, so please confirm the schedule on your own.
2. When viewed with LIGHTHOUSE on the same chart
From here we will use an indicator that displays the market structure on the same EUR/USD chartLIGHTHOUSEto observe.
Daily chart (weekly as higher timeframe): both weekly and daily show a “strong sell”
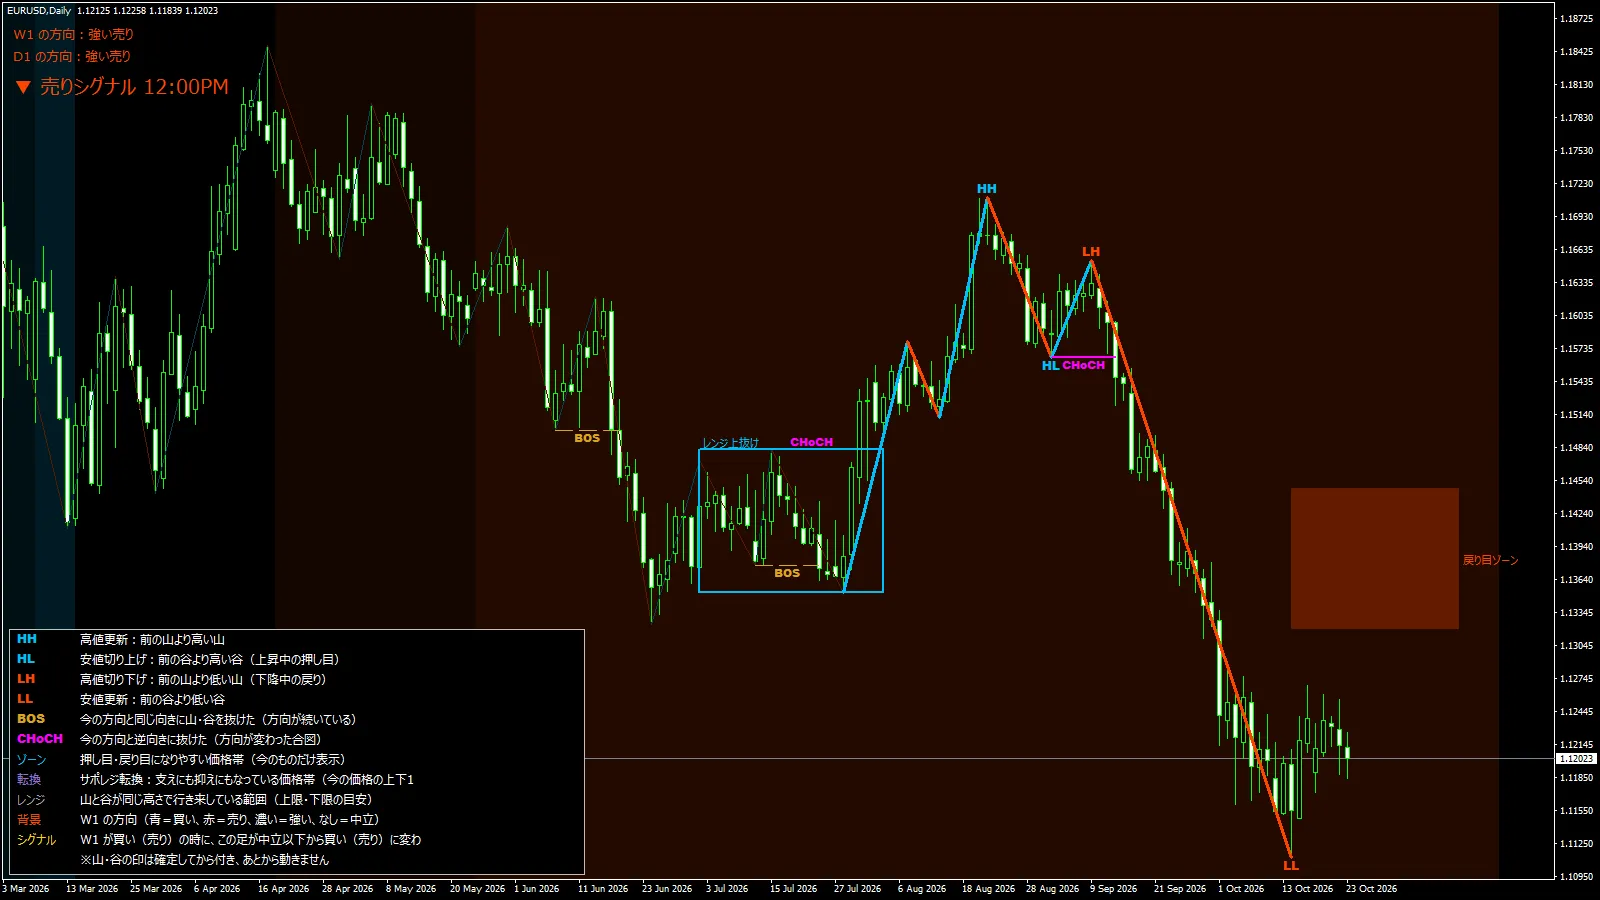
Top-left shows the direction of W1: strong sell and D1: strong sell. From the August peakHH, the early September peak formedLH, and during the subsequent decline, the October 14 trough formedLL. The sequence of highs and lows traces the shift from an uptrend to a downtrend.
There is a return-zone displayed above the current price in the 1.13–1.14 area. Since it is considerably above the current range near 1.127, on the daily chart the return is still perceived as shallow.
1-Hour chart (Daily as higher timeframe): two consecutive LHs and price within a pullback zone
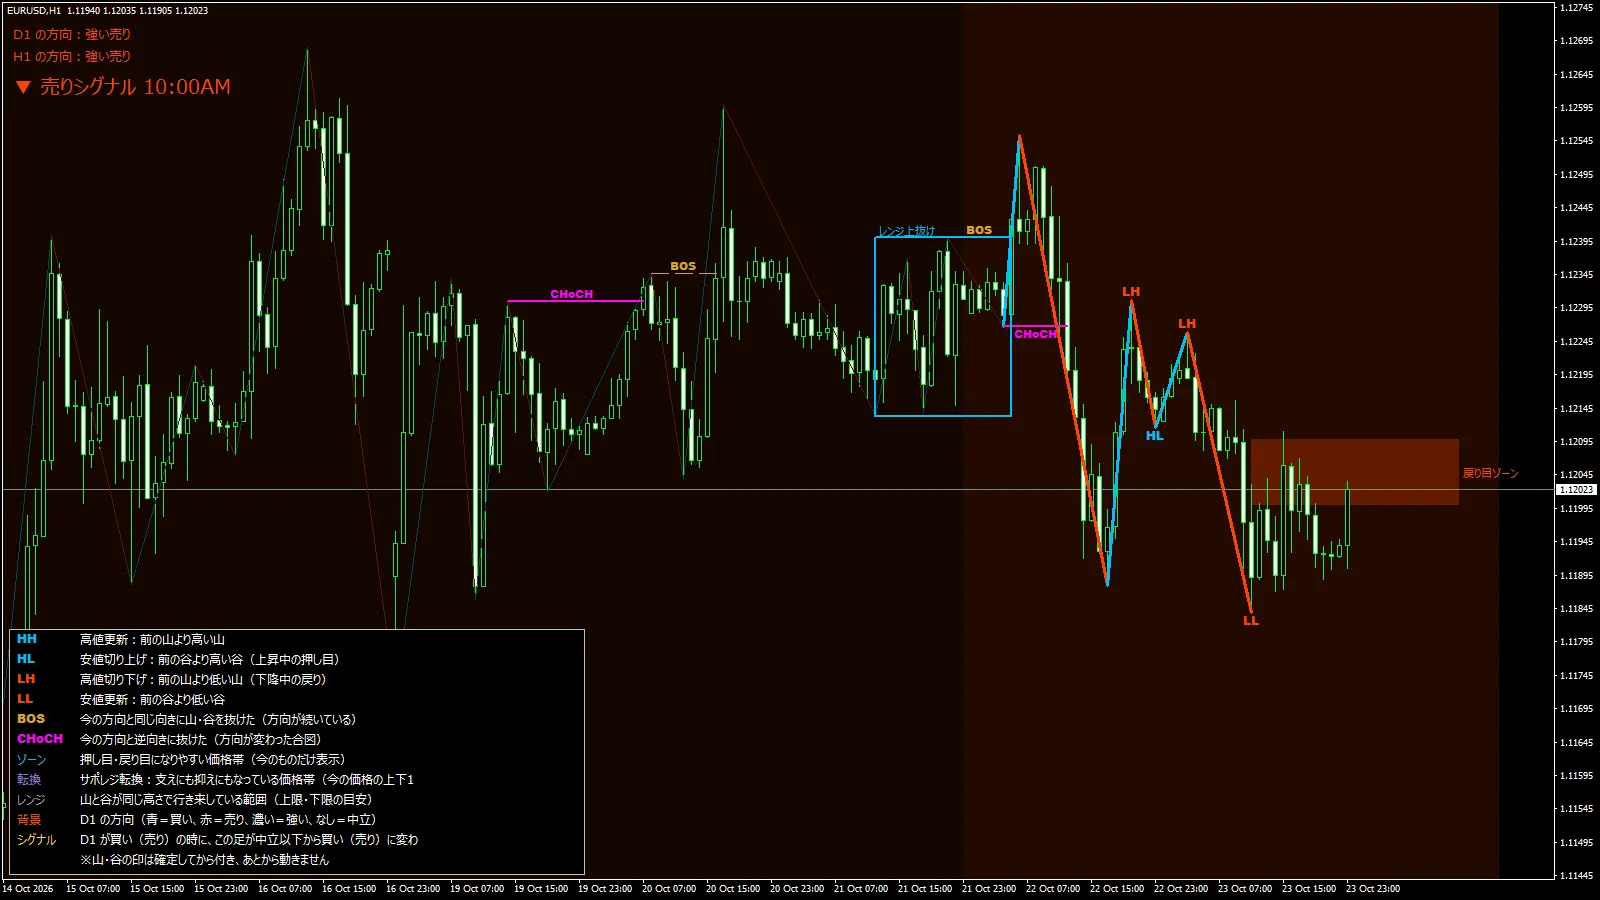
After the drop on the 22nd, there were two consecutive LHs on the retracement high and an LL at the next trough on the 23rd. Before that, a CHoCH (change of character) appeared after breaking out of a range upwards, indicating the move did not sustain an upside breakout.CHoCHappears as a sign that the direction has not continued higher.
The Friday close sits inside the displayedpullback zone(around 1.1200–1.1210). At the week start, will this zone hold and pull back, or will it break higher toward the LH target of 1.1226–1.1229? This is the key point on the 1-Hour chart.
5-Minute chart (1-Hour as higher timeframe): Higher timeframe and current bar in opposite directions
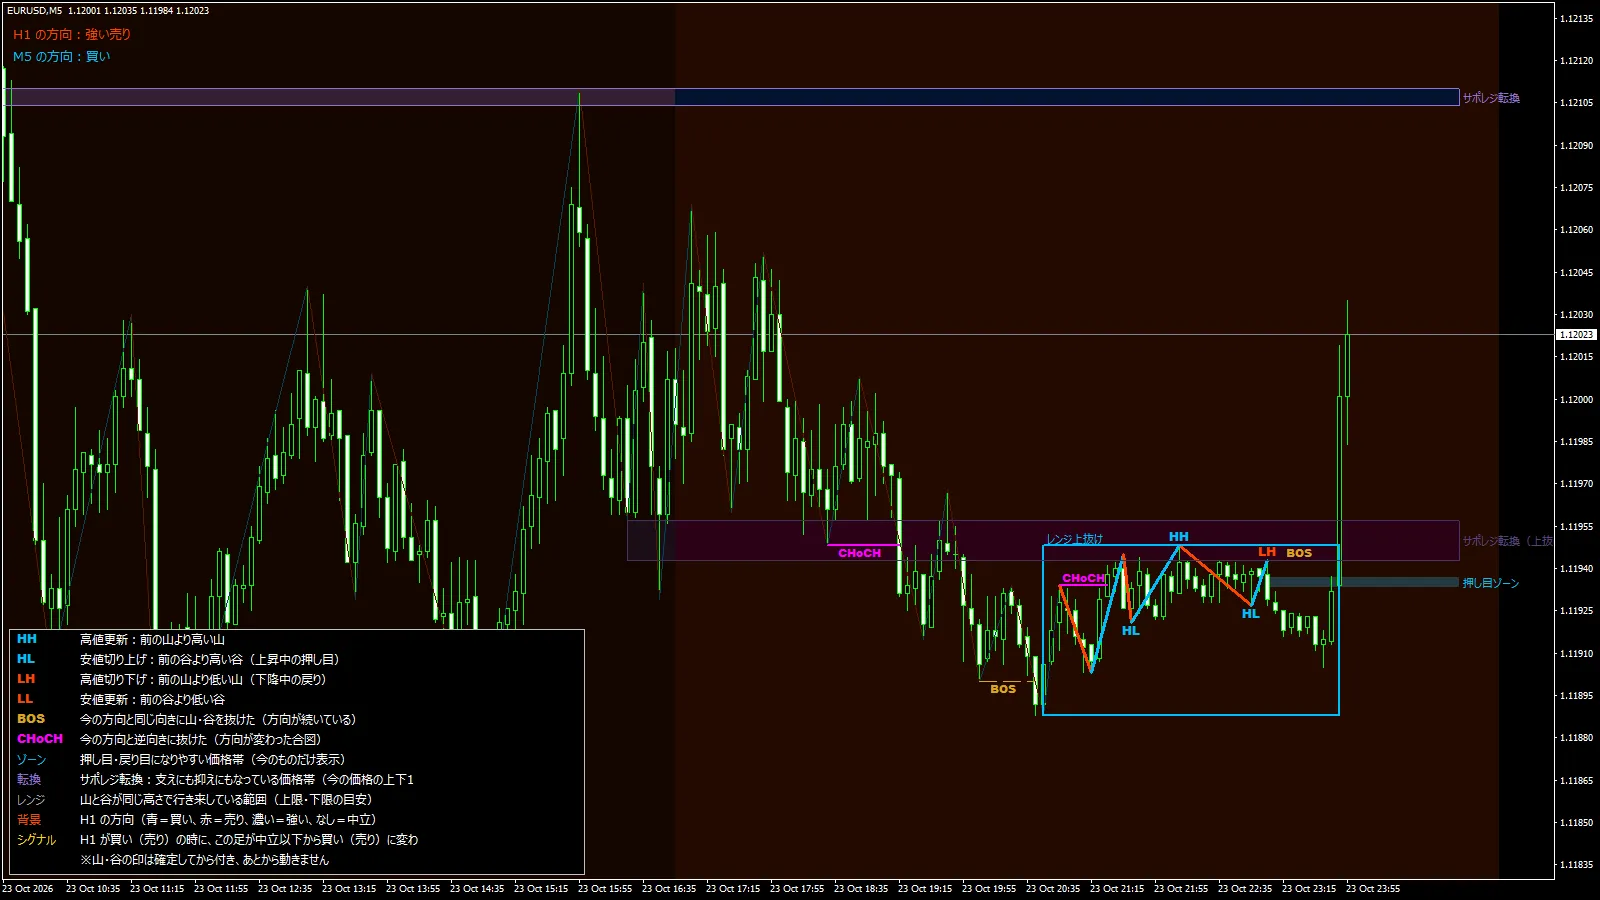
In the last hour of Friday, price rose from 1.1191 to 1.1203 and the 5-minute chart shifted to a “buy.” Meanwhile the 1-Hour chart remained in a “strong sell” stance.When higher timeframe and current bar point in opposite directions, small-timeframe rallies may stay within the higher timeframe pullback range, so you can compare the top two lines on the left and use LIGHTHOUSE accordingly. There is also a resistance-support flip zone around 1.1210 shown above.
Summary
Direction indicators on the weekly, daily, and hourly charts align with a “strong sell,” but price has been ranging around 1.11–1.12 for three weeks. It will be interesting to see which target the price tests first: the upside 1.1226–1.1269 or the downside 1.1184–1.1112.
About LIGHTHOUSE
LIGHTHOUSE is an indicator that automatically displays the chart’s “readable” aspectsas a discretionary trading aid.
・Shows the directions of the higher timeframe and the current bar in the top-left with five levels
・Automatically displays updates to highs/lows (HH/HL/LH/LL) and BOS/CHoCH lines
・Displays pullback and retracement zones, support-resistance flip zones, and range boxes
・Highs and lows are confirmed and do not repaint after being formed (no repaint)
・Meanings of terms are shown at the bottom-left so you can learn while viewing
It is a tool to help you gather decision-making information at a glance while you make your own trading decisions.
・This article reorganizes past price movements and does not guarantee future price movements. Please make investment decisions at your own risk.
・Prices and dates are based on the Big〇〇〇 (demo account) MT4 chart (server time). They may vary slightly by broker.
・LIGHTHOUSE is an indicator aimed at assisting market analysis and does not perform automated trading.