
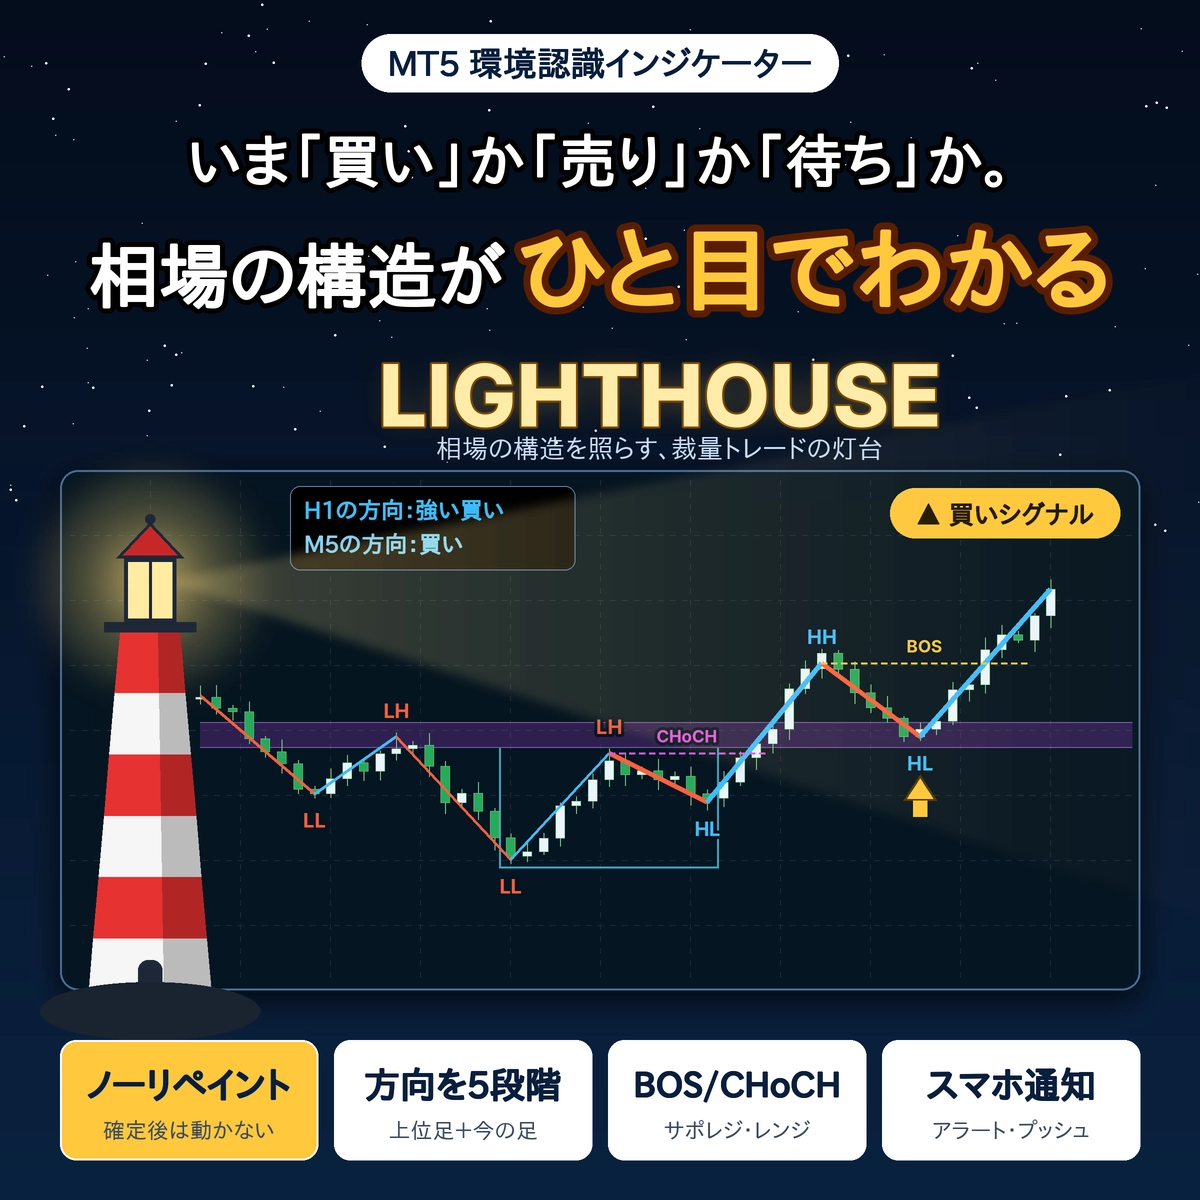
[USD/JPY on 10/26] Breaks below a three-week congestion range, heading into the week with the 156 yen level
【Key Points】 USD/JPY Market Memo for the Week Opening
・Since October beganthe range of 157.4–158.9 yen was broken to the downside on October 22.
・Last week's close was156.835 yen(about 1.16 yen lower than the previous week's close of 157.992 yen)
・The upside targets are157.1–157.5 yen, and the downside targets are156.07 yen and 156.3–156.4 yen, which are first areas of attention.
1. Recent Market Feel (Weekly, Daily, 1-hour)
Weekly: After a rally, three weeks of range
After dropping to 152.88 yen in the second week of September, it rebounded to 159.03 yen on September 24. Since then, it has remained largely flat around 157.4–158.9 yen for about three weeks, and last week closed at 156.835 yen with a high of 158.60 and a low of 156.07, effectively ending below the range’s lower boundary.
Daily: Break below the range lower bound with October 22 bearish engulfing
On October 22, a large bearish candle moved from 158.05 to 156.76 yen, closing below the range lower bound of 157.4–157.5 yen. On the 23rd, it briefly fell to 156.07 yen, briefly breaking the September 30 low of 156.37 yen, but closed at 156.835 yen, leaving a long lower shadow.Long lower shadow remains.
1-hour: Lowering of the recovery highs continues
After the 22nd drop, the recovery highs have been lowered to 157.35 yen and 157.15 yen. On the 23rd, after making a low of 156.07 yen, price moved between 156.3 and 157.1 yen for the rest of the week.
Conscious price zones (based on chart facts)
| 158.6–159.0 yen | A zone where September 24 and October highs align |
| 157.4–157.5 yen | Lower bound of the three-week range (where it broke down) |
| 157.1–157.35 yen | Recovery highs on the 22–23 |
| 156.835 yen | Last week's close |
| 156.3–156.4 yen | Low on Sept 30 / bounce on the 23 |
| 156.07 yen | Low on the 23rd |
| 152.88 yen | Low in September |
This week, monetary policy announcements from Japan, the United States, and Europe are expected to continue. Price movement tends to be more volatile around such reports, so please check the schedule on your own.
2. When viewed with the same chart in LIGHTHOUSE
From here, we will view the same USD/JPY chart with an indicator that displays the market structureLIGHTHOUSEon the chart. The content described in the “Market Feel” above is shown on the chart as an example.
Daily chart (weekly is the higher timeframe): Direction aligns to a “Sell”
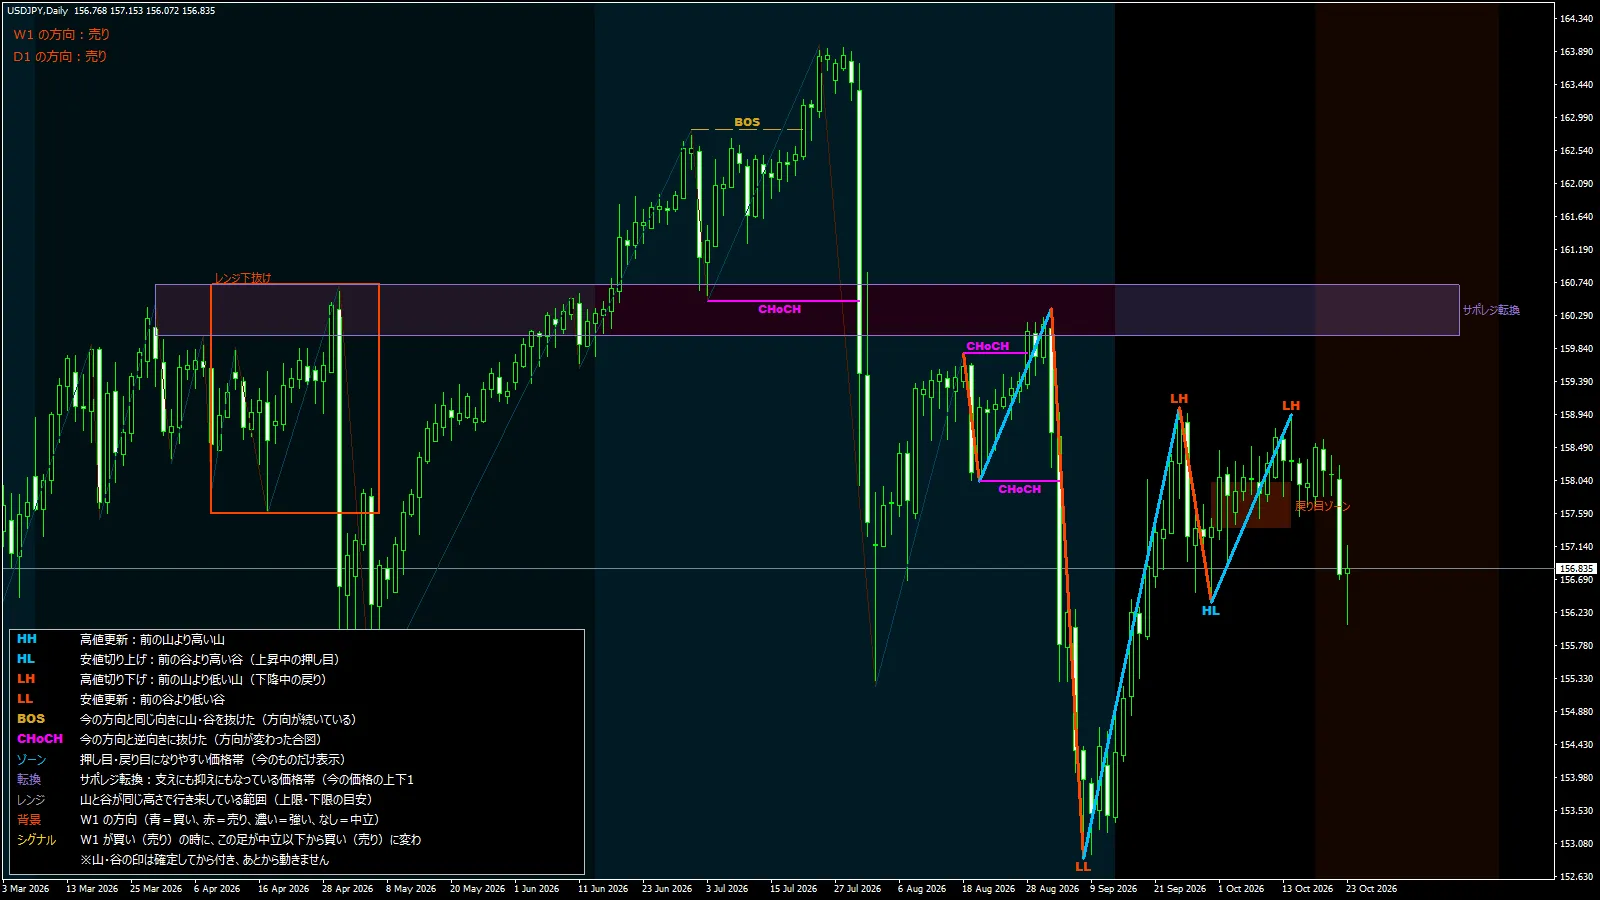
The top-left display shows “W1 direction: Sell” and “D1 direction: Sell,” aligning the weekly and daily directions. The peaks in late September and mid-October carry aLH (lower-high) marking, indicating that the recovery highs are being lowered as a signal.
Just above the current price, there isa Pullback region(in the high 157s to around 158) displayed. This area roughly overlaps with the “range lower bound” in the table above and serves as a guide for whether a rebound may occur.
1-hour chart: Lowering of the recovery highs and a top-support/resistance band
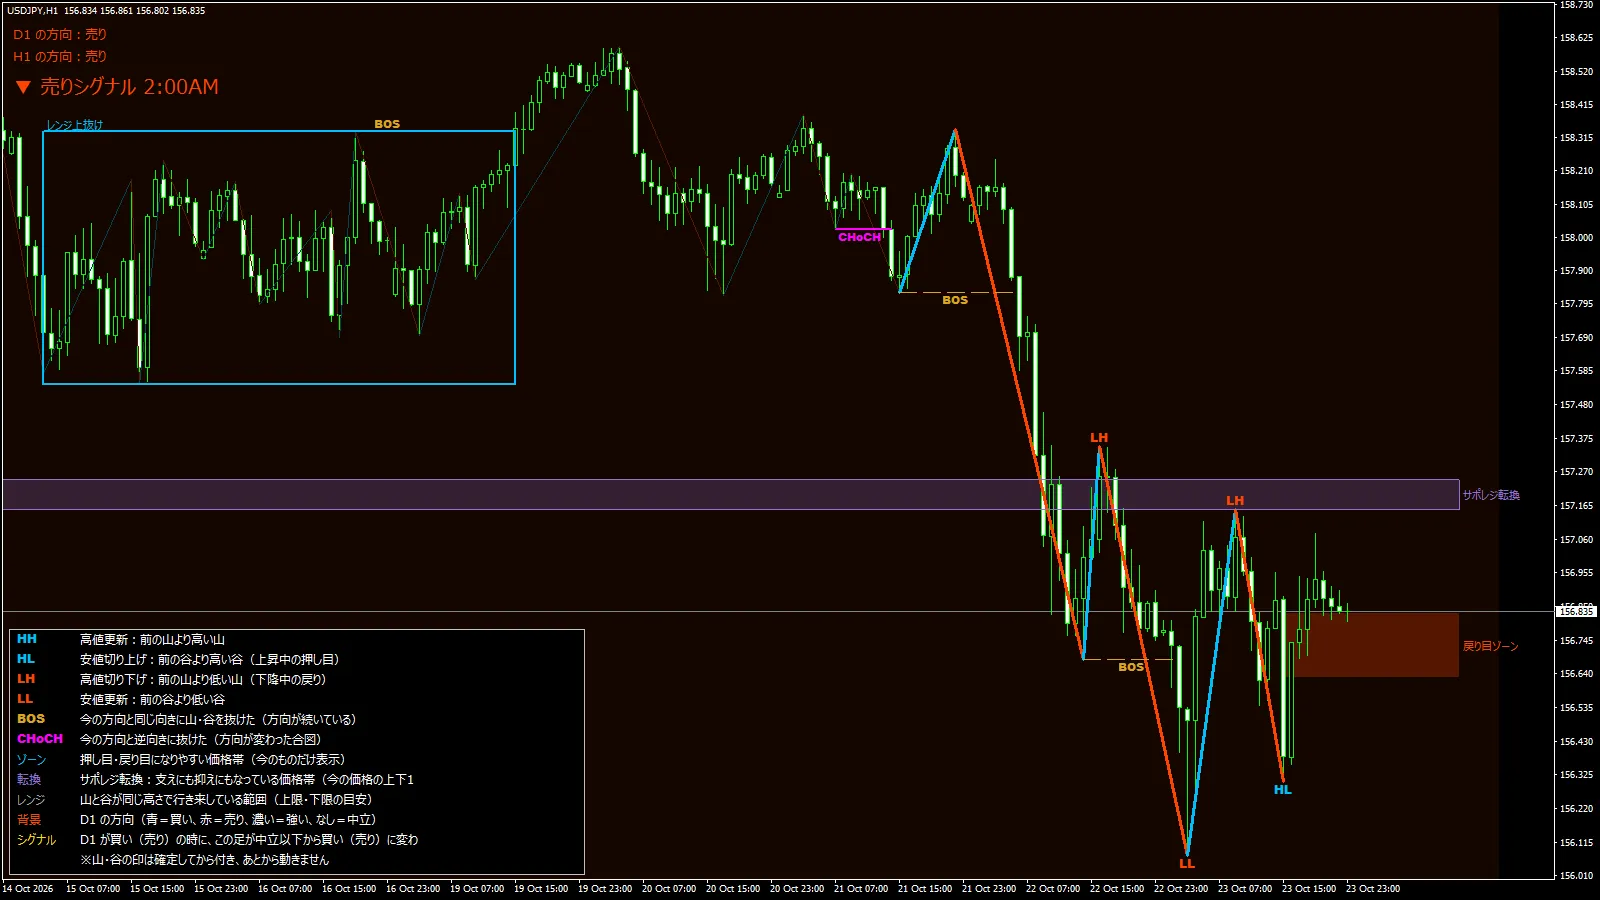
From the fall on the 22nd, the valley created on the 22nd was broken below on the 23rd withBOS(the direction continues downward by breaking the valley), and the subsequent two peaks are bothLH. The low on the 23rd is marked withLL
Above it, there isA support/resistance turning zone(around 157.1–157.25 yen). It acted as support before the drop and now acts as a ceiling for rallies; it overlaps with the “rebounds of 22–23” in the table above. On the other hand, after the 23rd low there isHL
5-minute chart: Friday close in a small range
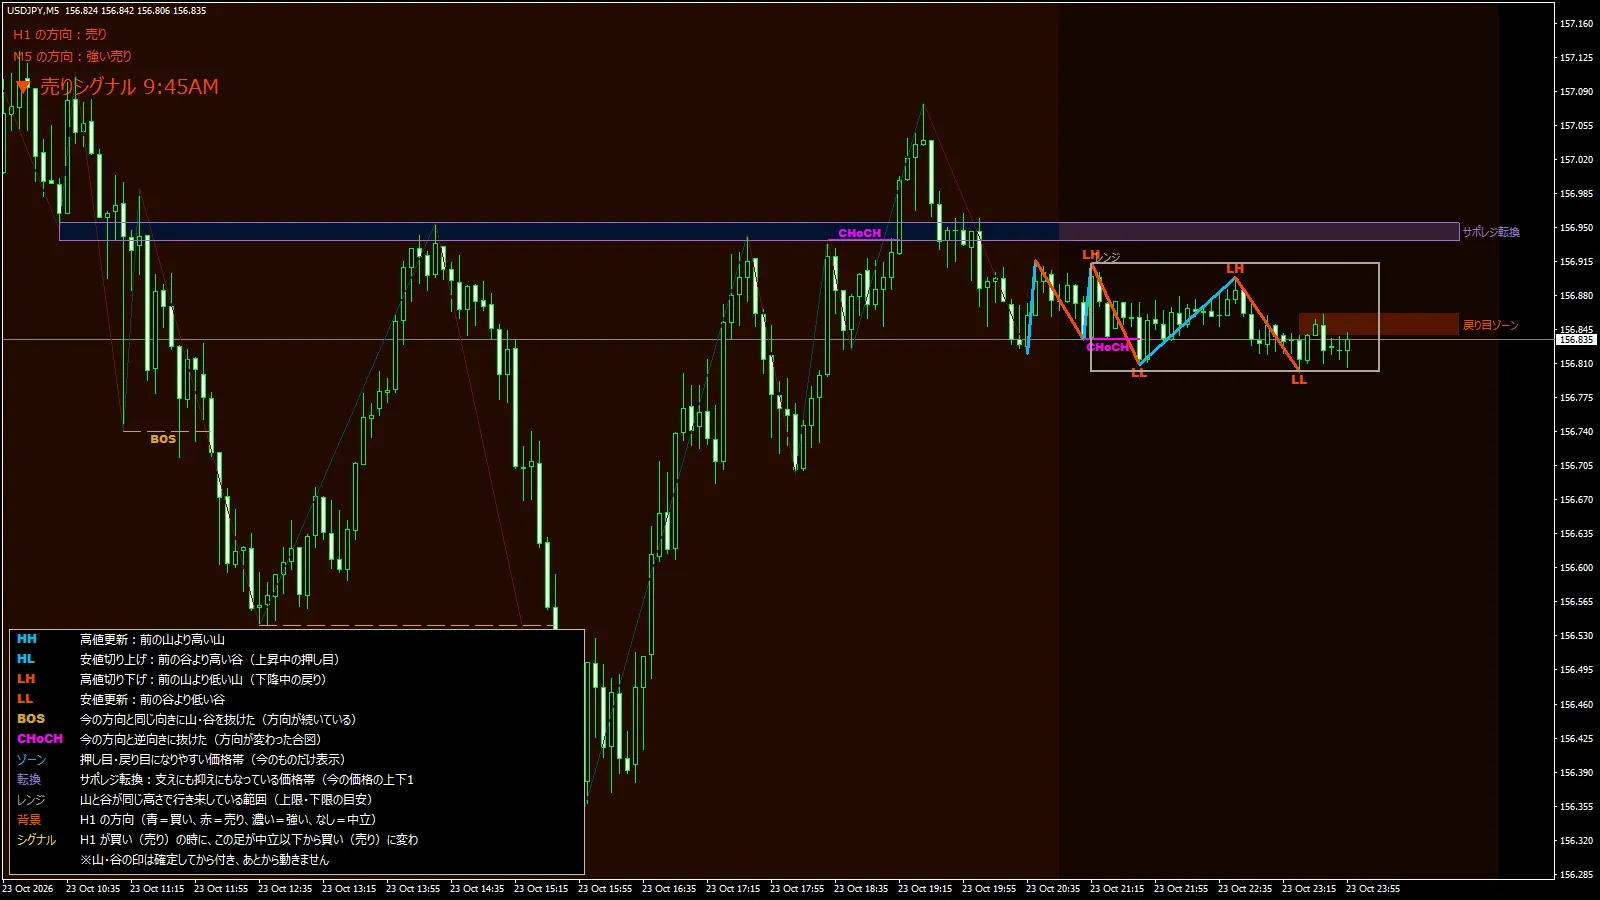
The late Friday session moved within a tight 156.8–156.9 yen range,a range box is displayed. Just above, there is a pullback-resistance turning zone around 156.95 yen. At the start of the week, the price may break out of this box in either direction, and the 5-minute directional display will switch accordingly. However, the week may open with a gap, so it is wise to observe the opening level before confirming.
Summary
On all timeframes—the weekly, daily, and 1-hour—the LIGHTHOUSE directional indicators align with a “Sell.” At the same time, the daily chart shows a long lower shadow, and the 1-hour chart shows higher lows. It seems to be a week to watch whether the market will react to the upside around 157.1–157.5 yen or to the downside around 156.07 yen or 156.3–156.4 yen.
About LIGHTHOUSE
LIGHTHOUSE is an indicator that automatically displays the chart’s “readings”as an aid to discretionary trading.
・Displays the direction of the higher timeframe and the current bar at the top-left in five steps
・Automatically shows high/low updates (HH/HL/LH/LL) and BOS/CHoCH lines
・Shows pullback/retracement zones, support/resistance turning zones, and a range box
・Marks the peaks and valleys only after they are confirmed, and they do not move or disappear later (no repaint)
・Displays the meaning of terms at the bottom-left of the chart, so you can learn as you view
Trading decisions are up to you, and this tool helps you gather the decision-making material at a glance.
・This article reorganizes past price movements and does not forecast or guarantee future price movements. Please make investment decisions at your own risk.
・Prices and dates are based on Big〇〇〇 (demo account) MT4 charts (server time). They may differ slightly depending on the broker.
・LIGHTHOUSE is an indicator intended to assist market analysis and does not perform automated trading.