
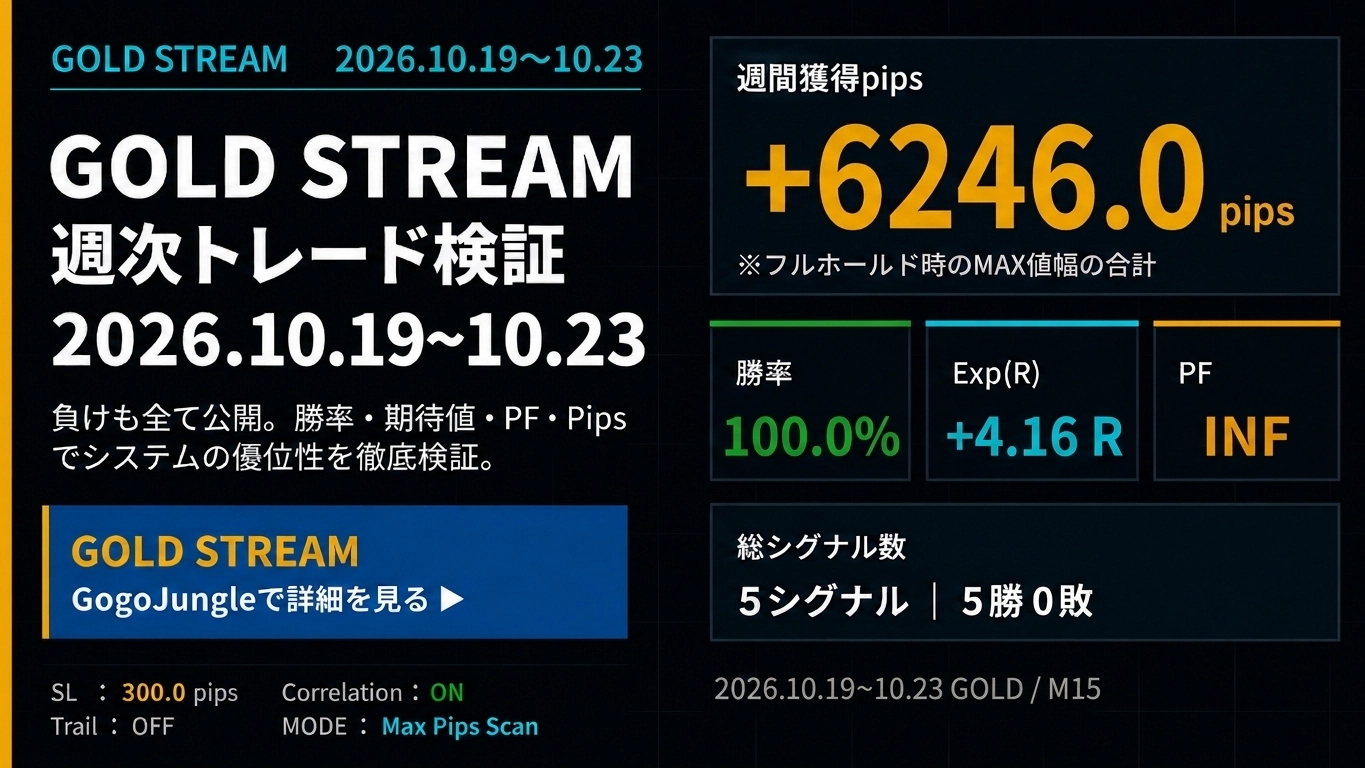
+6246pips【Weekly Trade Verification & Delivery History】GOLD Day Trade Specialized "GOLD STREAMv2" 2026.10.19~10.23
+6246pips【Weekly Trade Verification & Delivery History】
GOLD Day Trading Specialized "GOLD STREAM v2" 2026.10.19~10.24
Check GOLD’s price movement, strength, and correlations, and verify signal accuracy, price range, and expectancy weekly. Not only the win rate, but also comparisons with PF, Exp(R), and 5-day ADR to evaluate this trading environment.
① GOLD Market Analysis
1. Price Fluctuation
During the week of October 19–24, 2026, the GOLD (XAU/USD) market showed sustained strong selling pressure from the start of the week, forming a historic downtrend with rapid declines on consecutive days.
- Sharp drop from the start of the week:From the beginning, prices were heavy and powerful downward moves broke through key technical levels one after another.
- Momentum maintained in one direction:Despite brief pauses, there was no meaningful rebound, and the trend remained firmly on the short side.
- Continued large bearish candlestick through the week:Into the weekend, downside pressure persisted and a long-downtrending move was completed by week’s end.
5-day ADR was621 pipsand, while volatile, provided a clear directional environment ideal for day trading.
2. Supply/Demand & Investment Factors
Macro economy and supply/demand factors showed that interest rate trends and a strong-dollar environment directly influenced price formation for gold.
- U.S. rates and the dollar index:Rising U.S. yields and ongoing dollar buying exerted strong downward pressure on gold, an asset that does not generate interest.
- Physical demand and buyers retreat:In the face of rapid price declines, physical demand and jewelry buying paused, leaving buyers to support prices temporarily unavailable.
- Medium-to-long-term market shift:Profit-taking and panic selling of longs formed a chain at high levels, shifting the supply-demand balance quickly toward sellers.
Macro headwinds accumulated, leading to explosive downward energy over the week.
3. Investment Trends
Market participants’ investment behavior reflected a mix of following the downtrend and risk management moves.
- Position adjustments in futures/ETFs:In gold ETFs and the COMEX futures market, losses and profit-taking on long positions increased.
- Short-term traders following the trend:Using the 621 pips ADR, funds targeting short positions along the downward channel surged in day trading.
- Decline in contrarian buying:Buy-the-dip attempts near lows were repeatedly driven up, indicating a market environment where trend-reversal trades were heavily thwarted.
Those who did not fight the trend and built positions in the direction of selling held clear advantage.
4. Overall Evaluation
This week’s GOLD market wasan overwhelmingly one-way downtrend from start to finish.
With the directionality fully unified, if one could ignore noise and capture sell signals at precise timings, this week offered an exceptional opportunity to aim for enormous profit, a week full of trading potential.
⑤ SILVER / COPPER Market
SILVER
SILVER market: Silver moved in complete tandem with GOLD’s historic plunge, recording significant declines under strong selling pressure that affected precious metals broadly, with volatile, soft-moving pricing as it searched for a floor.
COPPER
COPPER market: Copper faced global growth slowdown fears and direct dollar strength, with a heavy tone on the upside. Demand risks for industrial materials were in focus, moving softly in step with commodity currency trends.
② GOLD STREAM v2 Weekly Trade Verification
Weekly verification results
③ GOLD STREAM v2 Delivery History
Weekly signal delivery history

④ Weekly Verification AI Evaluation
This time5-day ADR 621 pipsprovided an excellent range environment; we thoroughly verify and evaluate the accuracy of rejection decisions using correlation filters and the entry signals that fully capture the trend.
■ Signal Judgment and Entry Accuracy
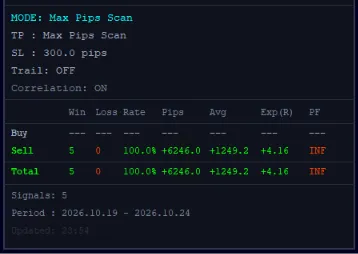
In the verification panel (2026.10.19 - 2026.10.24), the number of active signals was 5 (all Sell), and the result was5-0, win rate 100.0%— a historically unparalleled perfect record.
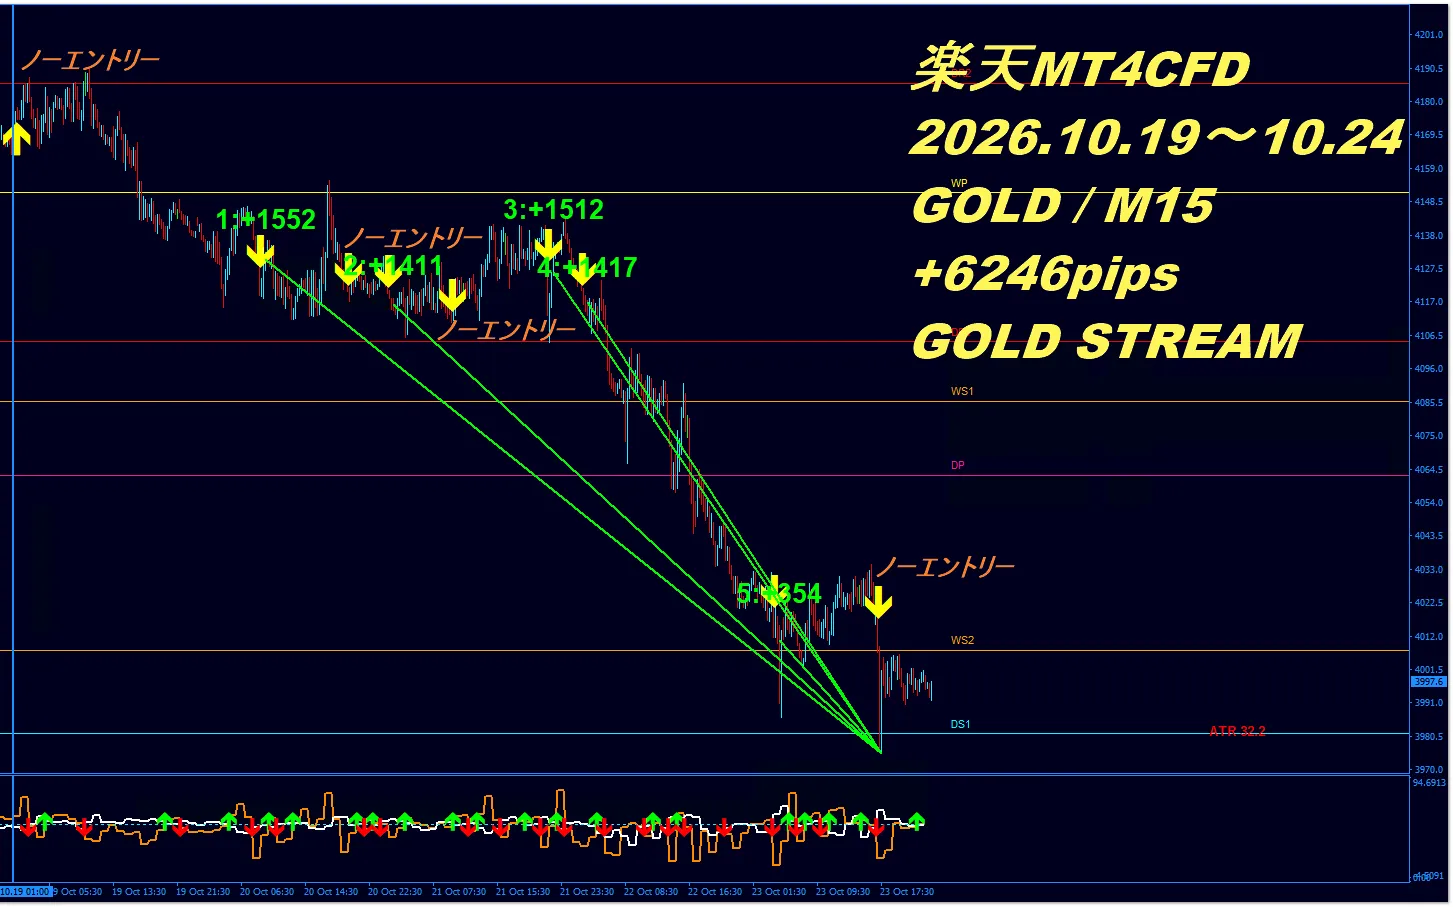
Each trade breakdown: 1st +1552 pips, 2nd +1411 pips, 3rd +1512 pips, 4th +1417 pips, 5th +354 pips, total acquired pips were an astonishing+6246.0 pips, average profit of+1249.2 pips. This fully covered the huge downward energy far surpassing the weekly benchmark of 621 pips ADR.
Also, as charted, the "No Entry" notes due to correlation mismatch worked correctly4 times, perfectly eliminating erroneous entries in trend-breaking or indecisive moments.
■ Performance by Win Rate, PF, and Exp(R)
This week's results showWin rate 100.0%・PF undefined (INF: infinite due to zero loss)・Exp(R) +4.16Rdemonstrating historically top-tier performance.
No losing trades occurred, so the profit factor is theoretically maximal (INF). Exp(R) +4.16R shows each trade yielded about 4.16 times return per risk unit (SL 300 pips) on average.This proves consistently high returns per trade in the face of risk limits.
■ Strengths, Correlation Analysis Evaluation
In a one-way plunge market, the degree of purification from the strength-and-correlation analysis (Correlation: ON) was highly precise.
The capability to reject four inconsistent signals during mid-trend reversals or noise is what created the perfect 5-0 record; the system’s risk management features were proven to be exemplary.
■ MAX Pips Scan & SL
This chart usesMODE: Max Pips Scan / Correlation: ON.
The displayed pips are the MAX value when full holding the price moves after signal generation.Therefore, +6246 pips does not guarantee actual realized profit.
Additionally, stop loss (SL) judgments are based onthe 4-hour chart. The determination is not made solely from short-term moves on the M15 chart.
■ GOLD Market Difficulty
★★★★☆ 4 / 5
Although there was excellent range (5-day ADR 621 pips), the daily rapid declines and high volatility made it extremely challenging to consistently identify correct entry points on one's own.
■ Evaluation of GOLD STREAM Weekly Trade Verification
★★★★★ 5 / 5
In a difficult sudden-down market, after correctly passing four rejection signals due to correlation mismatch,Win rate 100.0%・+6246.0 pips・Expectancy +4.16Rrepresent a flawless top-tier result.
■ AI Overall Comment
This week’s verification shows how decisively GOLD STREAM v2 dominates overall advantage. Achieving over 6,000 pips with five straight wins while correctly discarding four unnecessary entries demonstrates professional-grade system capability.
Without being swayed by emotions, would you like to make this classic day-trading approach your weapon by correctly leveraging market strength and correlation?
Get GOLD STREAM v2 now with its outstanding performance and reliability and dramatically improve your results from your next trade!
Verification data evidence
Are you having trouble trading GOLD?
“I don’t know if it’s okay to enter now.”
“I can’t decide where to close.”
“Price movement is too large; I’m hesitant to enter.”
In markets with wide price ranges like GOLD, it’s important not to rely on intuition alone, but to have a criteria for entering or staying out based onwin rate, PF, expectancy, strength, and correlationbeing checked.
GOLD STREAM v2 specializes in GOLD day trading, and strongly supports entry decisions while checking market strength and correlations.
View GOLD STREAM v2 product page Ask a questionRelated Articles
For more detail on trading philosophy and GOLD trading, click here.
- 【Video】Performance in the last 3 months | GOLD STREAM signals’ price movement from July to end-September 2026
- The one reason you’re not getting results
- Why trading ends with “steady gains and sudden losses”
- 【Tool Performance Revealed】GOLD STREAM dedicated win/loss analysis tool verification results
- Conclusion: GOLD (XAU/USD) can be traded in domestic FX accounts.
The verification results and figures published in this article are informational and based on past market data; they do not guarantee future profits or similar outcomes.
The pips and profit/loss data presented are based on the maximum price movement reached after the entry signal (MAX value) and are calculated using a fixed stop-loss (SL). These reflect the MAX value if price moves were fully held after signals and do not guarantee actual realized profits or trade results.
Actual profit and loss depend on entry/exit timing, spreads, slippage, trading costs, execution environment, position size, take-profit/stop-loss judgments, and market conditions. Also, SL judgments are based on the 4-hour chart, and results may vary with actual trading conditions.
Additionally, due to differences in trading conditions and price feeds across brokers, brokers, and trading platforms, actual prices, pip counts, profit/loss, and execution results may differ. Therefore, there may be discrepancies between published data and actual trading performance.
This data serves as reference material to verify GOLD STREAM v2’s signal edge and market analysis accuracy. Final investment/trading decisions should be made by you, considering your financial status, risk tolerance, and trading environment, and are your responsibility.