

Let's learn about the types and meanings of reversal chart patterns① [Formation Analysis Part #1]
Hello! I'm SAKU!
Everyone, do you know about chart patterns?
I think many of you already know a few, but have you ever considered why these shapes occur, not just memorizing the forms? Have you ever thought about why they take those shapes?
(Up to now I had touched on chart patterns briefly, but I realized there were no articles that explained them properly, so that's a secret)
What is a chart pattern?
A chart pattern is a shape or pattern frequently seen on charts.
Article on market fractalityAs touched upon there, on charts you often see similar price movements across different timeframes or past movements.
A chart pattern is a way of interpreting such price movements as patterns.
These chart patterns are broadly categorized into
reversal patterns(Reversal Pattern) and
continuation patterns(Continuation Pattern).
This time, first I will explain representative reversal patterns, the“Double Top” and “Double Bottom”.
Representative reversal chart patterns
We will explain representative chart patterns starting from a downward reversal pattern.
Double Bottom / Double Top
A Double Top is a chart pattern that suggests a rise is ending, formed when a price finds support near a previous high around a resistance band that is almost the same as the previous high.
A Double Bottom is a chart pattern that suggests a decline is ending, formed when a price finds support near a previous low around a support band that is almost the same as the previous low.
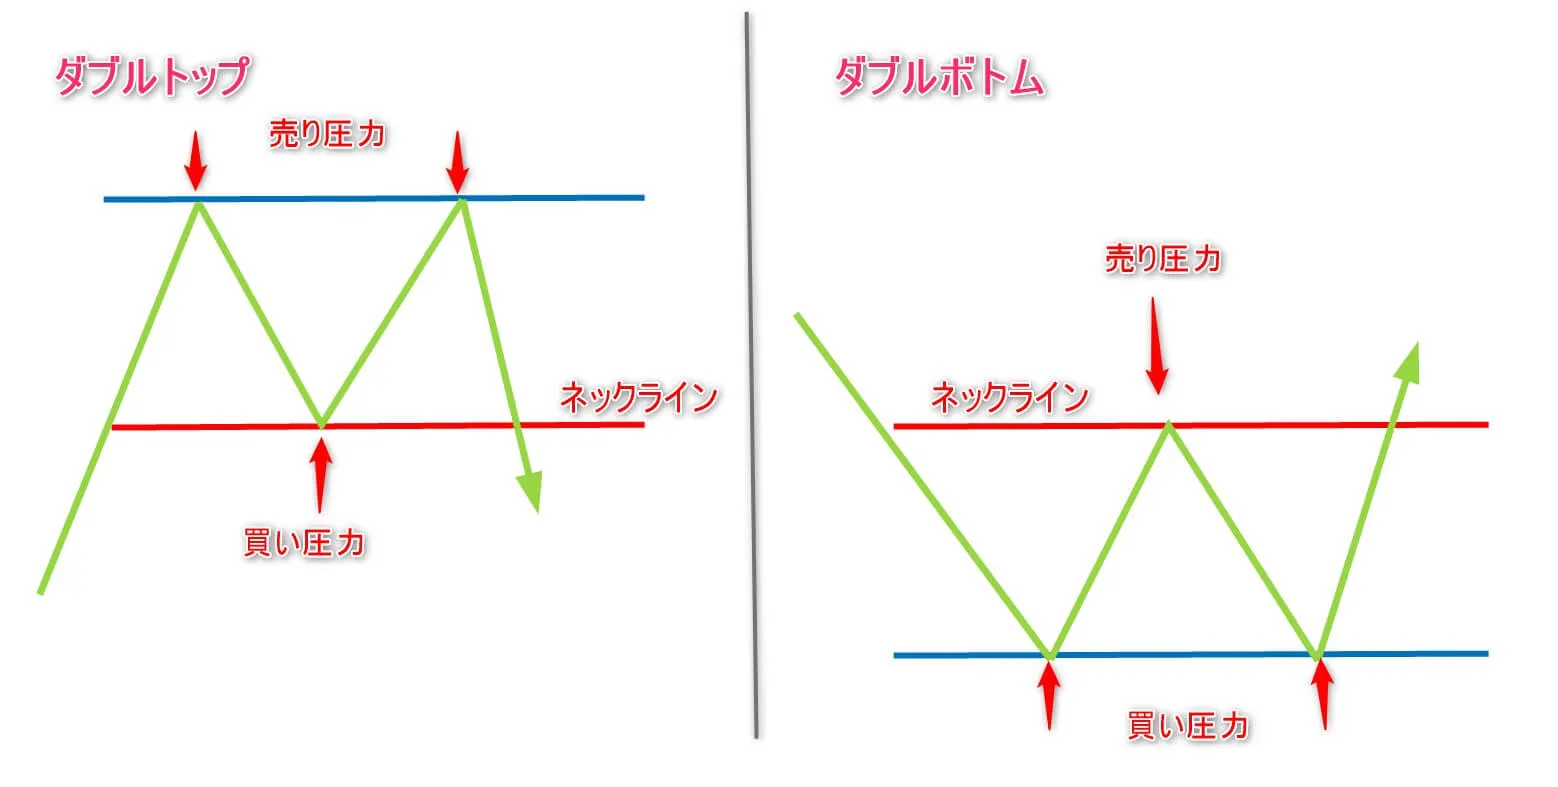
Why does a Double Bottom suggest the end of a downtrend? Because after making a low and rising once, it falls again but finds support near that low and there is not enough movement to update or continue the trend (if the low is updated, the downtrend continues), which indicates the trend strength is waning. In other words,
the first low rose due to profit-taking, but the subsequent selling pressure aiming to continue the downtrend is not very strong, or buying pressure is increasing, so the price stops without breaking the low..
It's like aiming to win a club tournament but the opponent was stronger than expected, or the team wasn't that hyped about it.
Entry examples with Double Bottom / Double Top
Entry at the Neckline
(In the case of the Double Bottom)A line drawn at the high that acted as resistance is called the neck line (the red line in the diagram below)neckline.
For an entry (buy) consideration, either when the neck line is broken, or when price returns to the neck line and finds support there (the pink circle in the diagram below).
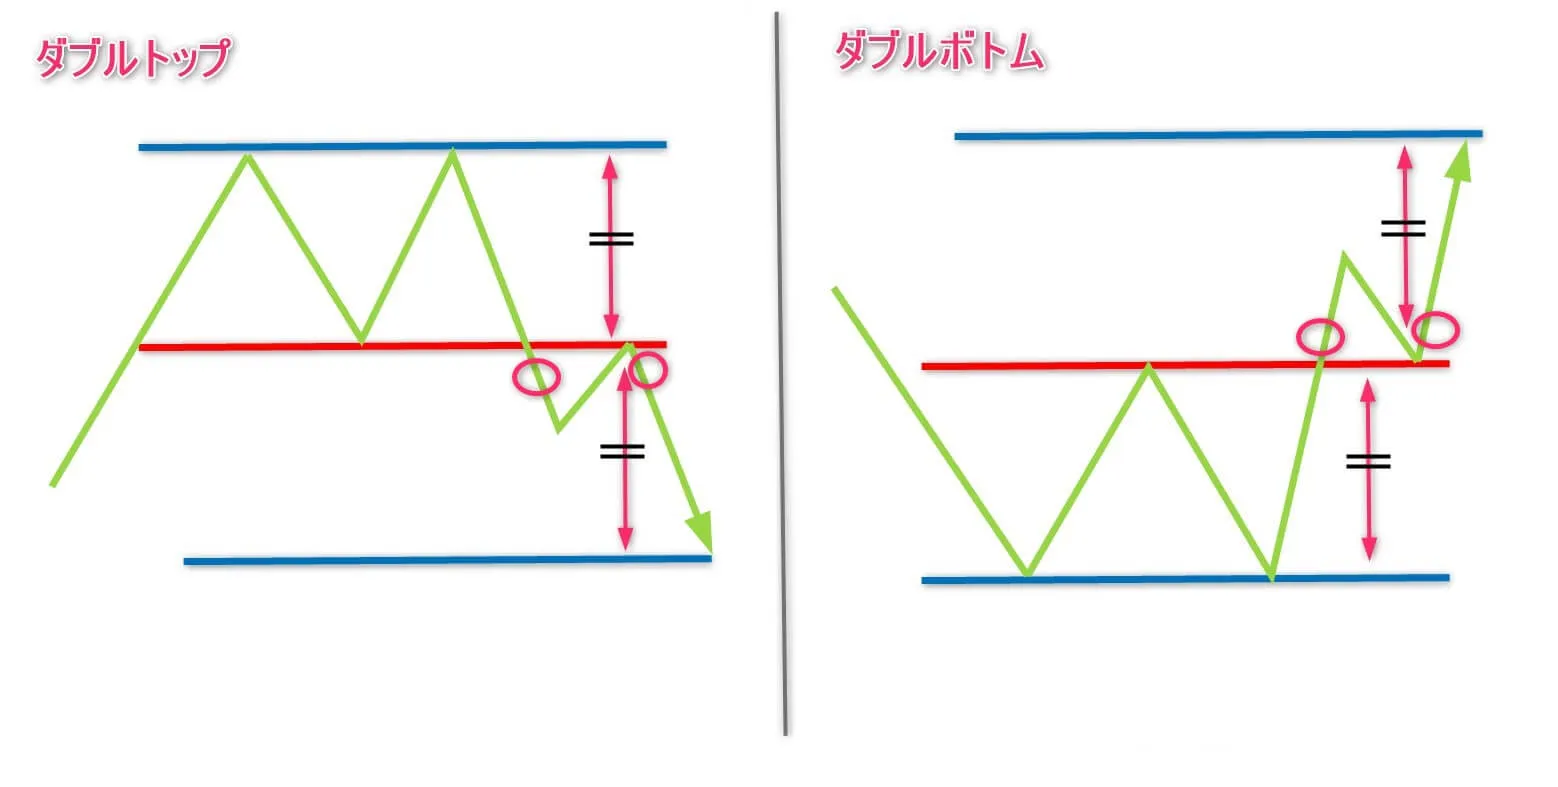
This is a buy entry aiming to trigger the rise caused by those who were selling around the neck line before they cut losses..
As a profit target for the Double Bottom, a rough target is the distance between the neck line that forms the Double Bottom and the support line.
Stop losses are generally placed below the lows.
The Double Top is the opposite of the Double Bottom and is a chart pattern indicating a rise is ending.
Entry using a trendline
If you take the same width as the Double Bottom (or Double Top) formation as the profit target and place stop just below the lows, the risk-reward ratio becomes 1:1 or worse (as in diagram ② below).
Therefore, by using a trendline to enter earlier, you can narrow the stop loss and improve the risk-reward ratio (as in diagram ① below).
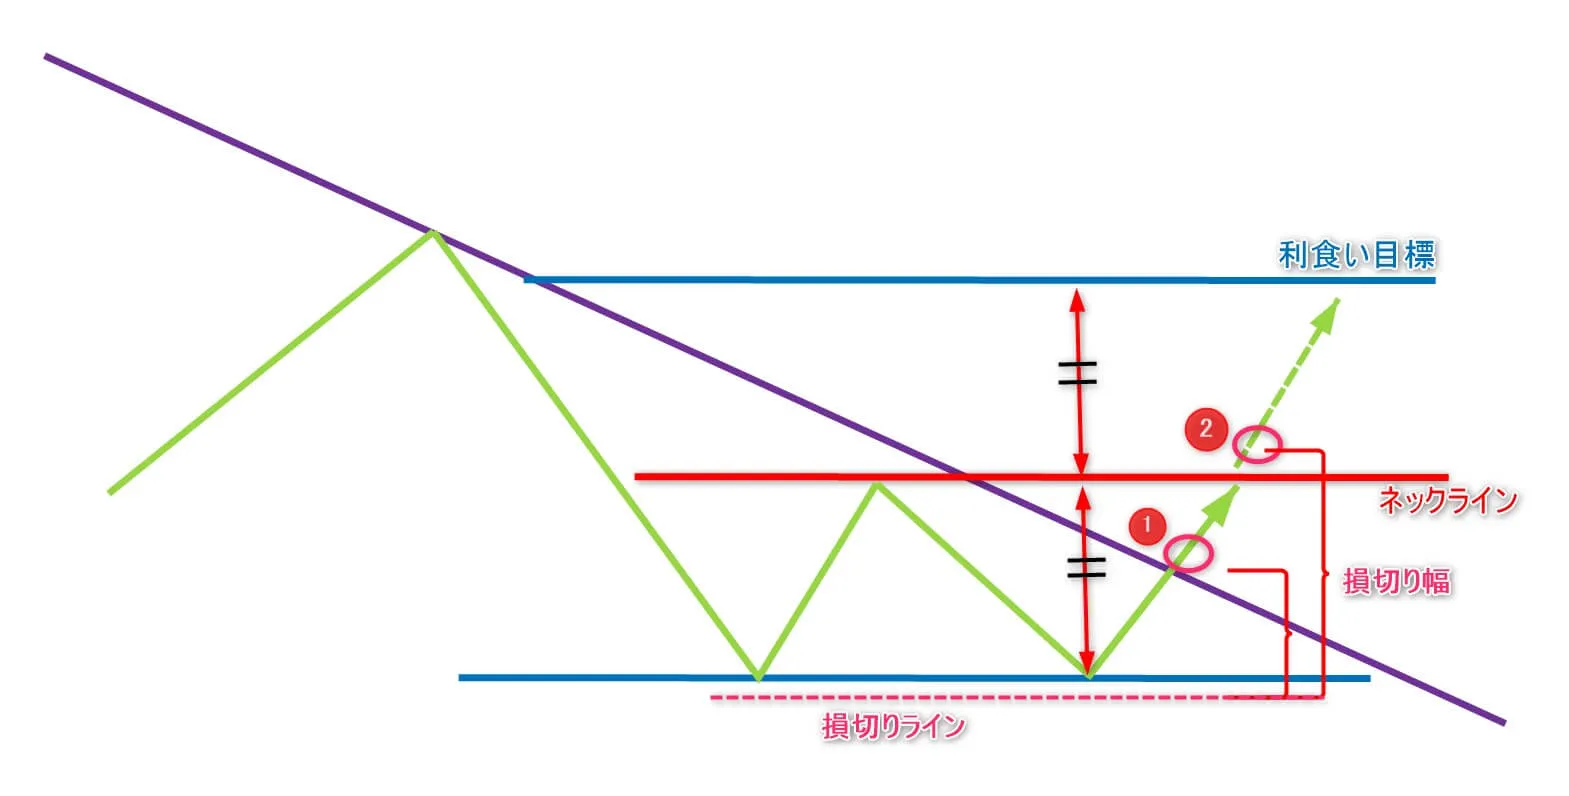
Break of the downward trendline (indicating that the momentum of the trend may be changing)
+
the lows were not updated
which forms the basis for the entry.
Note that this entry assumes a Double Top will form afterward, and whether the neck line will be broken afterward is not known at the time of entry(A Double Bottom can be said to have formed only after crossing the neck line)
Also consider taking partial profits near the neckline.
Adam and Eve types
Reversal-suggesting double tops and double bottoms can be further classified by the shape of their peaks and valleys into“Adam type”and“Eve type”.
To illustrate with a Double Bottom, the “Adam type” has a deep, sharp V-shaped valley, while the “Eve type” has a gentle, rounded U-shaped valley.
Since a Double Bottom has two valleys, it can be classified into four combinations: Adam & Adam, Adam & Eve, Eve & Adam, Eve & Eve.
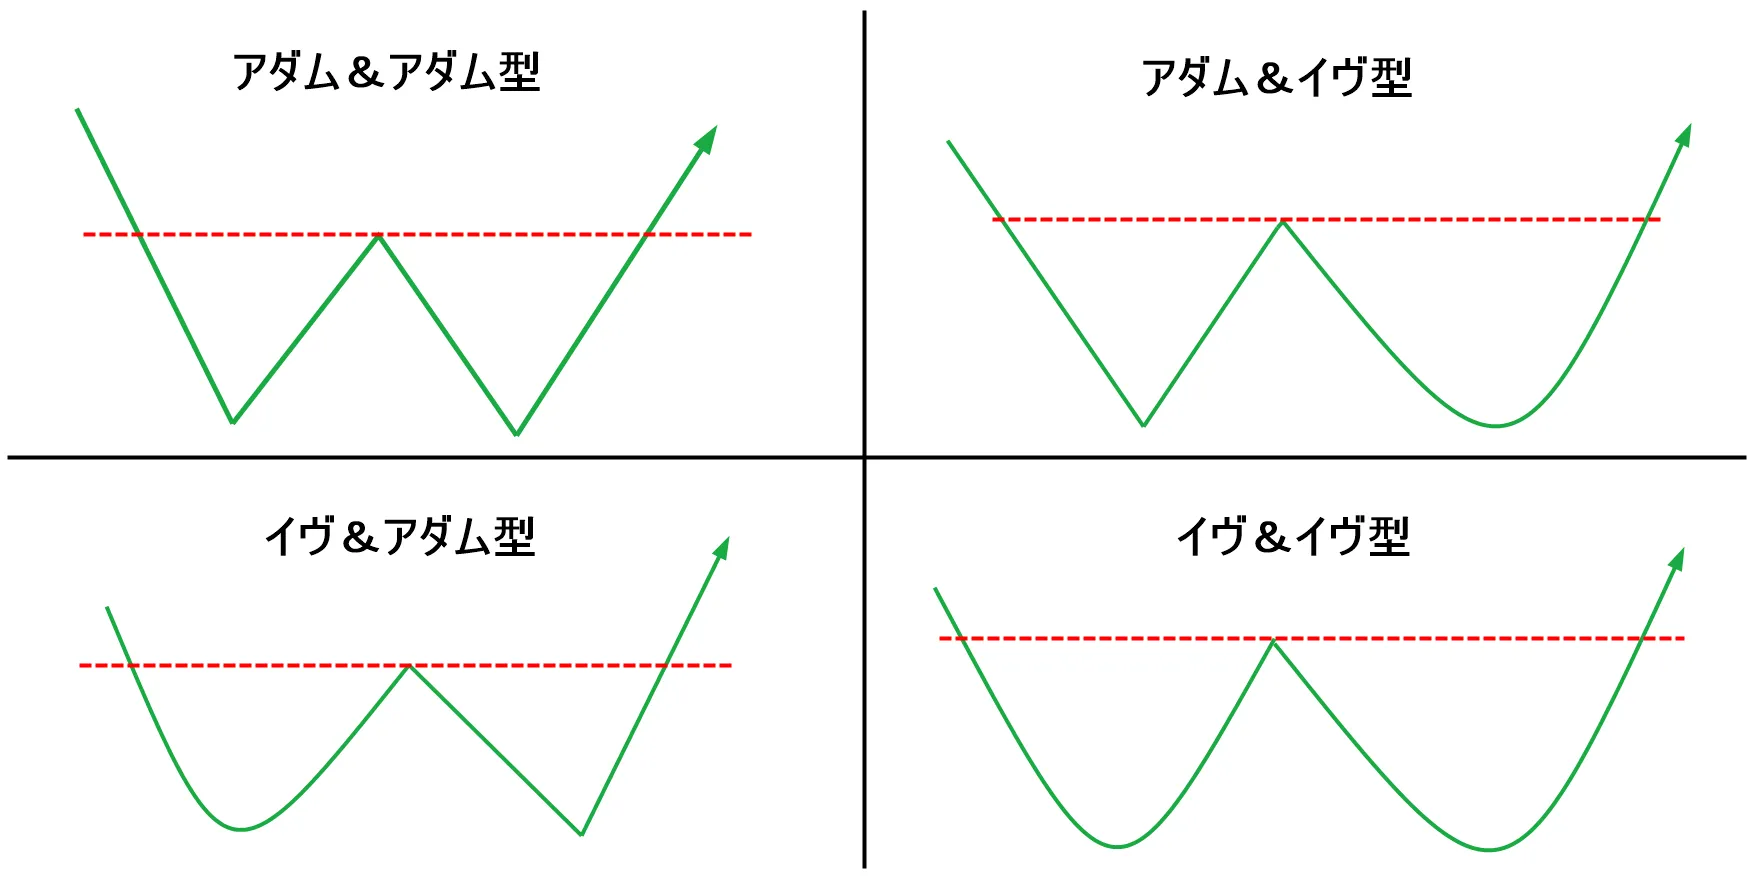
This classification was introduced in Thomas N. Burkowski’s book Trading Classic Chart Patterns. It seems not many know it because there is no Japanese translation version.
In Adam-type valleys, downward movement followed by a quick ascent is sharp and brief, whereas Eve-type movements are relatively slower and valleys form more gradually.
Generally, the Adam & Adam type is most commonly presented as a Double Bottom, but Burkowski notes that this type has the lowest performance and highest failure rate among the four.
Interestingly, the Eve & Eve type has the highest performance.
So, this time we explained “Double Top” and “Double Bottom.”
You will likely spot these chart patterns frequently while looking at charts, so please try finding them yourself!
As a caution, for chart patterns in general, merely memorizing the shapes is hardly meaningful.
When studying chart patterns, always think about what it means for that shape to form, and derive the pattern from the relationship between price movements and buying/selling sentiment!
【Limited Campaign Now On】 If you want to learn more advanced and practical trading, check this out! ↓
For those who want to learn line analysis and multi-timeframe analysis, click below↓

→MTF Multi-Time Frame Analysis Essentials (There is also a free trial version)
【Campaign valid until 11/1 (Sun)! Limited time】
For methods such as candlestick price action and volume analysis, check below↓

→【First-come, first-served public release!】 MMS Trading EncyclopediaThe truth behind the “structural traps” that individual investors fall into and market microstructure analysis to glimpse large players’ footprints (There is also a free trial version)