
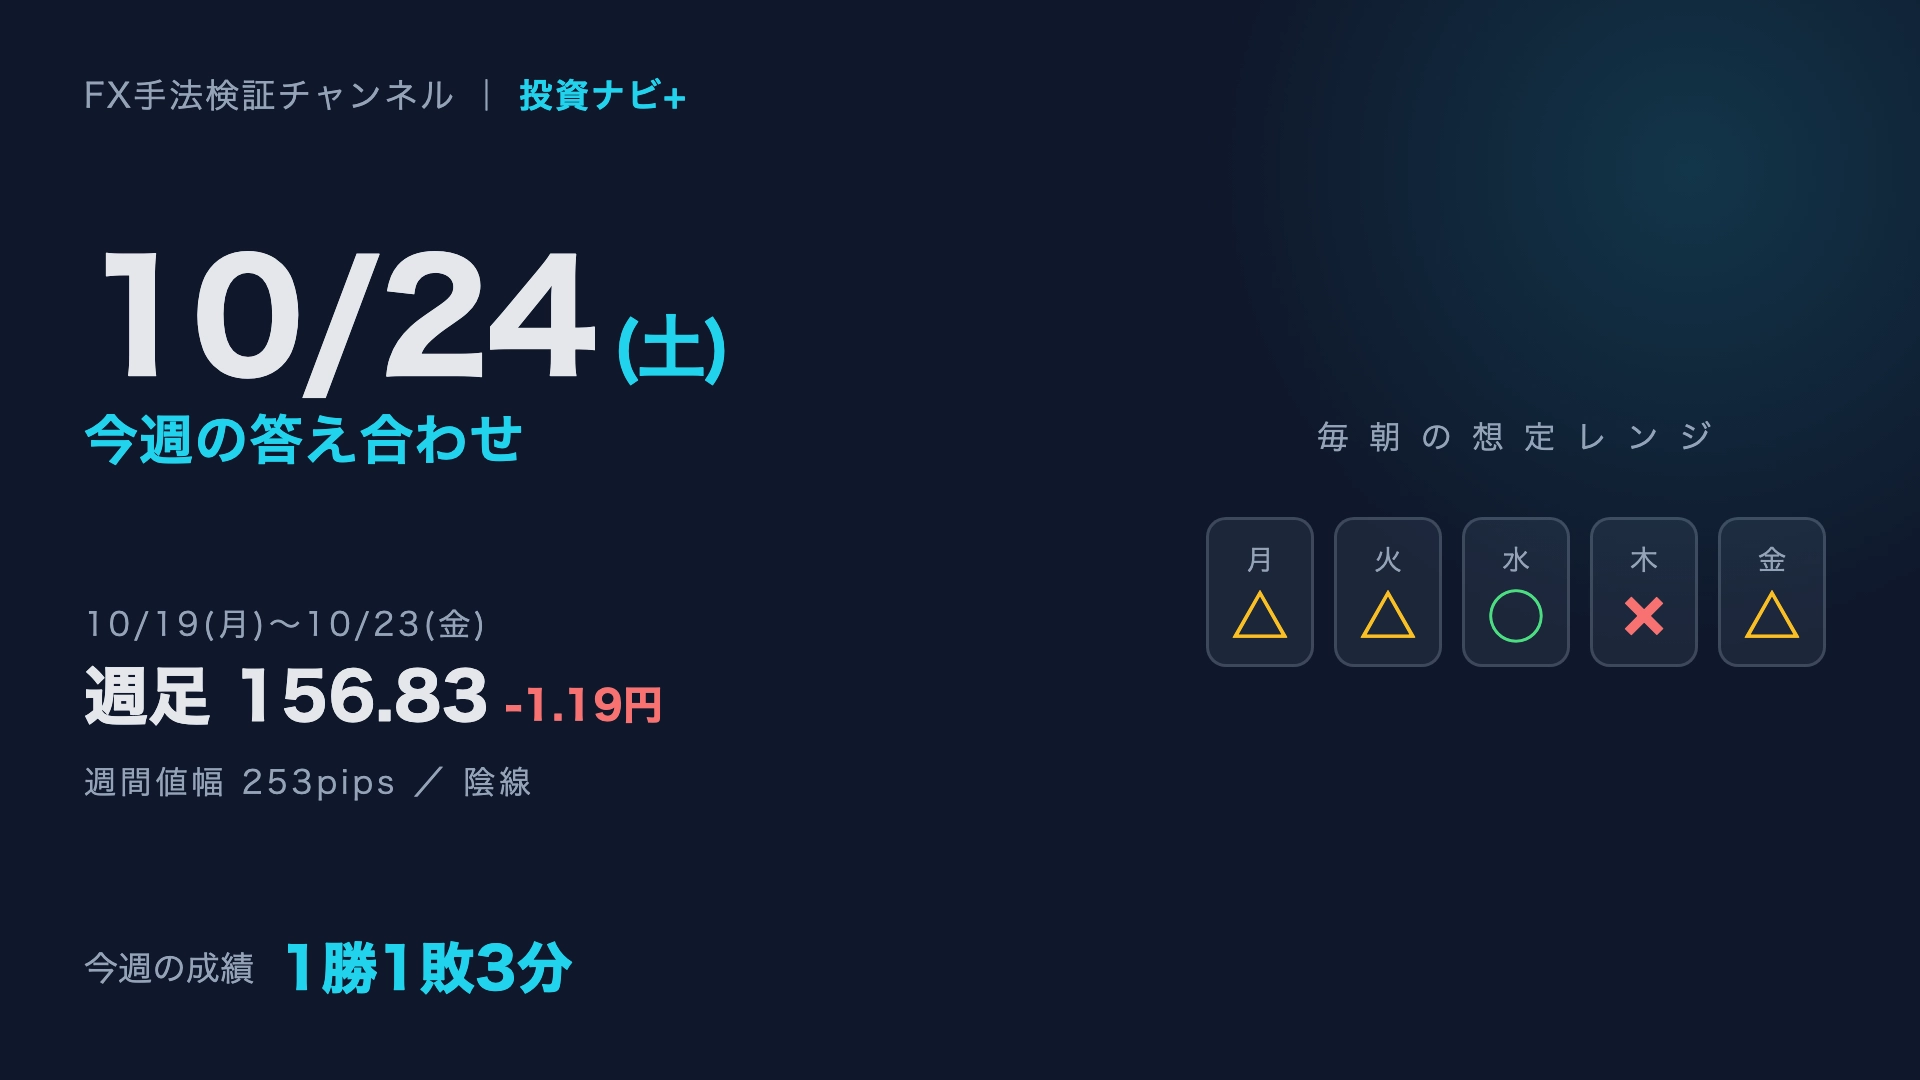
【10/24 Sat】This week's answer check|Close at Weekly 156.83・1 win 1 loss 3 draws
This is the record for 10/19 (Mon) to 10/23 (Fri). The weekly close was at 156.83 (down 1.19 yen from the previous week), and the weekly price range was 253 pips, forming a bearish candle.
Monday started with a 10.7-pip gap down and filled it within the day.
I will summarize how accurately the expected daily ranges hit over one week each morning.
First, in 60 seconds | This week’s answers

This week’s performance
| Date | Judgment | Content |
|---|---|---|
| 10/19 (Mon) | △ | Temporarily pierced above the range ceiling, but the close of 158.53 remained inside the range |
| 10/20 (Tue) | △ | Temporarily fell below the range floor, but the close of 158.17 returned to within the range |
| 10/21 (Wed) | ○ | The close at 158.13 ended within the assumed range of 157.83–158.85, as expected |
| 10/22 (Thu) | × | The close of 156.76 broke below the assumed range of 157.74–158.67 |
| 10/23 (Fri) | △ | Temporarily breached the range floor, but the close of 156.83 returned inside the range |
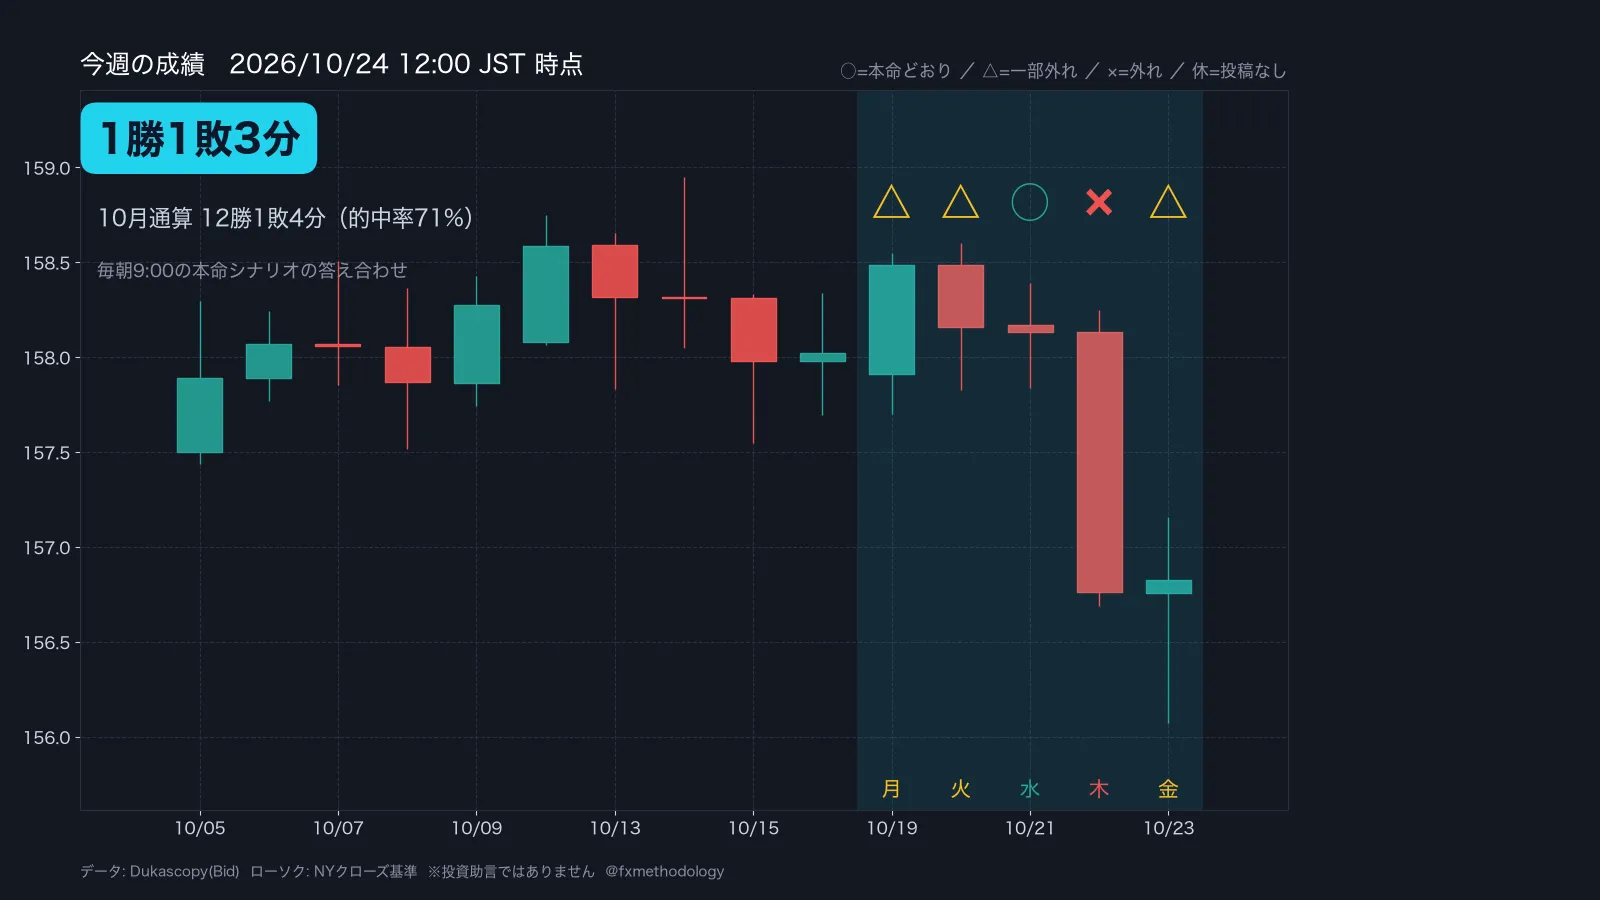
Mon △ Tue △ Wed ○ Thu × Fri △. This week was 1 win, 1 loss, 3 draws. The three △ signs in a row occurred because there were several days when we briefly left the range but closed back inside. For October overall: 12 wins, 1 loss, 4 draws (accuracy 71%).
This week viewed on a weekly chart
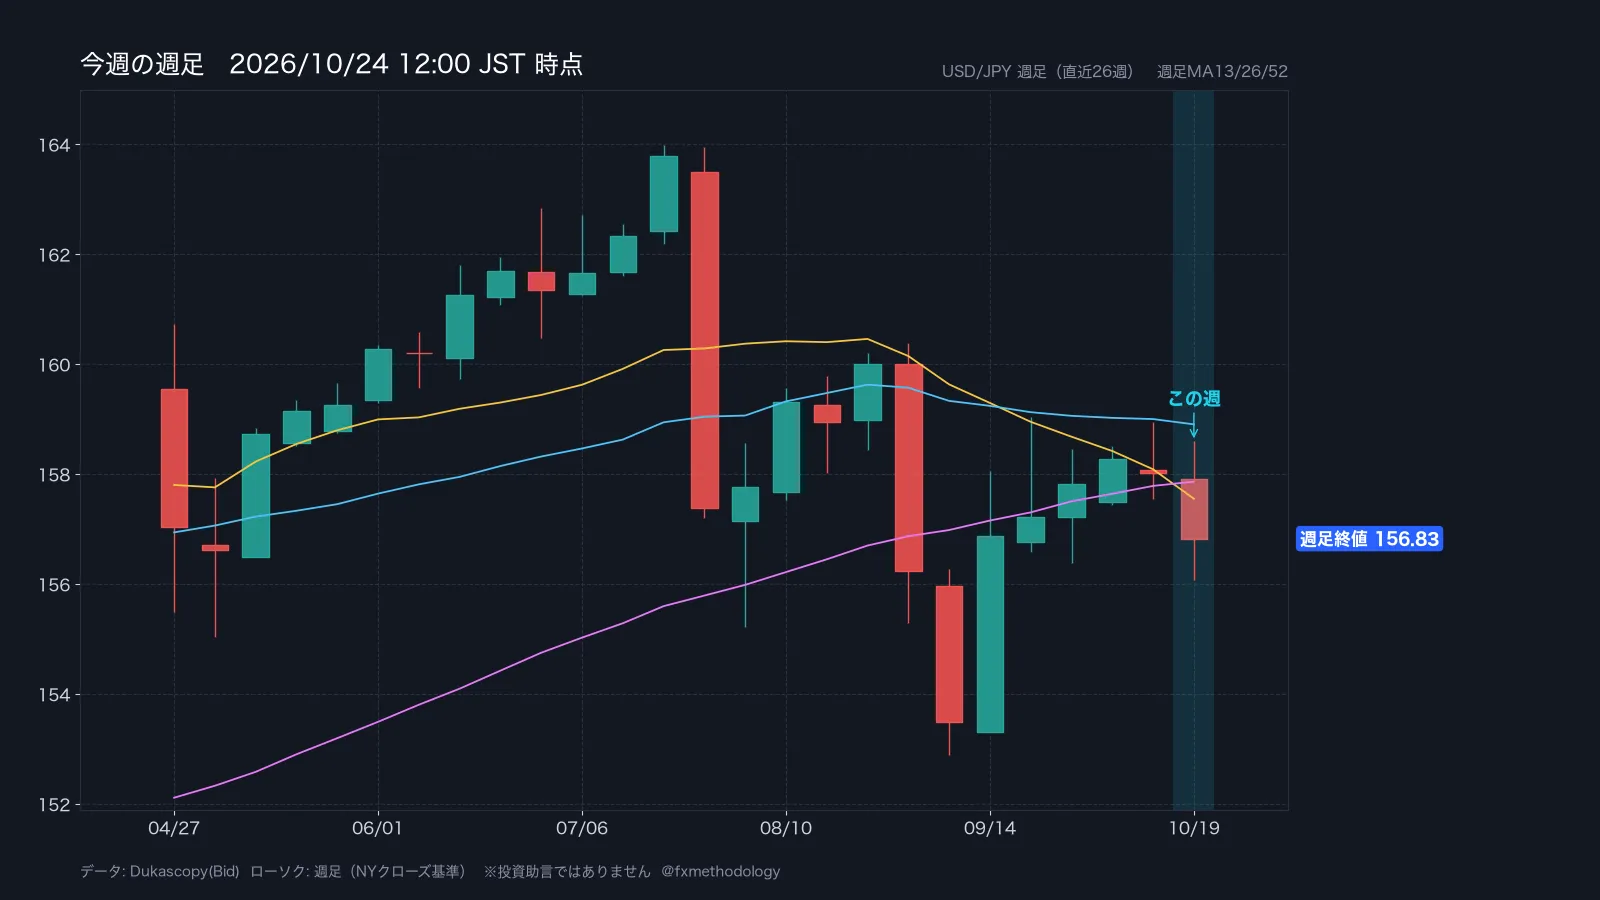
Open157.91High158.60Low156.07Close156.83
Week-on-week change-1.19 yenWeekly range253 pipsCandlestickBearish
Results of readers’ predictions
Last Sunday’s poll (4 votes) was: “Up” 25% · “Nearly flat” 50% · “Down” 25% → Result: -119 pips, “Down.” The majority was the nearly flat camp, so the minority won. Tsuji’s weekly scenario was △; during the week there was one move below the range, but the Friday close of 156.83 returned inside the range.
The day with the most movement this week
Thursday, 10/22. A bearish candle spanning 156 pips, from 158.13 down to 156.76. The time around 21:30 for the US initial jobless claims (★2) is thought to have triggered it.
IMM Yen Position
Speculators’ net long in the yen increased by 70,000 contracts (an expansion of 20,000 contracts from the previous week). Within the past year’s range, it remains more long than not. The same direction as the weekly trend toward a stronger yen is worth watching for in the coming weeks.
Validation data
The weekly chart has shown two consecutive bearish candles. In 90 cases over the past 10 years where this pattern occurred, the following week turned bullish 68% of the time. However, a collapse after a series of losses is a matter of frequency, and does not guarantee the extent of the move, so I’m viewing that separately ^^;
Today’s question
How did you perform this week? I’d be happy if you tell me the number of days that turned out as expected, rather than just wins or losses.
In tomorrow’s 17:00 “Strategy Meeting,” I’ll deliver next week’s key indicators, weekly scenario, and Monday’s gap forecast.
If you’d like, please like or comment.
That’s the week’s records. A compilation of the tools used for the validation is here.Tsuji @ FX Method Validation Channel
This regular observation is posted every weekday morning and on weekends. Follow to receive new updates.Author page of Investment Navigator+


※Validation uses USD/JPY 1-hour data from January 2016 to March 2026. It does not indicate future performance.
Indicator data: Based on Forex Factory / Tradays with independent editing; Price: Dukascopy (Bid)
※This is Tsuji’s personal view. Please make investment decisions on your own.