

Profit and Loss Report Approximately 52.08 million Japanese Yen in Value — Latest Operational Report from KGS Early Users
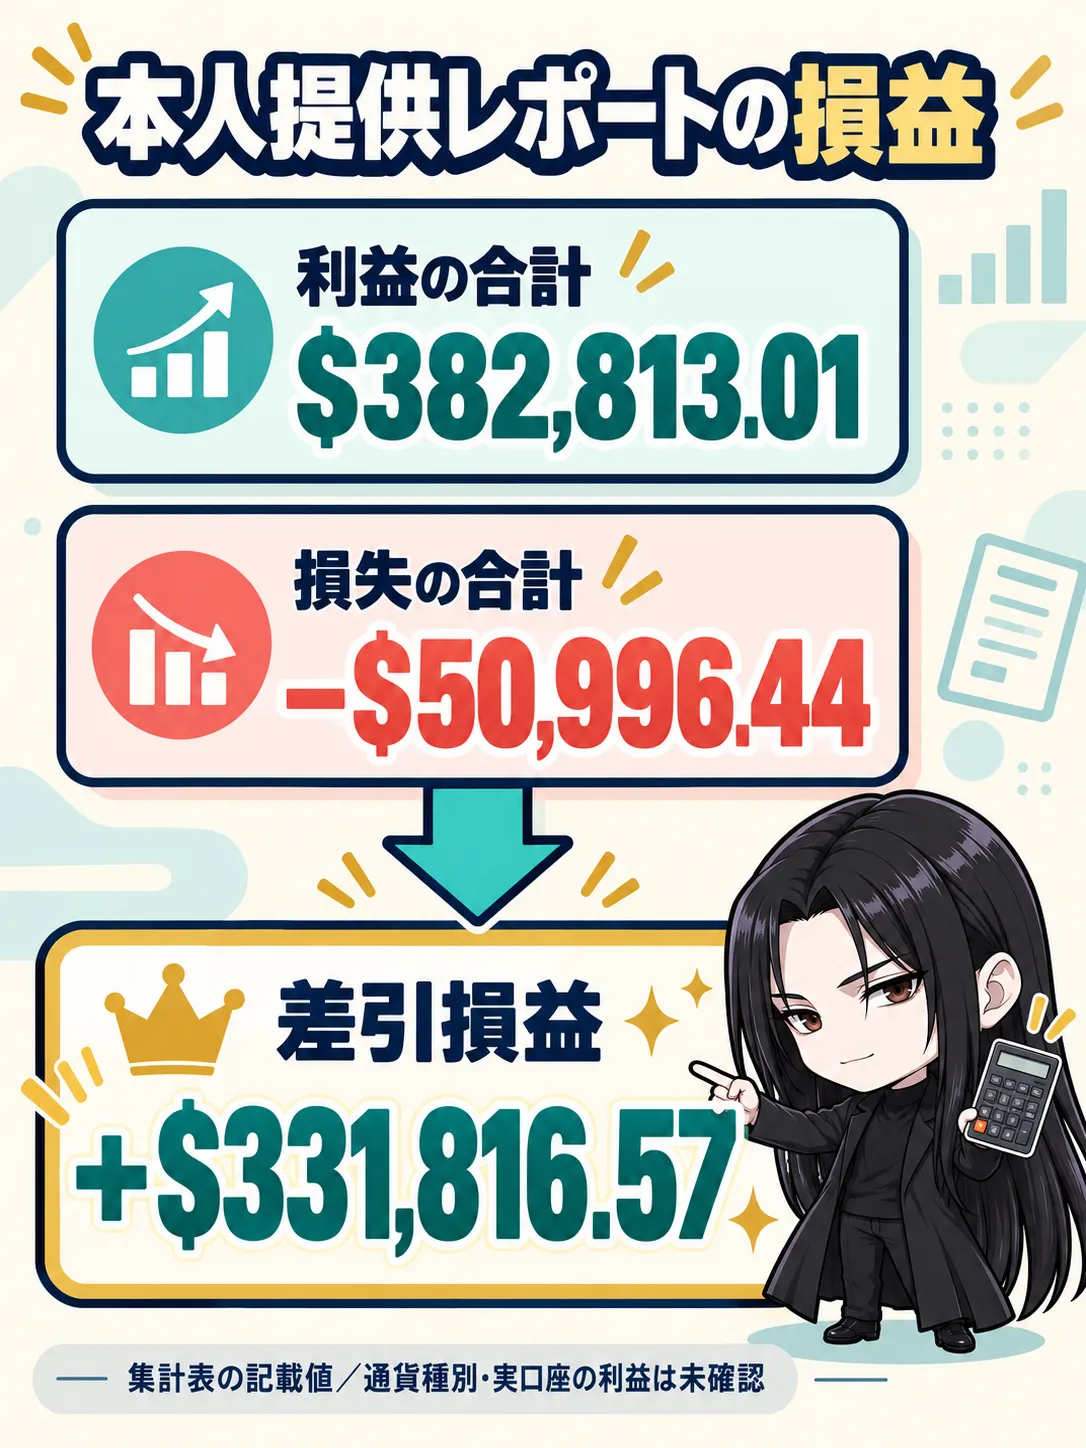
Net profit and loss is +$331,816.57 according to the summary sheet.
We have received a new operation report from Jose Casas, the initial user previously introduced for KGS. This amount is listed in the column that subtracts losses from the total profit.
*These figures are from a personally provided summary sheet. Amounts are in US dollars, and confirmed profits on actual accounts have not been verified. The note in parentheses in the diagram states that the currency type is unconfirmed at the time of creation.
As a developer, I’m happy to receive further reports from people I previously introduced. This time, continuing from the previous article, I will introduce the summary sheet provided by the person.
01|That user I mentioned before
Last time, the user reported 32 entries in one week, with 30 wins and 2 losses. This time, I cover the follow-up from that initial user. The past numbers were published in the previous article, and they may not be directly comparable under the same conditions as this table.
02|Here is the operation report received this time
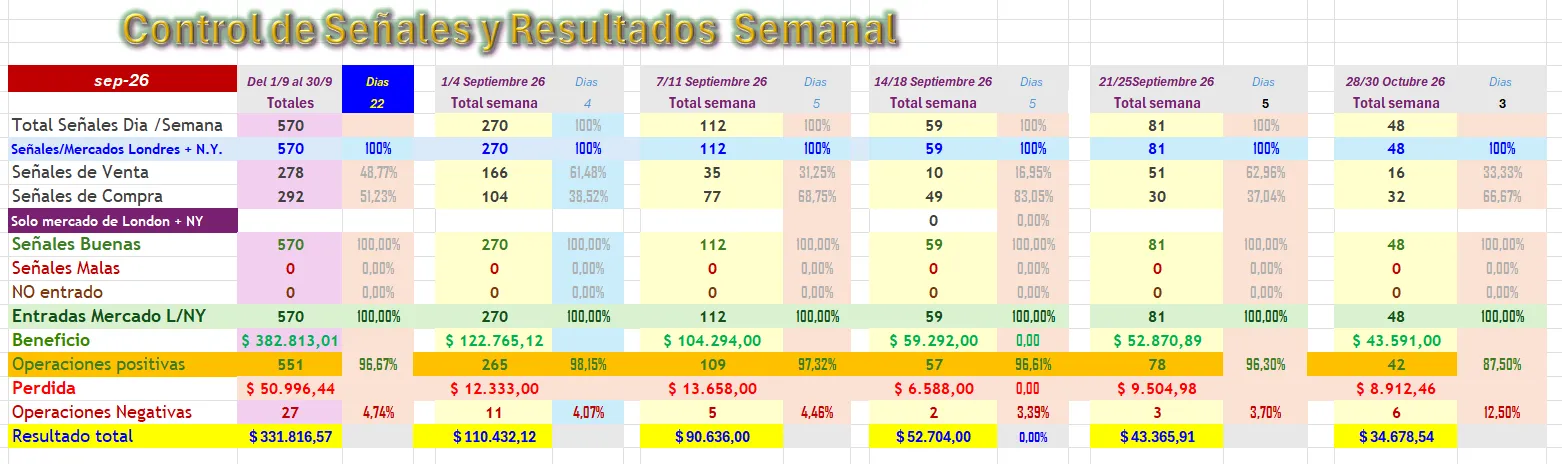
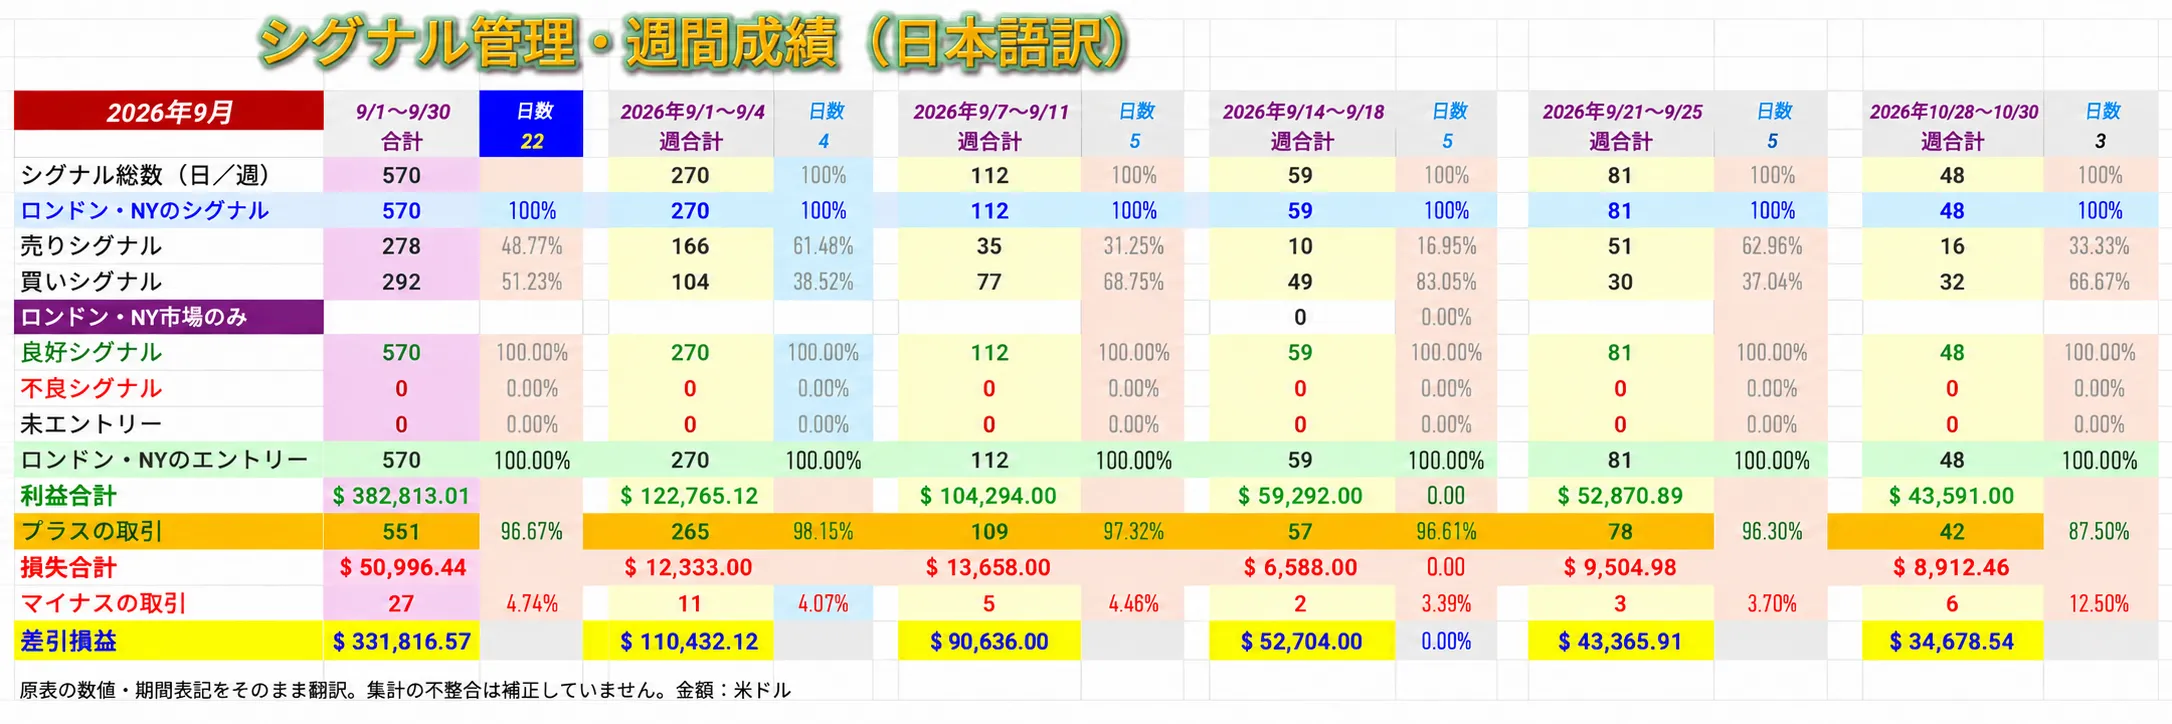
Below is the summary sheet received from the person. It is not a reconciliation with the broker’s account statements here; it is published as a report from the user.
03|Clarifying the profits and losses listed in the table
| Items from the personally provided table | Amount (USD) |
|---|---|
| Total profit | $382,813.01 |
| Total losses | $50,996.44 |
| Net profit/loss | +$331,816.57 |
$382,813.01 − $50,996.44 = +$331,816.57
In other words, the table shows a positive amount of 331,816.57 (in dollar notation). Rather than presenting the large total profit as the result, it shows the figure after deducting losses. In Japanese yen, this is equivalent to about 52.08 million yen.
331,816.57 USD × 156.96 JPY = 52,081,928.83 JPY. This is a reference conversion using the middle value of the Bank of Japan’s USD/JPY quotation at 17:00 on October 23, 2026 (156.95–156.97). This is not the actual yen amount or the profit and loss at that time; it can vary with exchange rates and fees.
The bottom row “Resultado total” in the table shows plus entries in all five weekly sections listed. Also, not only profits but also losses and negative trades are included in the table.
However, there are unstated assumptions in the summary. The entire table is labeled September, but the final column is October, and there is a discrepancy between the total of 570 entries and the sum of 551 profitable trades and 27 losing trades.
The real/demo distinction, principal, lot size, trading costs, and maximum drawdown cannot be verified from this image alone.
Therefore, the win rates and amounts written in the table should not be taken as the proven performance of KGS in dollars. What I want to convey this time is that there is an update from the initial user with new records.
04|What I want you to look at is not just the profits
When you look at the performance image, big numbers inevitably stand out. But if you want to use this for your own trading, chasing only the profit amount may not be the right approach.
Reflect on these four things.
- What situations you entered
- What situations you skipped
- Whether you could keep your planned stop-loss
- Whether you could reflect in the same standard regardless of win or loss
Even using the same indicator, results vary depending on trade size, judgment, and how you exit. Rather than aiming for the same amount as others, you should first be able to explain how you actually use it. Recording it thus has meaning.
05|Using KGS as a tool to reflect on your decisions
KURAMA GOLD SIGNAL PRO is an indicator to assist in gold trading decisions. We hope you use its signals and take-profit/stop-loss guidelines as material for judging your chart analysis.
What matters is not to end with just looking at the signal. If you leave the chart at entry and the reason for the exit, you can later review your own decisions.
For profitable trades, check whether you followed reasonable lot sizes and rules. For losing trades, check whether you kept your planned stop-loss.
I don’t want to claim that this report will make everyone achieve the same results. For those considering KGS, please use it together with reports from actual users to see whether you can organize your own judgments as a tool.
06|For those who want to learn not only the indicator but also my method
If you want to learn how I view the chart in addition to the signal, I recommend the full set including MA method教材 and personalized coaching. It is prepared for those who want to learn the tool and the approach together.

If you can send the chart image along with where you entered and where you hesitated, it makes it easier to share your situation than a text-only consultation, and I can give more concrete advice. Not only winning moments but also skipped and hesitated moments become materials for consultation.
If you want to try KGS or want to organize your own judgments while using indicators, please check the content on the product page below.
 KURAMA GOLD SIGNAL PRO
 【Develop into a skilled trader】GOLD×USD/JPY Indicator +教材 + personalized coaching
※The content shown is from reports by a specific user and does not constitute third-party verification of trading history or guarantee of performance. It does not represent average results for all users.
Profit or win-rate restoration is not guaranteed, and there is a risk of losing principal in FX/CFD trading.