
+6246pips【Weekly Trade Verification & Delivery History】GOLD Day Trading Specialized Type 「GOLD STREAMv2」2026.10.19~10.23
+6246pips【Weekly Trade Verification & Delivery History】
GOLD Day Trading Focused "GOLD STREAM v2" 2026.10.19~10.24
Review GOLD's price movement, strength, and correlations to verify signal accuracy, price range, and expected value each week. Not only win rate but also PF, Exp(R), and 5-day ADR comparisons are included to evaluate this week's trading environment.
① GOLD Market Analysis
1. Price Movement
For the week of October 19–24, 2026, GOLD (XAU/USD) traded under a historically strong selling pressure from the start of the week, forming a downtrend with steep declines on successive days.
- Early-week plunge:From the start of the week, prices moved lower, breaking through key technical support levels one after another, creating a powerful down move.
- Momentum to the downside maintained:Despite brief pauses, there was no buying interest, and the market remained biased toward the short side.
- Long weekly bearish candlestick formation:Into the weekend, downside pressure persisted, completing a long downtrend by week's end.
The 5-day ADR recorded621pips, indicating high volatility yet a clear directional environment favorable for day trading.
2. Demand/Supply & Investment Factors
Macro economy and supply-demand dynamics showed that interest rate trends and a strong dollar directly influenced gold pricing.
- U.S. yields and the dollar index:Rising U.S. Treasury yields and a strengthening dollar exerted substantial downward pressure on gold as a non-yielding asset.
- Physical demand and buyer retrenchment:In response to rapid price declines, physical market demand and jewelry buyers pulled back, leaving intermittent support buyers absent.
- Medium- to long-term trend shift:Profit-taking and capitulation on long positions formed at higher prices, quickly shifting supply-demand balance toward sellers.
Macro headwinds created explosive downside energy over the week.
3. Investment Trends
Investor behavior reflected a mix of following the downtrend and risk management moves.
- Futures/ETF position adjustments:Gold ETFs and COMEX futures saw losses and closing activity on existing long positions.
- Short-term traders following the trend:Using a 621pips ADR, funds for day trading increased as shorts aligned with the downward channel.
- Culling contrarian buys:Buy efforts aimed at rebounds near lows were repeatedly stopped out, making trend-reversal bets difficult to sustain.
Investors who stayed with the downtrend and built positions on the short side gained clear edges.
4. Overall Assessment
This week's GOLD market was characterized by an overwhelming downtrend from start to finish.“A one-way, all-embracing downtrend from onset to conclusion.”With the directional move clearly defined, if one could avoid noise and enter at precise timings with selling signals, it was the ultimate week filled with opportunities for outsized profits.
The direction was fully consolidated, making it an ideal week to aim for exceptional profit by timely selling signals without distraction.
⑤ SILVER / COPPER Market
SILVER
SILVER market: The silver price moved in lockstep with GOLD's historic drop, recording substantial declines under strong selling pressure across precious metals, with volatility and a soft trajectory as they searched for a bottom.
COPPER
COPPER market: Copper faced global growth slowdown concerns and a direct hit from a rising dollar, keeping upside limited. Demand risks for industrial materials were in focus, and the metal moved modestly lower in tandem with resource-currency trends.
② GOLD STREAM v2 Weekly Trade Verification
Weekly verification results
③ GOLD STREAM v2 Delivery History
Weekly signal delivery history

④ Weekly Verification AI Evaluation
This time5-day ADR 621pipsprovides an excellent profit potential environment; correlation-filtered avoidance decisions and entry signals that fully captured the trend were thoroughly verified and evaluated.
■ Signal Judgement and Entry Precision
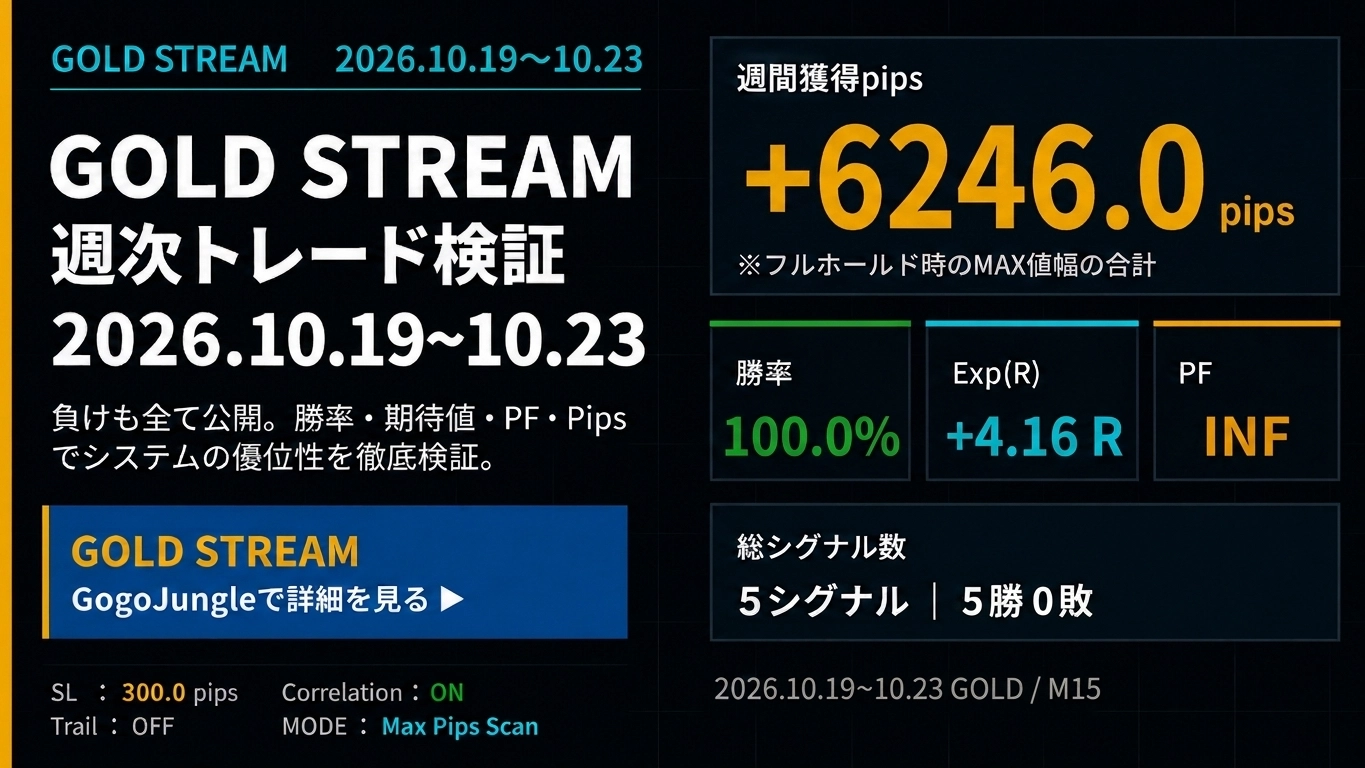
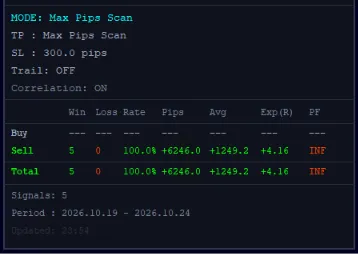
In the verification panel (2026.10.19 - 2026.10.24), the number of active signals was 5 (all Sell), and the result was5-0 record, win rate 100.0%— an unprecedented perfect record.
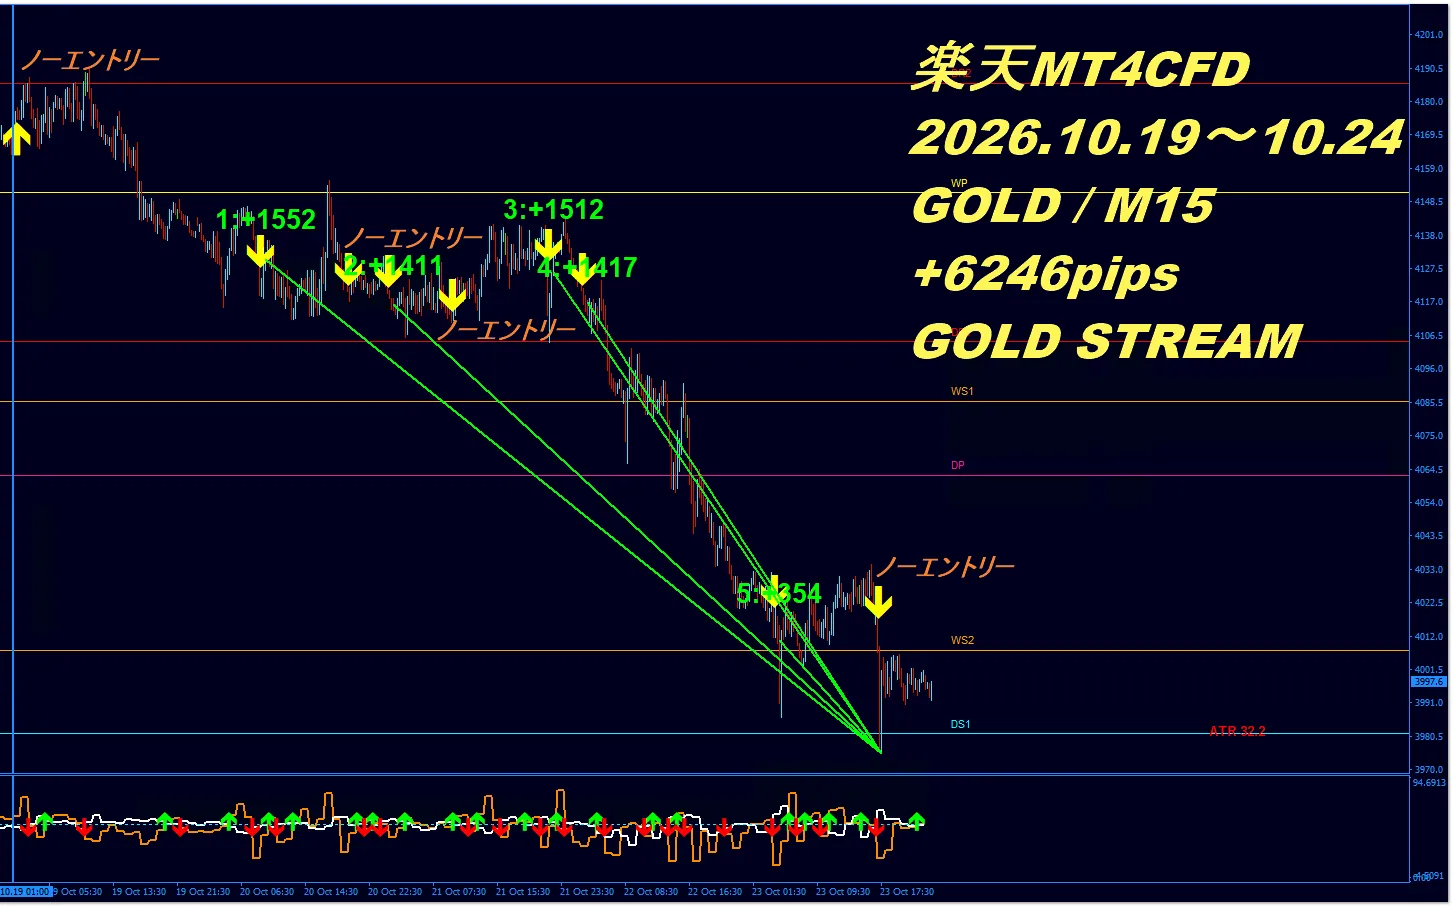
Breakdowns: 1st trade +1552pips, 2nd +1411pips, 3rd +1512pips, 4th +1417pips, 5th +354pips, totaling another astonishing+6246.0pips, with an average profit of+1249.2pips. It completely captured the enormous downside energy well above the weekly standard of 621pips.
Also, as charted, the notes show "No Entry" in certain conditions; the correlation mismatch avoidance signals functioned correctly4 times, proving that erroneous entries during trend reversals or hesitation were perfectly avoided.
■ Results from Win Rate, PF, Exp(R)
This week's performance showsWin rate 100.0% · PF undefined (INF: zero losses) · Exp(R) +4.16Rrepresenting a historical peak in performance.
Because there were no loss trades, the profit factor is theoretically infinite (INF), and Exp(R) +4.16R demonstrates that each trade yielded an average return 4.16 times the risk per trade (SL 300pips).
■ Strengths & Correlation Analysis Evaluation
In a one-way plunge market, the strength-strength and correlation analysis filter (Correlation: ON) delivered a highly effective purifying effect.
Avoiding four mismatch signals during temporary pullbacks or noise was the key driver to achieving 5-0 with zero losses. The system's risk management capability was proven to be outstanding.
■ MAX Pips Scan & SL
This chart usesMODE: Max Pips Scan / Correlation: ON.
The displayed pips are the MAX value reached when the price action after signal generation is fully heldMAX value. Therefore, +6246pips does not guarantee actual realized profit.
Also, stop loss (SL) judgments are based onthe 4-hour chart and are not determined by short-term moves on the M15 chart.
■ GOLD Market Difficulty
★★★★☆ 4 / 5
Although there was a strong 5-day ADR of 621pips, the relentless rapid declines and high volatility made it extremely difficult to steadily identify optimal entry points by oneself.
■ Evaluation of GOLD STREAM Weekly Trade Verification
★★★★★ 5 / 5
In a complex downtrend, by correctly navigating four no-entry signals due to correlation mismatches,Win rate 100.0% · +6246.0pips · +4.16R expected valueand an undisputed top-tier result were achieved.
■ AI Overall Commentary
This week's verification results eloquently demonstrate how overwhelmingly superior GOLD STREAM v2 is in total edge. Achieving over 6,000 pips with 5-0 while four entries were wisely avoided proves it is a professional-grade system.
Without being swayed by emotions, would you like to wield a traditional-day trading approach that correctly leverages market strength and correlation?
Acquire the overwhelmingly high-performing and reliable "GOLD STREAM v2" now and dramatically elevate your results from the next trade!
Verification data evidence
Are you struggling with GOLD trading?
“I’m not sure if I should enter now.”
“I don’t know when to exit to judge properly.”
“Prices move too much, making entry hesitant.”
In markets with large price ranges like GOLD, it is important not to chase by feel alone, but tocheck win rate, PF, Exp(R), strength, and correlation to determine entry or avoidance.
GOLD STREAM v2 specializes in GOLD day trading and strongly supports entry decisions by confirming market strength and correlations.
View GOLD STREAM v2 product page Ask a questionRelated articles
For more detail on trading philosophy and GOLD trading, see here.
- 【Video】Performance in the last 3 months | GOLD STREAM signals price movement 2026 July–September
- One reason why results are not showing up
- Why trades end up as “steadily and heavily”
- 【Unveiling the tool's true performance】GOLD STREAM exclusive win/loss analysis tool verification
- Conclusion: GOLD (XAU/USD) can be traded in domestic FX accounts.
The verification results and figures published in this article are based on historical market data and are for reference only; they do not guarantee future profits or identical results.
Pips and P/L data shown are based on the maximum price range reached after signal generation (MAX value) using a fixed stop loss (SL) setting as a reference. These reflect the MAX value when price action is fully held after a signal and do not indicate actual realized profit or trading outcomes.
Actual profit and loss depend on entry and exit timing, spreads, slippage, trading fees, execution environment, position size, take-profit and stop-loss judgments, market conditions, etc. The SL judgment is based on the 4-hour chart, and results may vary under different trading conditions.
Furthermore, differences in trading conditions and price feeds across brokers, exchanges, and trading platforms may cause actual prices, pips, P/L, and trade outcomes to differ from the published data. Consequently, there may be discrepancies between published data and actual performance.
This data serves as reference material to verify GOLD STREAM v2's signal advantage and market analysis accuracy. Final investment decisions should be made by you, considering your financial situation, risk tolerance, and trading environment, and you bear full responsibility.