

2026/10/24 Dollar-Yen, Gold, SP500, and Nikkei 225 Environment

For behavioral verification, we prepare weekly videos of USDJPY price movements.
Note: The score signals and score lines in the video only display on the future side. They will not appear on the lower chart image.
<One word>
Currently, we are porting and testing only the currency strength side’s scale adjustment feature to TLP3 as well.
By riding the strong trend, the short- and long-term signal reproducibility improves. We will publish it once thoroughly tested.
Dollar/Yen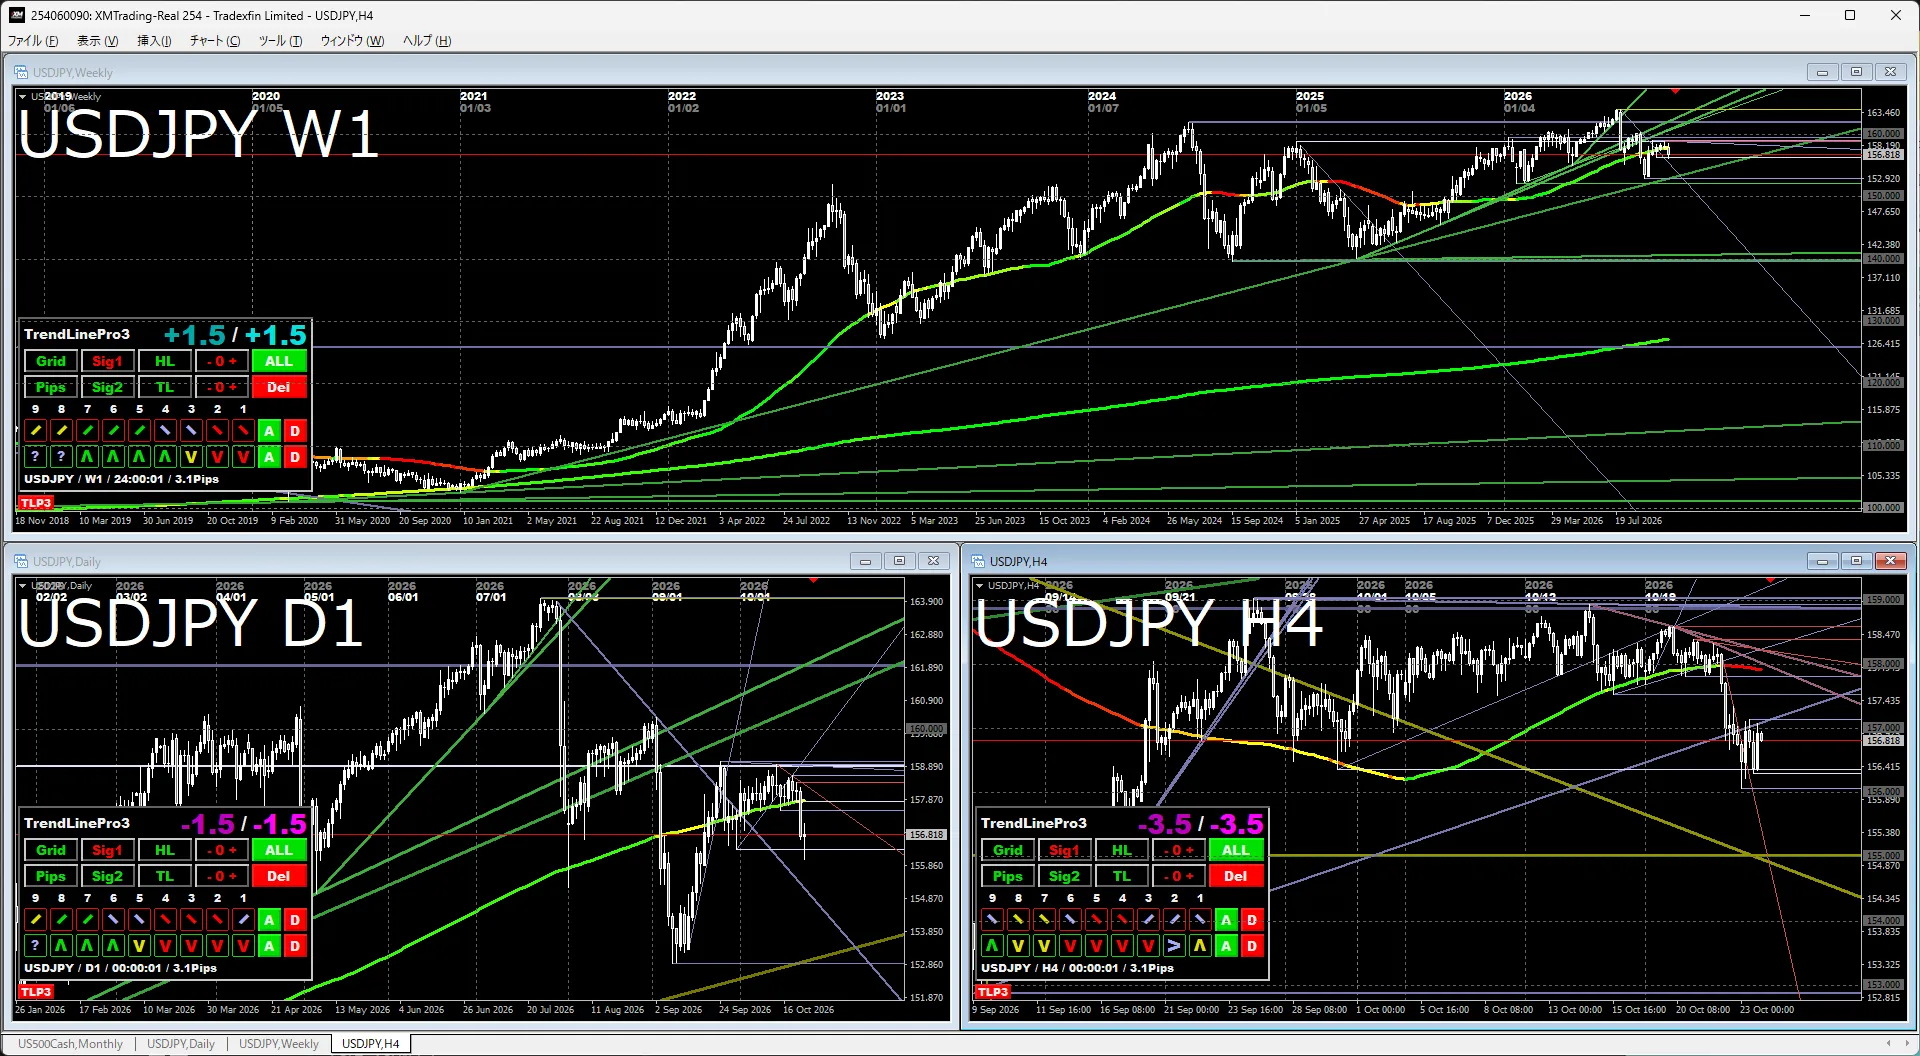
Daily/4-hourIn the near term, expect a period of unclear direction until it breaks through around 159 and 156. The 4-hour MA is turning down, making a slight downward bias noticeable.
Gold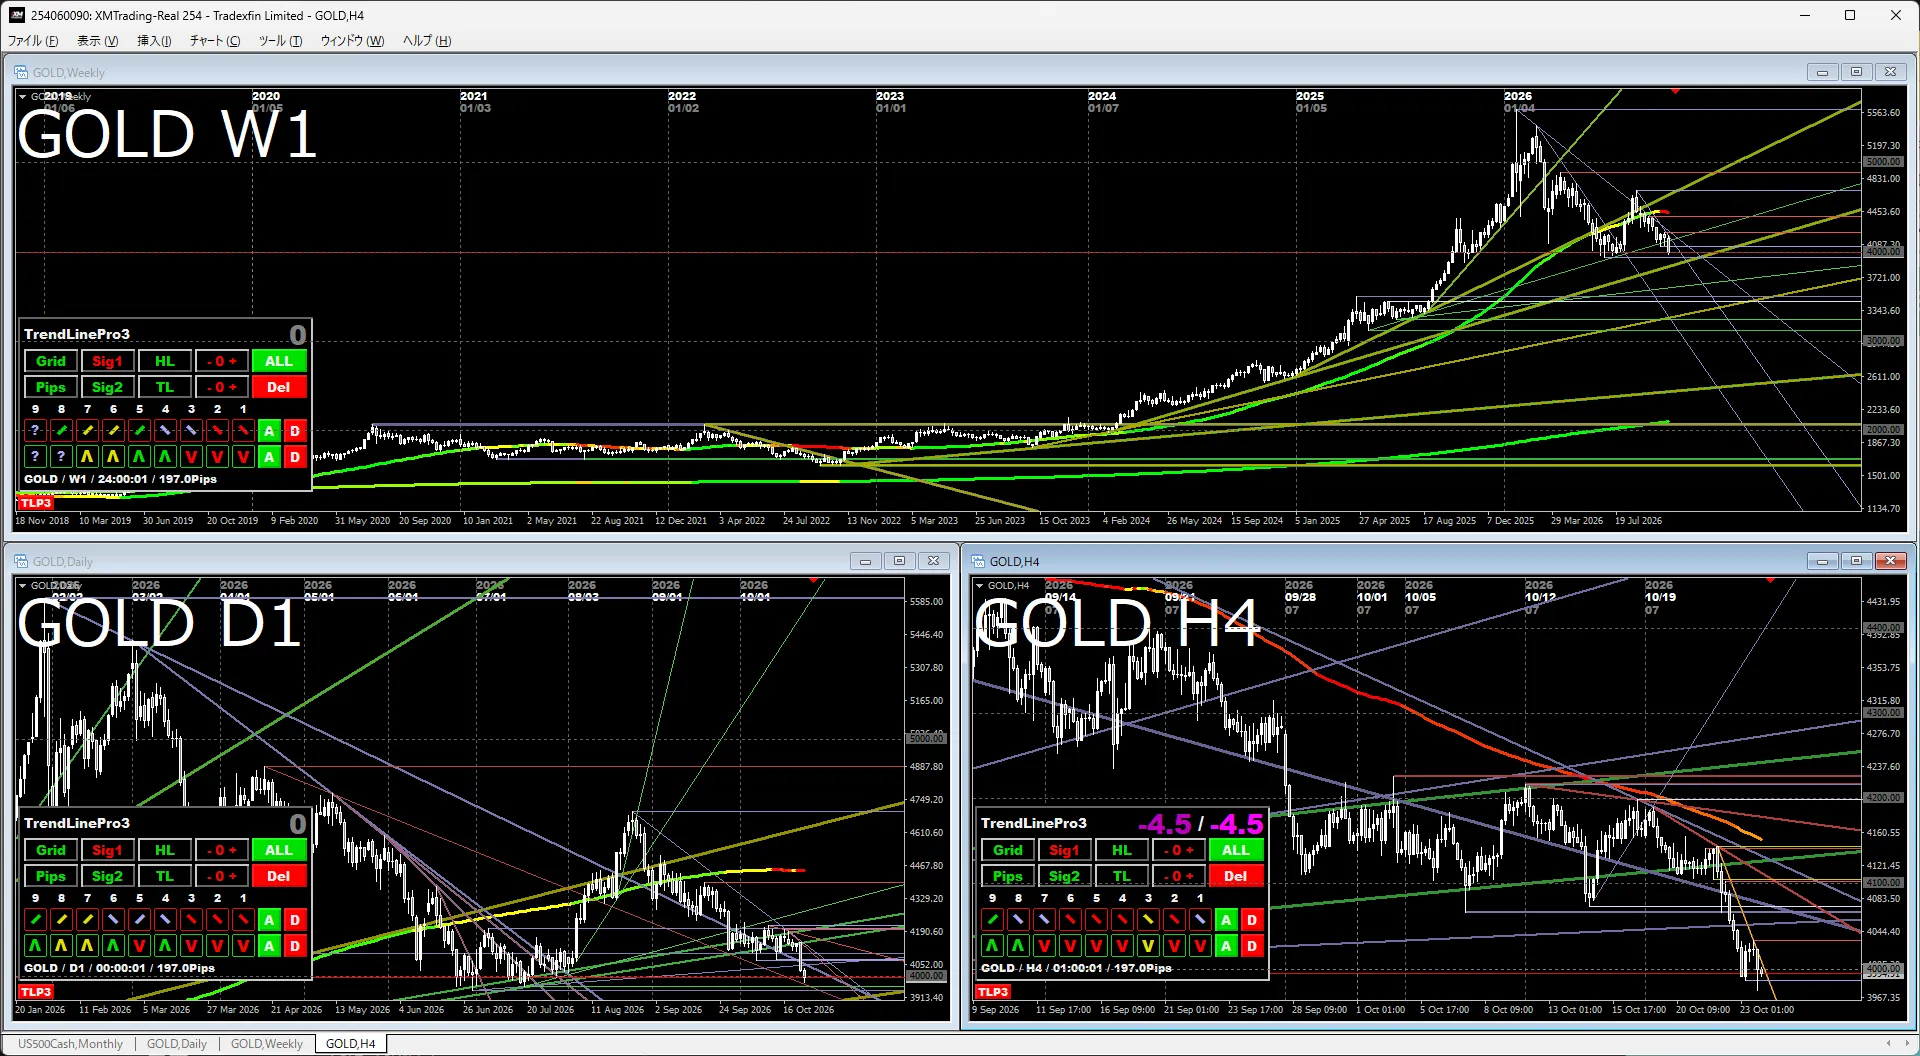
Daily/4-hourAs expected, the trend-direction resistance tends to be broken more easily. It clears the previously watched trendline and tests the recent lows. If it breaks, 3500 becomes a noticeable level, though gold is prone to buying and should not be assumed to run away once broken; watch the chart carefully.
S&P 500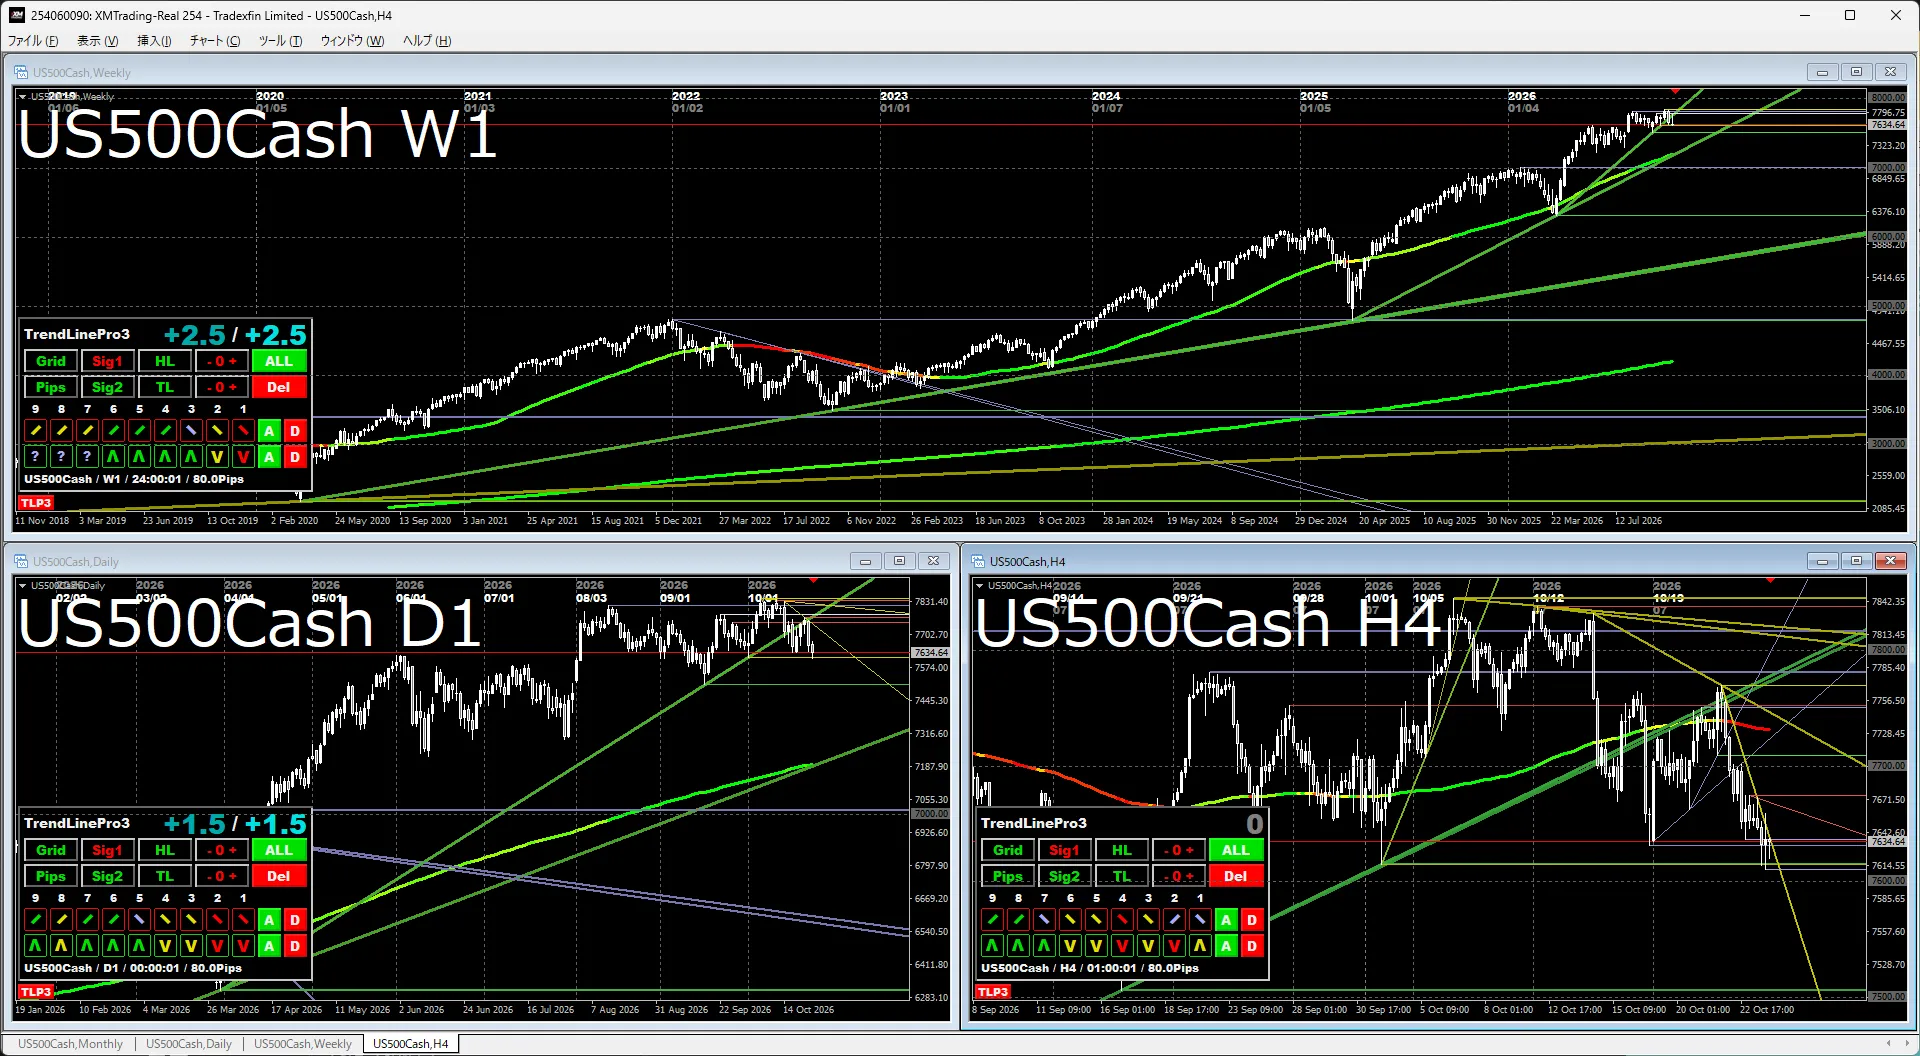
Daily/4-hourContinuing to watch for a break below 7600; if not, it may remain a correction unless a major news event triggers a sharp drop.
Nikkei 225
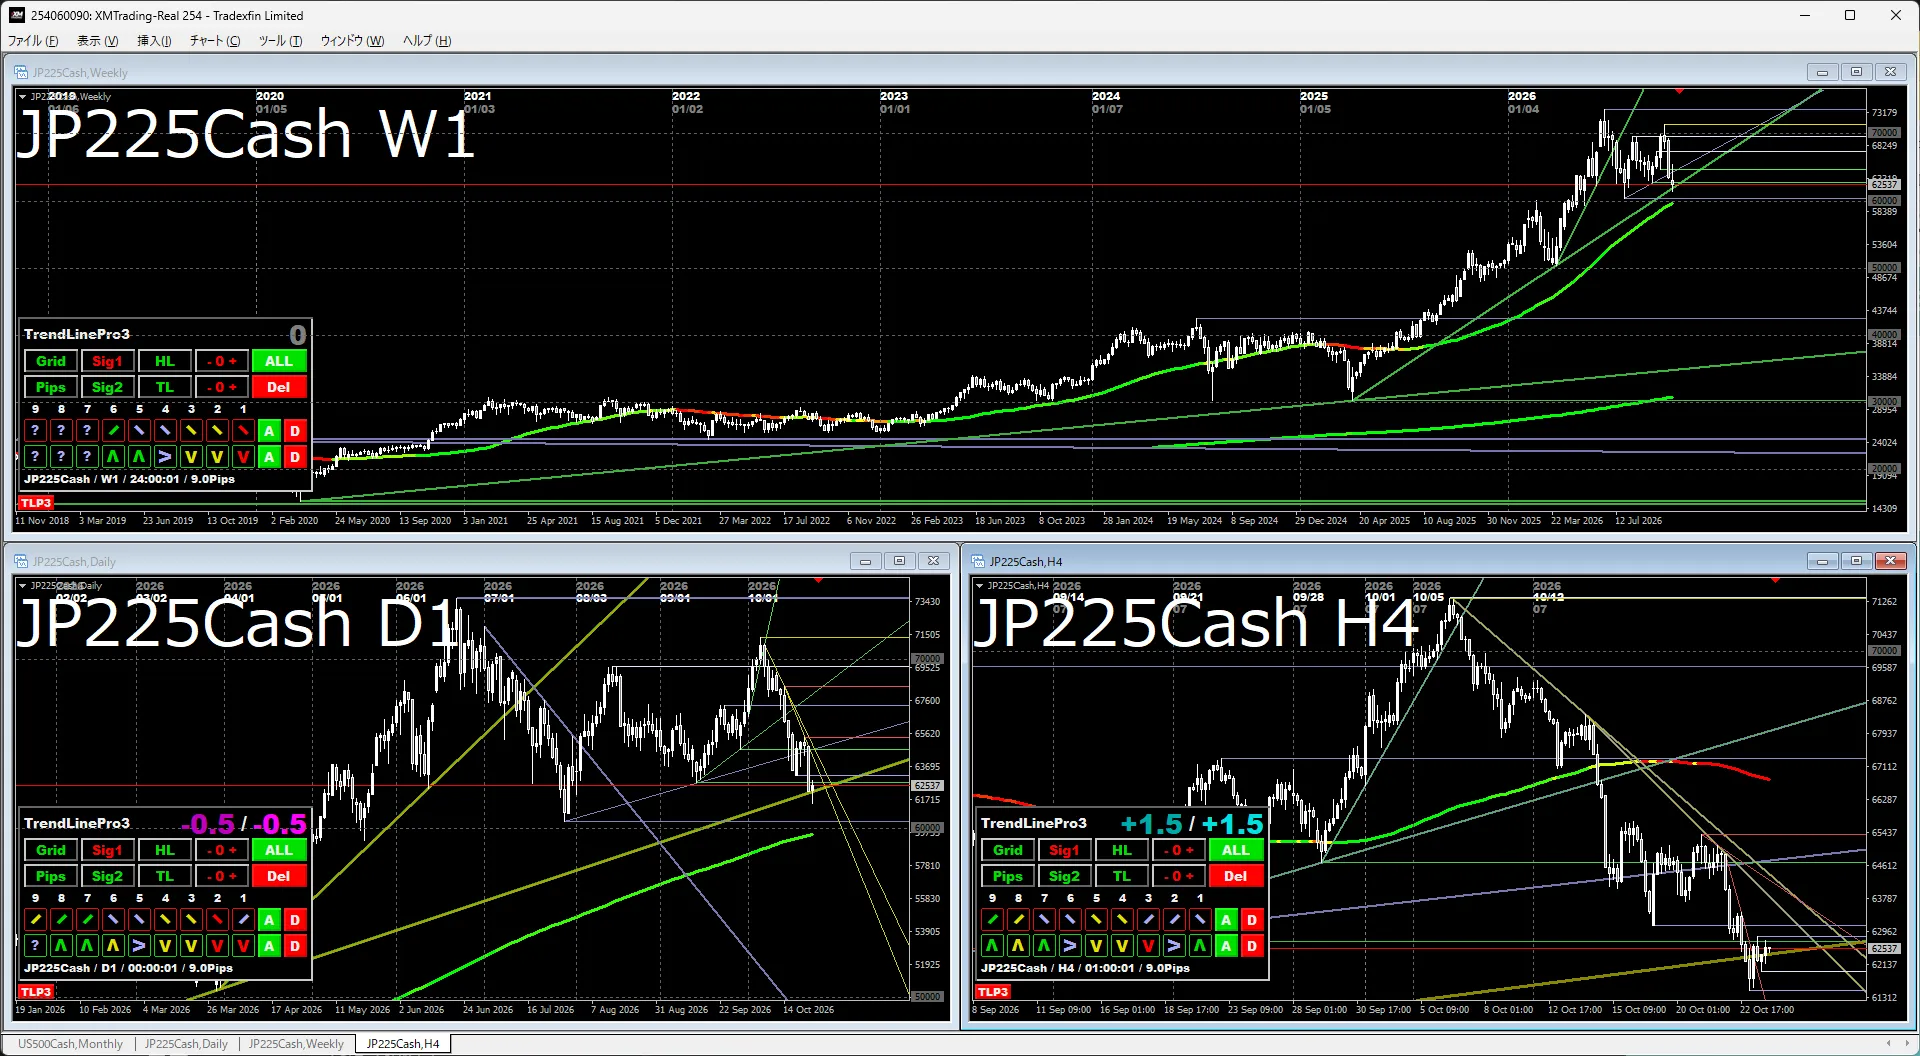
Daily/4-hourBreaking above 70,000 and higher tops is in focus, but there is resistance at 60,000, MA, and trendlines, making declines likely. Even if a breakout occurs, the pattern is a reverse triangle and tends to rebound. Unless major news comes out soon, expect a continuation of the pullback routine.
The indicator in the attached image uses the indicators below.
If you are interested, please take a look.