
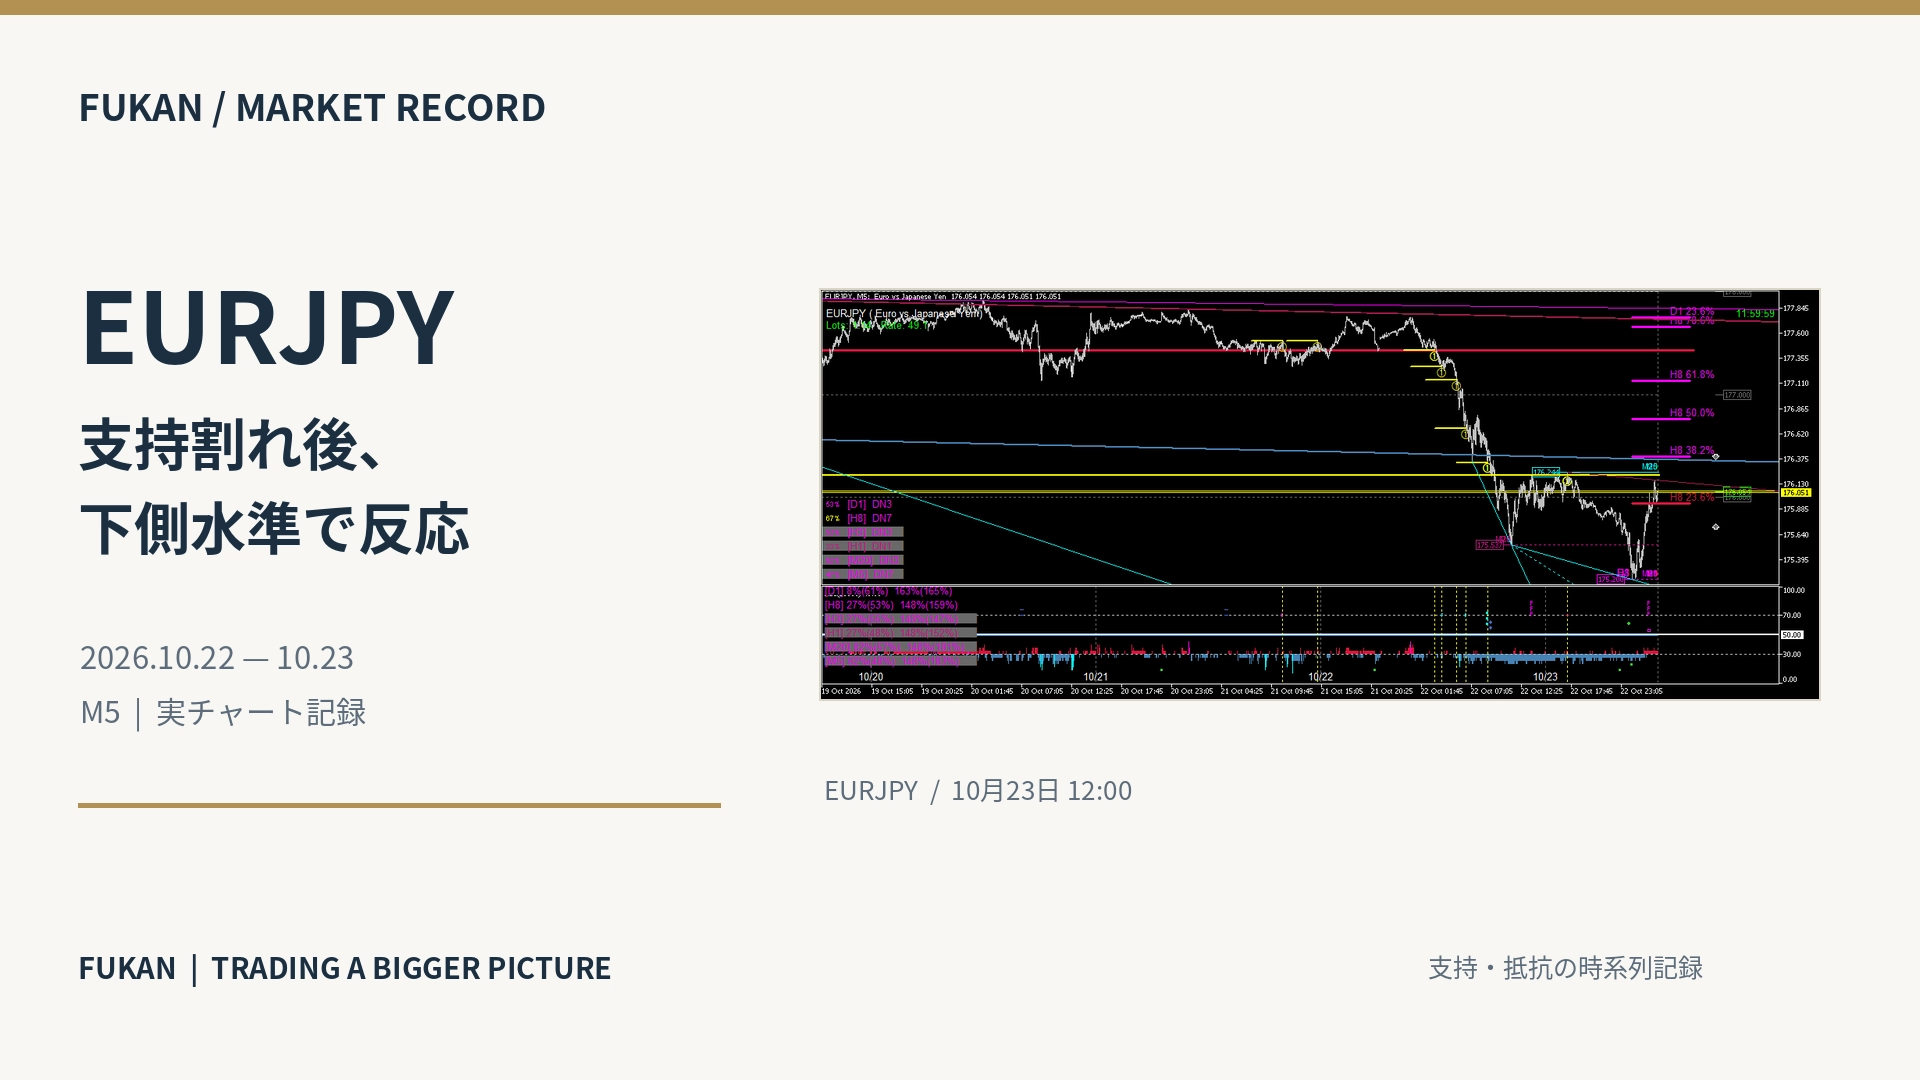
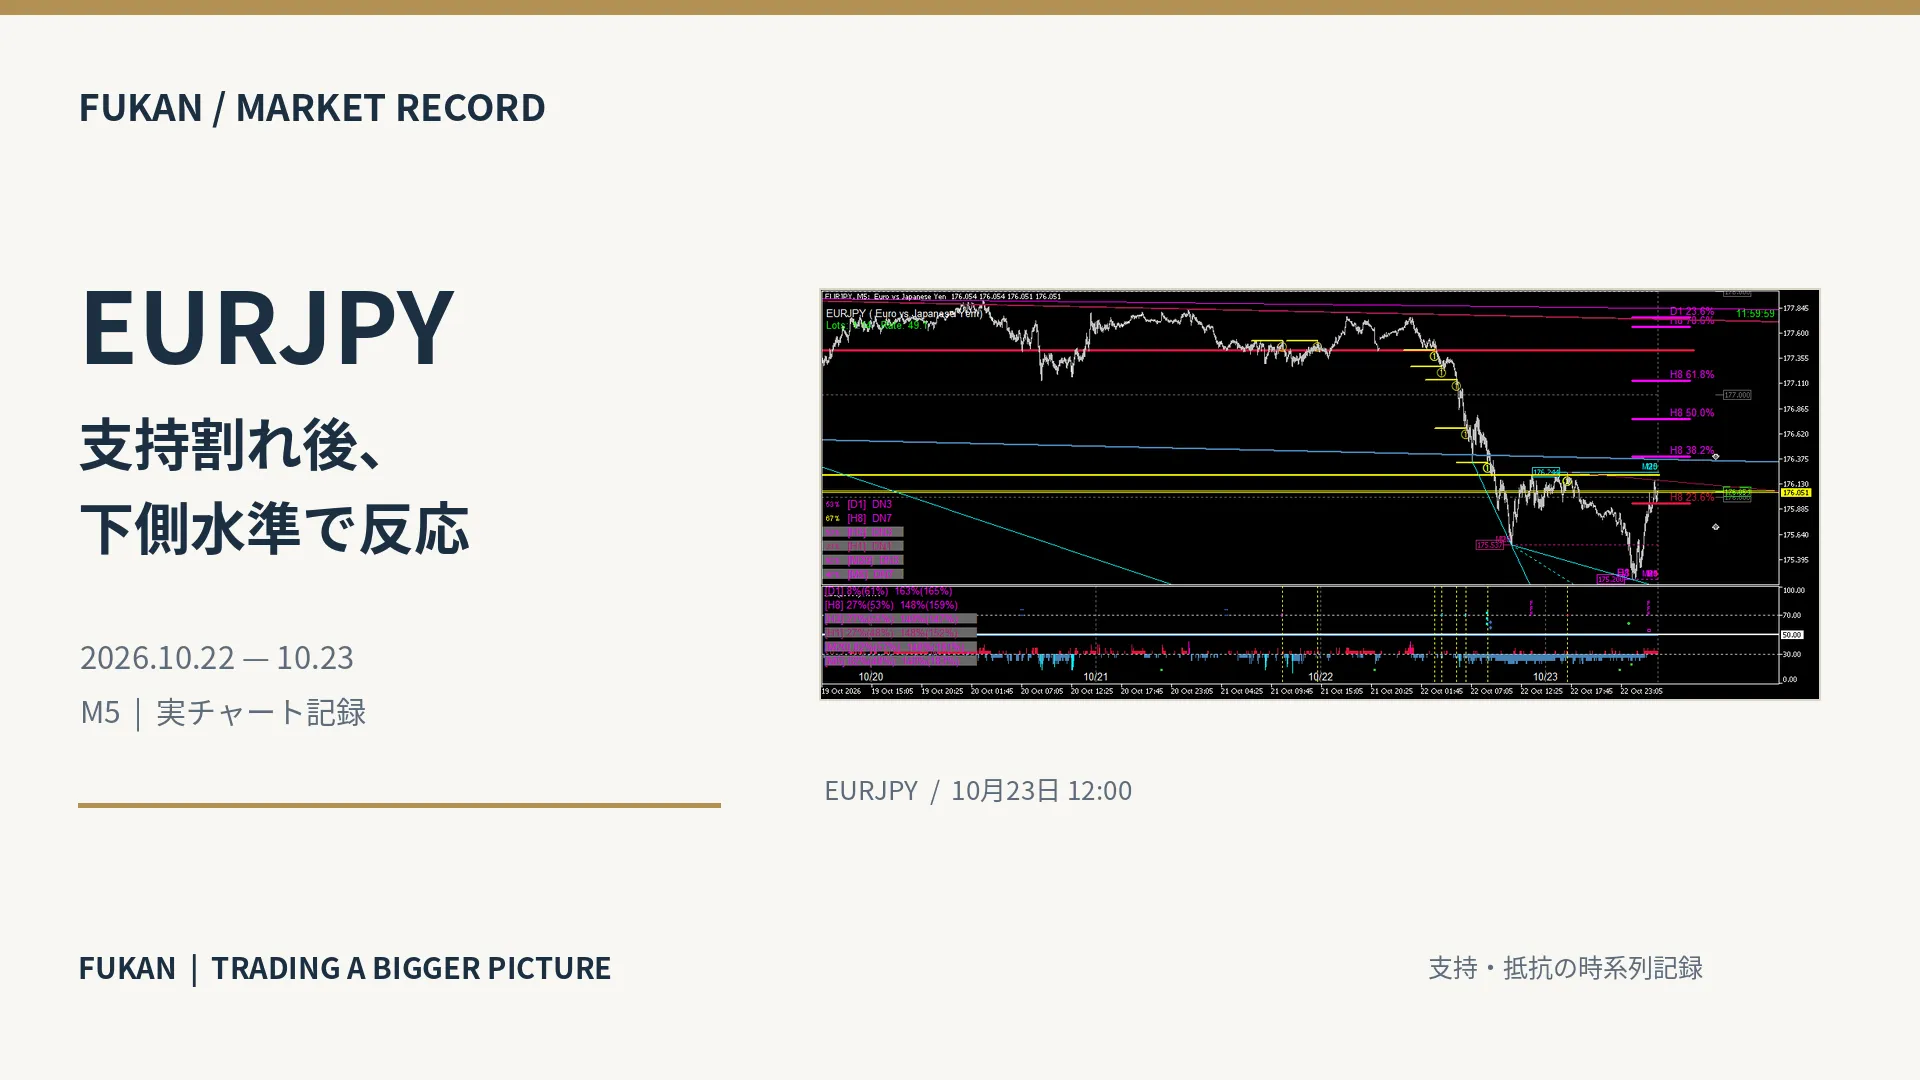
EURJPY, from breaking the 177-yen support to around 175.20 yen—chasing the rebound on the 23rd
FUKAN / MARKET RECORD
EURJPY Falls Below 177.0 Level, Heads Toward Around 175.20 — Following the Rebound on the 23rd
On October 22, EURJPY dipped below the 177.4 yen horizontal zone, moving to lower price levels. Late that day it slid to the upper 170s, and on the 23rd it displayed a low near 175.20 before rebounding to around 176.05. In FUKAN's real-time M5 chart, observe how the positions of support, resistance, and the yellow contact indicators shift relative to the price in chronological order.
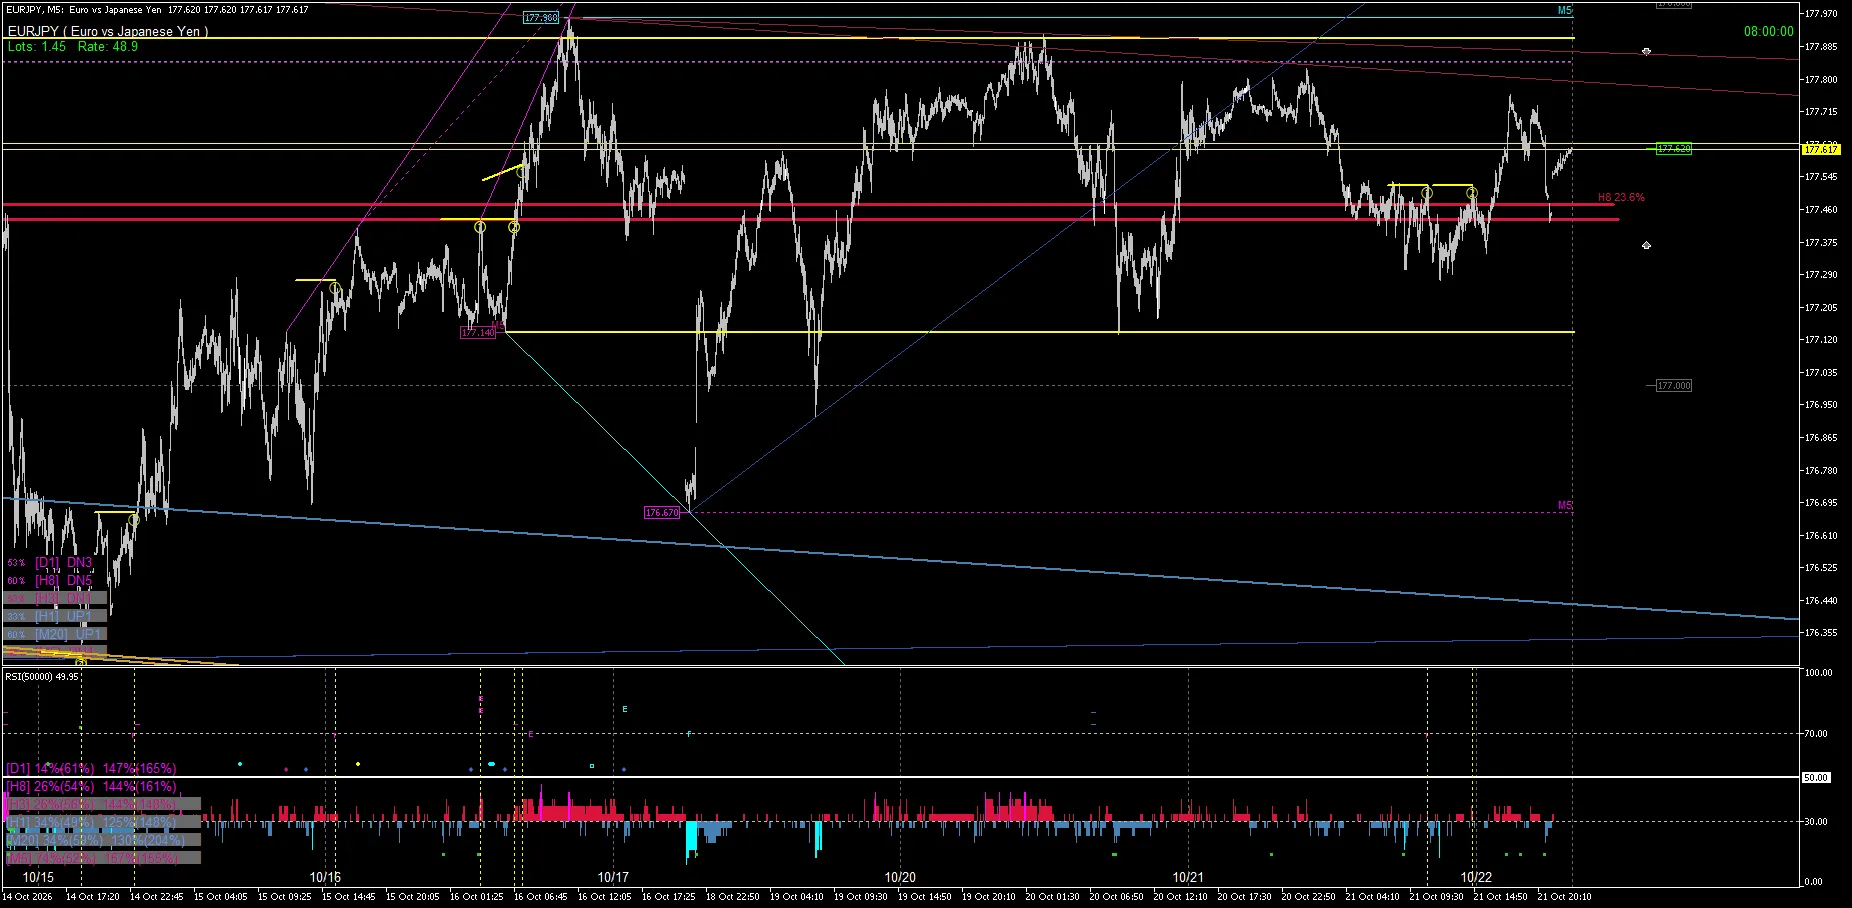
01|October 22, 08:00|Around 177.62 yen horizontal zone
In the 8:00 a.m. image, the price overlapped with the yellow horizontal band around 177.62 yen. To the lower side there was a red horizontal band around 177.44–177.47 yen, and further below a horizontal line near 177.14 yen could be seen. Above, a downward-sloping diagonal line was present, enclosing multiple levels.
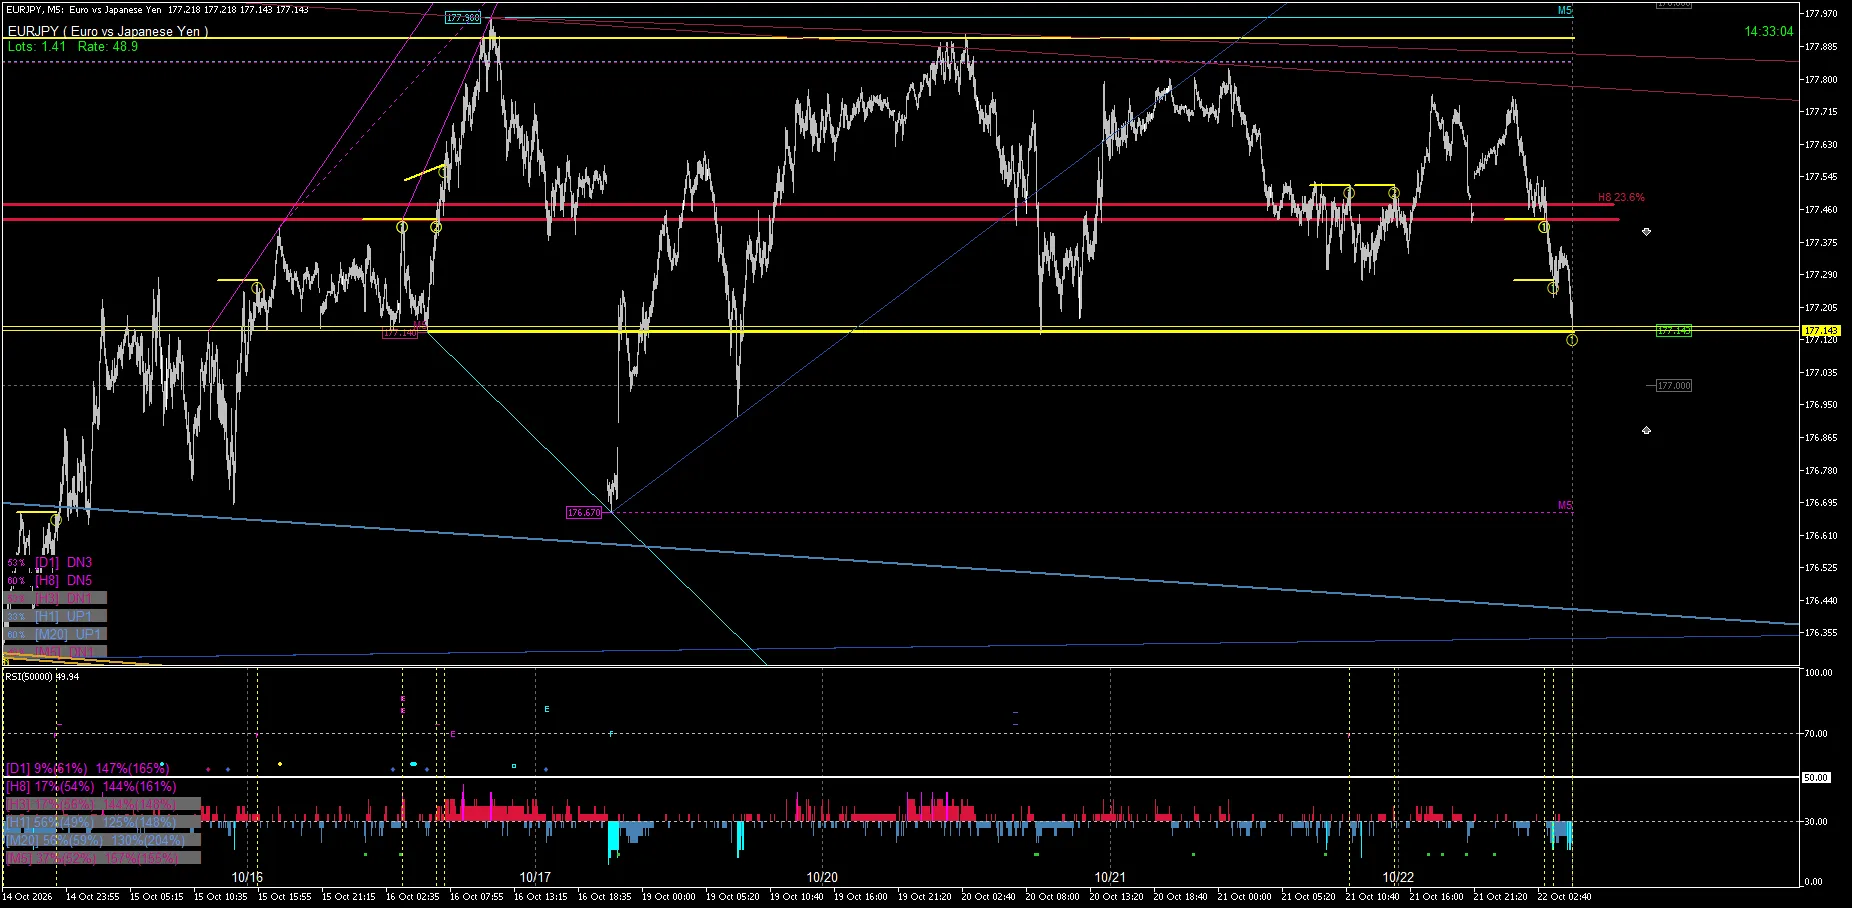
02|October 22, 14:33|D breached the 177.4 yen support band
In the afternoon image, the price fell below the red band around 177.4 yen and approached the yellow horizontal line near 177.14 yen. At the right edge of the decline, multiple yellow circle marks appeared. The red band that had been below the price earlier shifted to the above side.
03|October 22, 20:00|Moved toward the lower band of the mid- to high-175s
The decline did not stop near 177.14 yen and even fell below the 176.6 yen level. In the 20:00 image, the price approached around 175.9 yen where yellow bands and multiple-timeframe lines converge. The distance to the red band at around 177.4 yen widened.
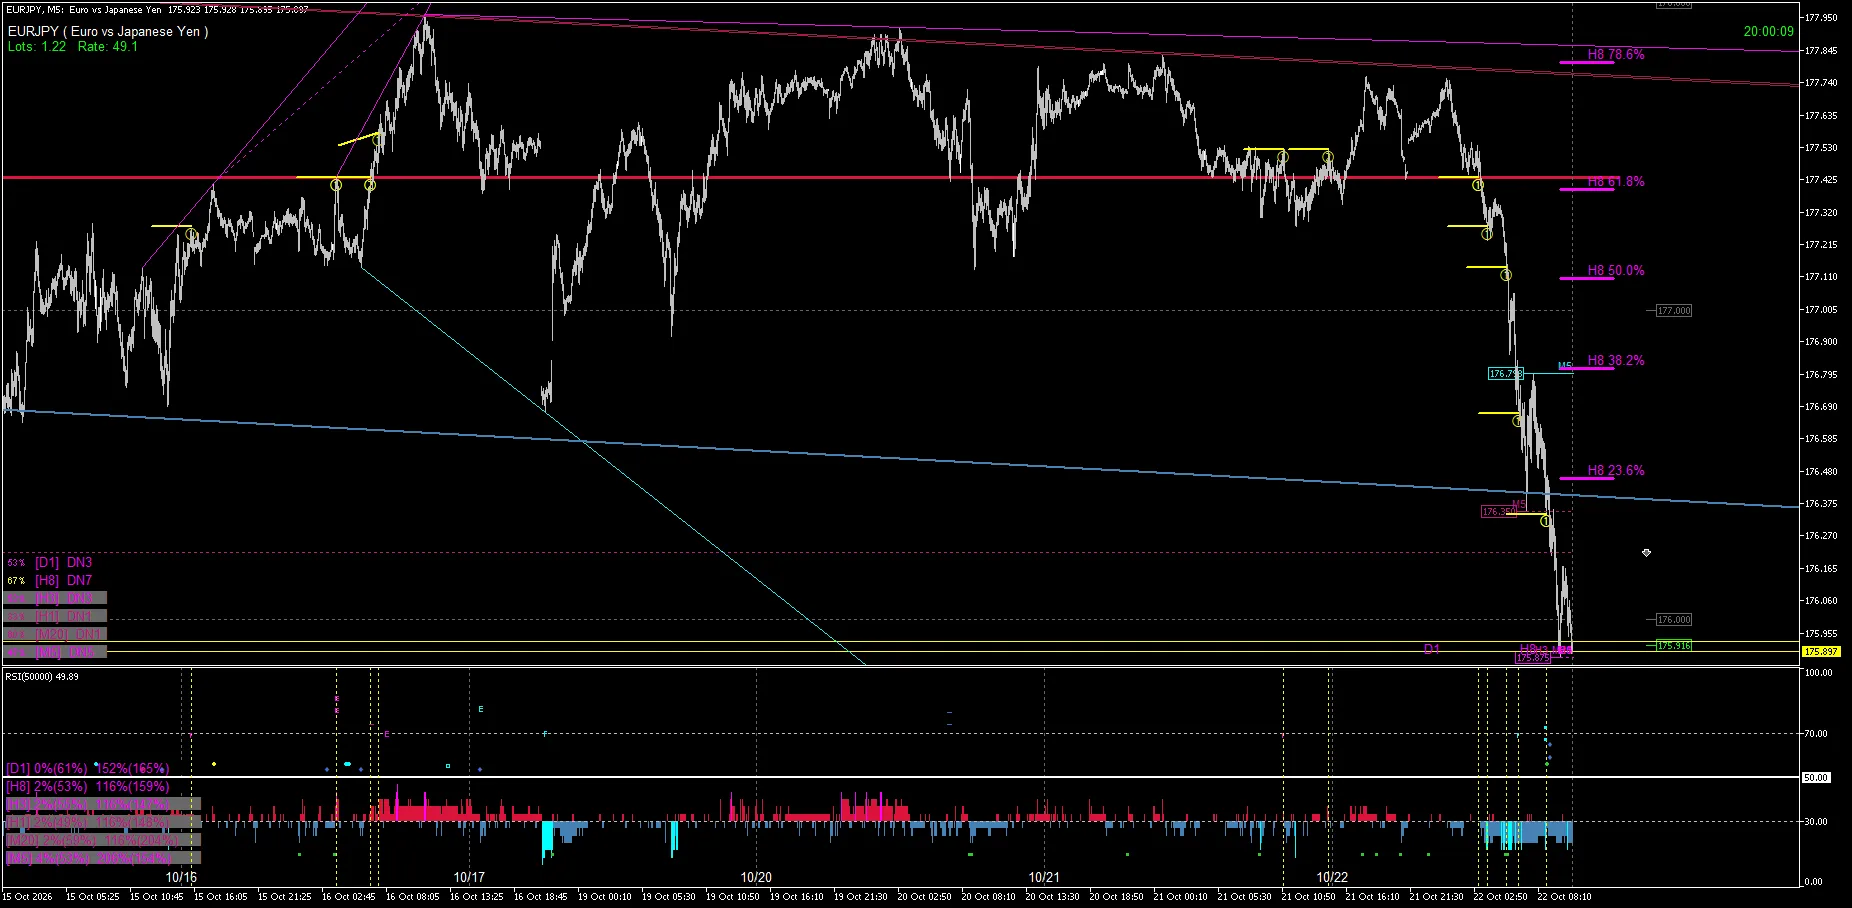
04|October 23, 08:00|Recovery after the low near 175.537 yen
The image for the 23rd shows a low near 175.537 yen. Afterwards, the price recovered to around 176.2 yen at times, but at 8:00 the price stood around 175.84 yen. The yellow band around 176.2 yen lies above the price, while a low in the mid-175s remains below.
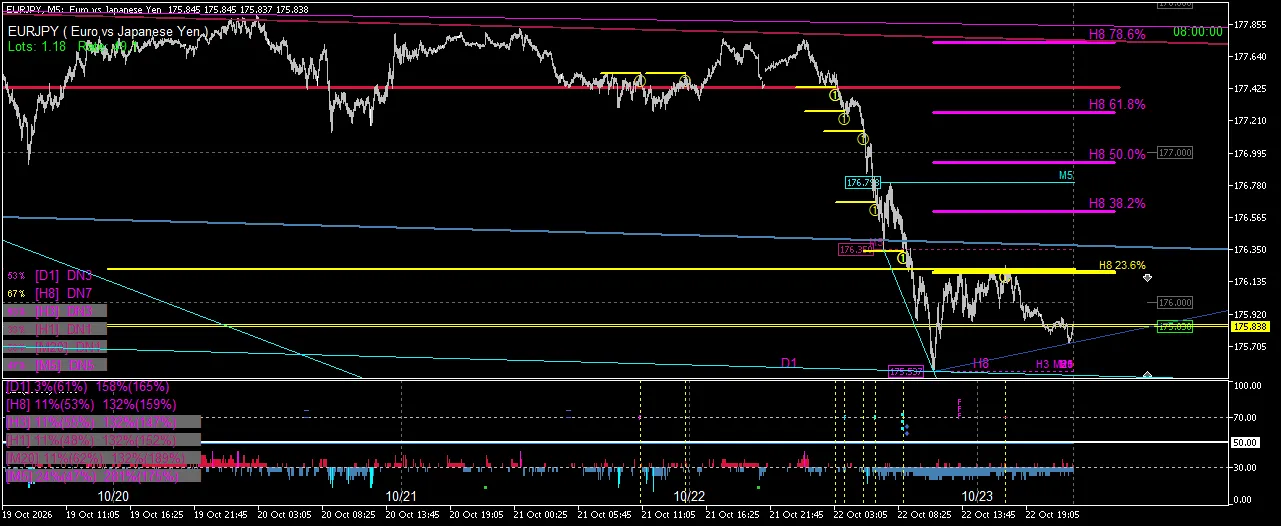
05|October 23, 12:00|Low near 175.20 yen and rebound to 176.05
In the 12:00 image, a new low near 175.20 yen is displayed. From there, the price rebounded to around 176.05 yen and approached the yellow horizontal band. Above, there is the recent rebound high in the 176.2 yen range and a blue diagonal line in the 176.3 yen range, while the bottom remains near the 175.20 yen low.
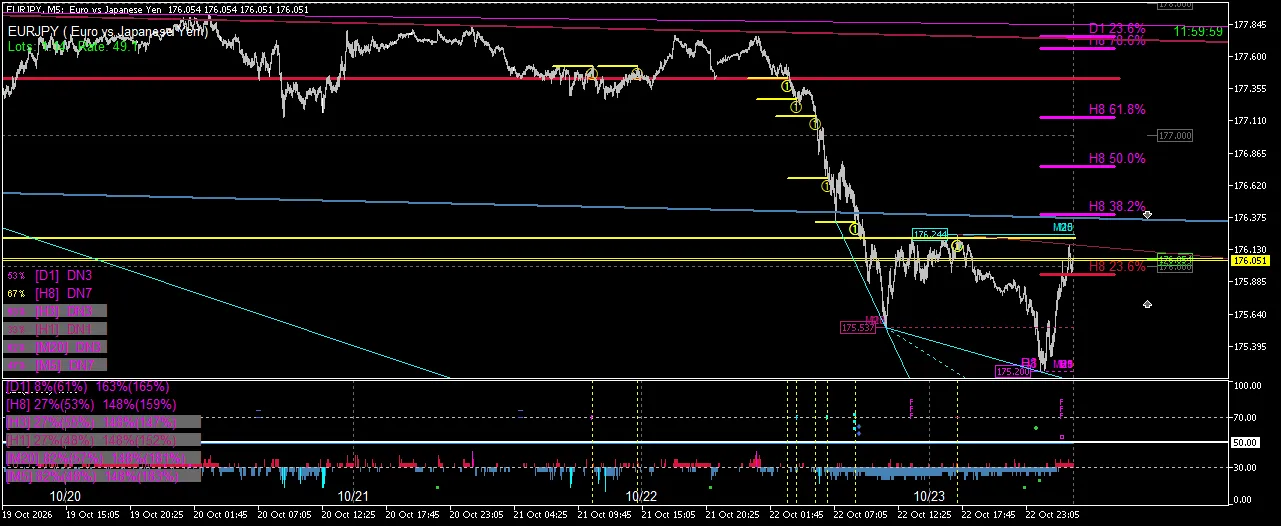
Relationship of Support and Resistance
The red band around 177.4 yen, which supported prices on the morning of October 22, moved away above the price by the 23rd. In the post-drop images, you can see lows in the mid- to low-175s and rebound levels in the low 176s. By overlaying the yellow contact indicators with multiple-timeframe lines, you can track how the support/resistance relationship changes.
For features of FUKAN v2.00 and the 7-day trial, please check the GoGoJungle product page.
This article is a market observation and analysis record and is not investment advice or a buy/sell recommendation. It does not guarantee future price movements, profits, or win rates.
The image times are based on the captured display times.