
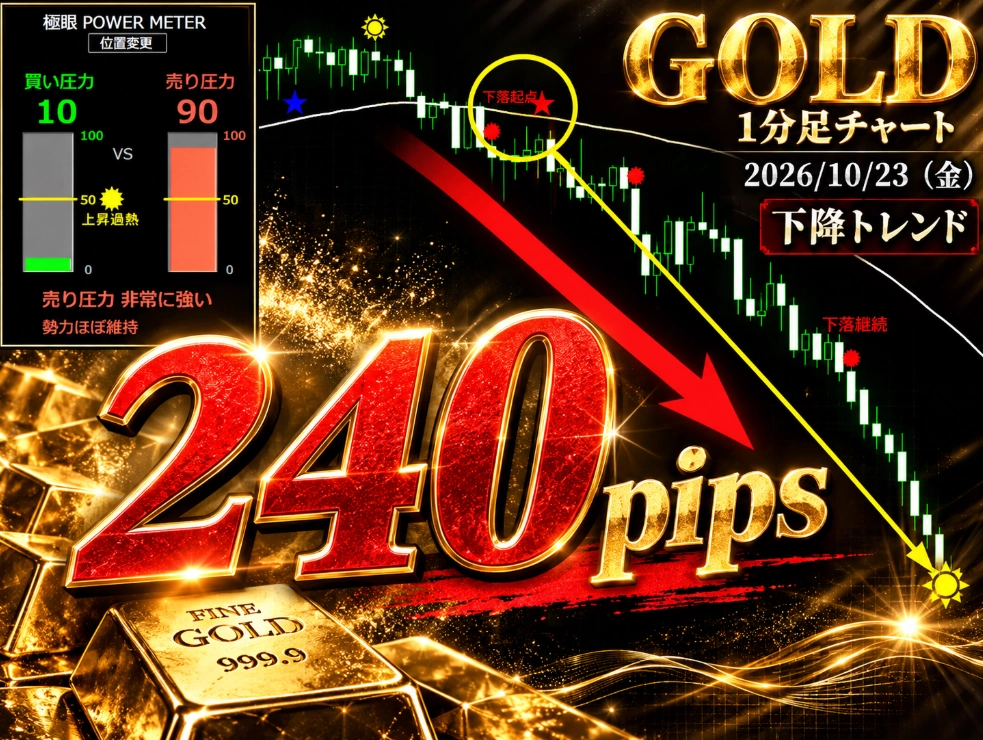
[GOLD 240 pips downward wave!] The world of selling pressure 90 revealed by the extreme eye|October 23, 2026

Hello, this is lucky,
Today, Friday, October 23, 2026
In GOLD's 1-minute chart, a very interesting downtrend has been confirmed!
That range spans as much as +240 pips!
Today, from the perspective of the "Kokugan POWER METER," I would like to explain this downtrend in an easy-to-understand way for beginners as well.
"It's fallen enough already, it should go up soon"
And when you tried buying...
it falls further.
It falls again.
And then falls one more step.
Before you know it, a large downtrend.
This is a judgment that can trap not only beginners but also experienced traders.
Why is that?
Because the focus becomes so much on how much prices have fallen that you lose sight ofwhich is currently stronger, buying or selling.
Numbers confirmed on GOLD today
Please look at this chart.

Kokugan POWER METER displays the following values
?Buying pressure: 10
?Selling pressure: 90
Selling pressure is extremely strong
And in the actual chart, the downtrend continues
A down movement of 240 pips was confirmed!
What matters here is not just the number 240 pips.
The key is whether you can decide not to go against the trend when selling pressure is dominant.
That is what is important.
What Kokugan aims to achieve
There is a belief I hold dear in the development of Kokugan.
That is,
"To read the future, quantify the truth of the current market in real time"
this is the point
If you only look at candlesticks, you are prone to intuitive judgments.
However, if you can verify buying and selling pressure with numbers, you gain one more material to consider in market analysis.
Of course, strong pressure does not guarantee that price will move in that direction.
That is why it is important to also confirm the trend direction, candlestick movements, and stop-loss positions together.
Kokugan is not a tool that guarantees the future; it is an analytical tool to interpret the current market environment.
More important than 240 pips
When you see such a large downtrend, you tend to focus on the price range.
However, what I want to convey to everyone is more essential.
That is,
before chasing a big wave, know which force is stronger right now.
In the market there are times when buying is strong, times when selling is strong.
And there are times when neither side has momentum.
Understanding that difference is the first step to refining trading decisions.
Finally
I have studied the structure of waves and the power balance of markets for many years
And there is something I strongly feel
What matters in the market is not to time the tops and bottoms perfectly every time.
Right now, what kind of wave is forming and which side is gaining strength
That is what to focus on
From now on, I will continue using actual charts to explain in an easy-to-understand way for beginners!
▼【Kokugan KYOKUGAN】 product page
https://www.gogojungle.co.jp/tools/indicators/87008
If you want to know the latest market analysis and development information,
please also follow Investment Navi!
Thank you always for your support!
Pro trader lucky