
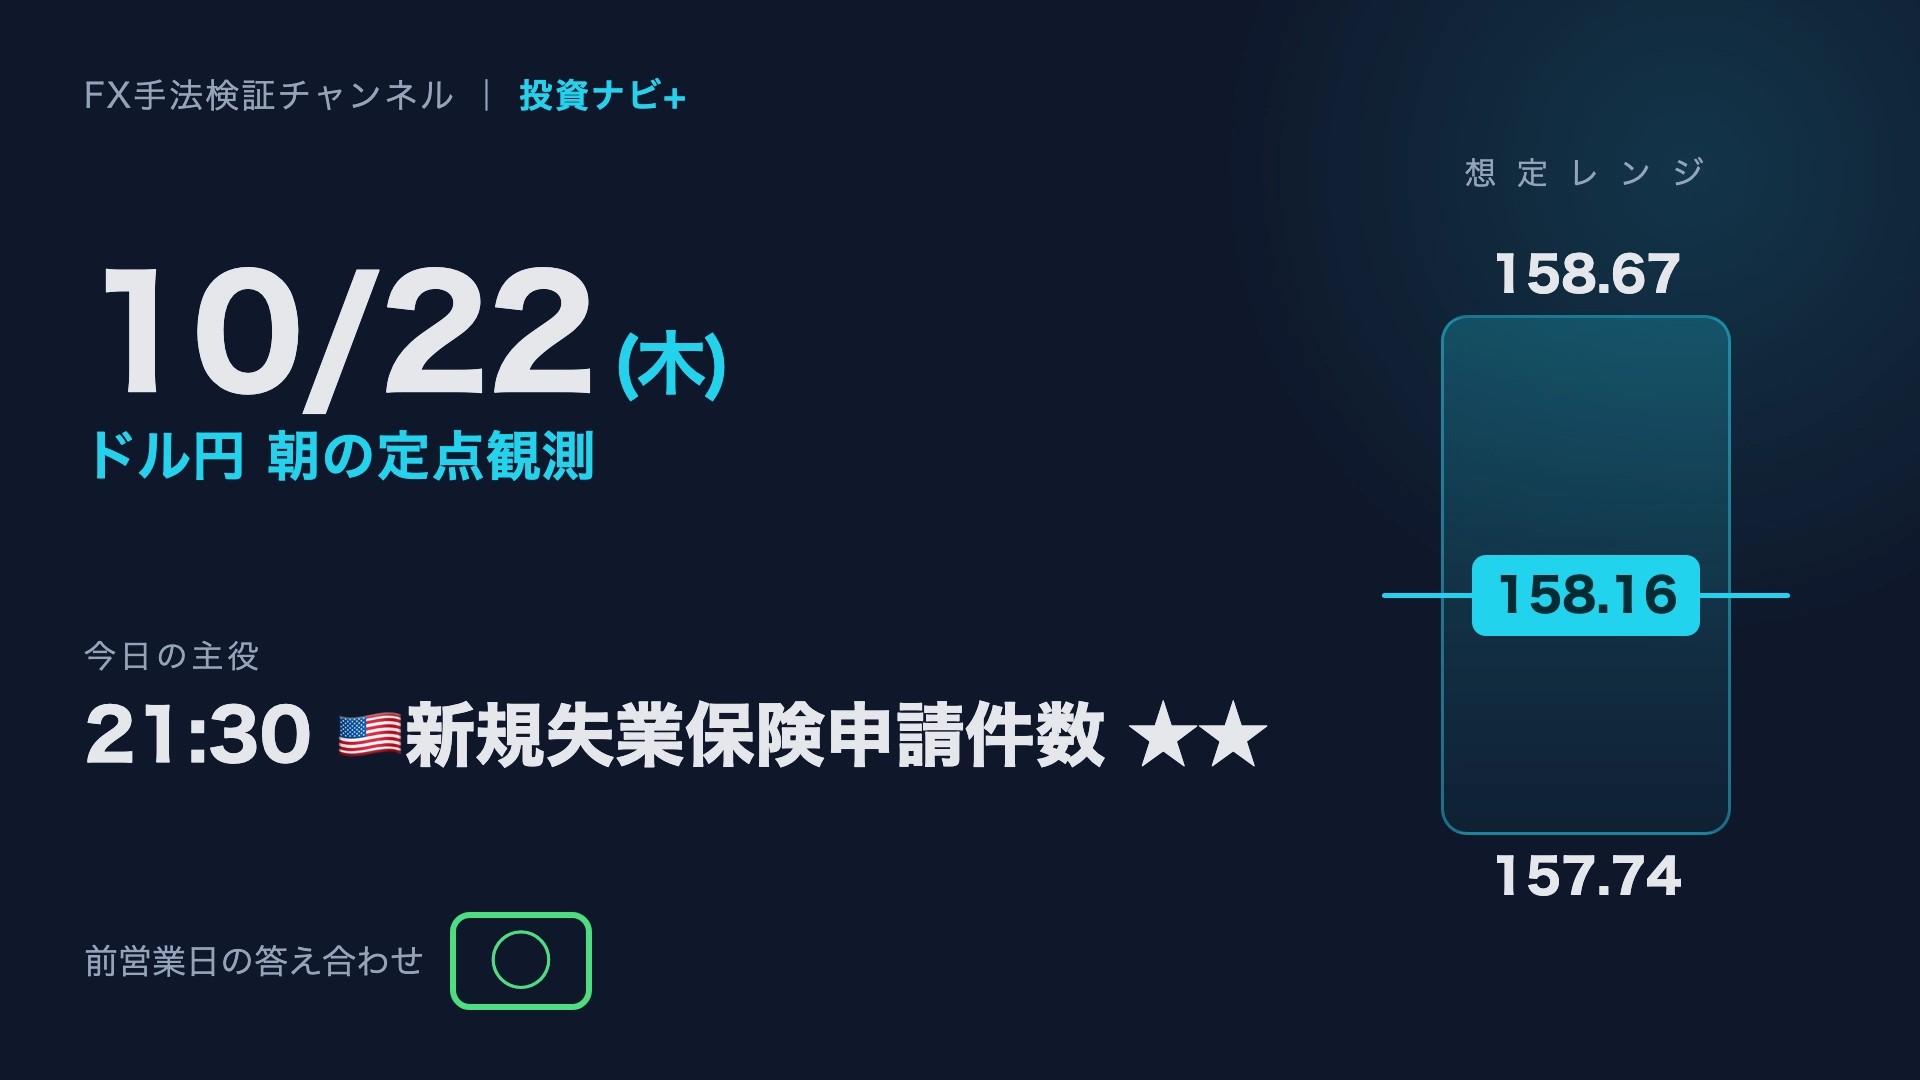
[10/22 Thu] Dollar-Yen Morning Fixed Observation | The star is the 21:30 US Initial Jobless Claims★★
This is the morning record for Thursday, October 22. Today's main focus is 21:30 US initial jobless claims★★. The USD/JPY current price is 158.16 yen, with an expected range of 157.74–158.67 yen.
The answer for the previous business day was a pass. Below, I will place the indicators, charts, and scenarios in order.
First 60 seconds | Today's Economic Indicators

Today's Economic Indicators (10/22 8:30 - JST next day 8:29)
| Time (JST) | Country | Indicator | Importance | Forecast | Previous |
|---|---|---|---|---|---|
| 19:00 |  | CBI Manufacturing Orders | ★ | -20 | -9 |
| 21:30 |  | Initial Jobless Claims | ★★ | 200K | 199K |
| 23:00 |  | Consumer Confidence – Flash | ★ | -17 | -17 |
| 23:00 | | CB Leading Economic Index (MoM) | ★ | -0.1% | -0.1% |
| 23:30 | | EIA Natural Gas Storage | ★ | 80B | 67B |
| Next 08:01 | | GfK Consumer Confidence | ★ | -14 | -13 |
Today’s Movements
The 21:30 US initial jobless claims came in at 199K versus an expectation of 200K, virtually flat from the previous figure, indicating no sharp deterioration in employment was priced in. If the actuals beat expectations (claims rise), the dollar tends to weaken; if they miss (claims fall), the dollar tends to strengthen. Since this is a weekly employment indicator, a sharp rise could be read as a recession signal and may impact USD/JPY as well.
USD/JPY Current Position
Current Price158.16 (Previous business day close 158.13 / -0.03 from yesterday)
Expected Range157.74 (support) ~ 158.67 (Pivot R2)
Primary OutlookHold between 157.74 and 158.67. Direction awaiting US indicators after 21:30
AlternateBreak above 158.67 to test 158.99 / Break below 157.74 to push to 156.38
Daily Timeframe Environmental Context
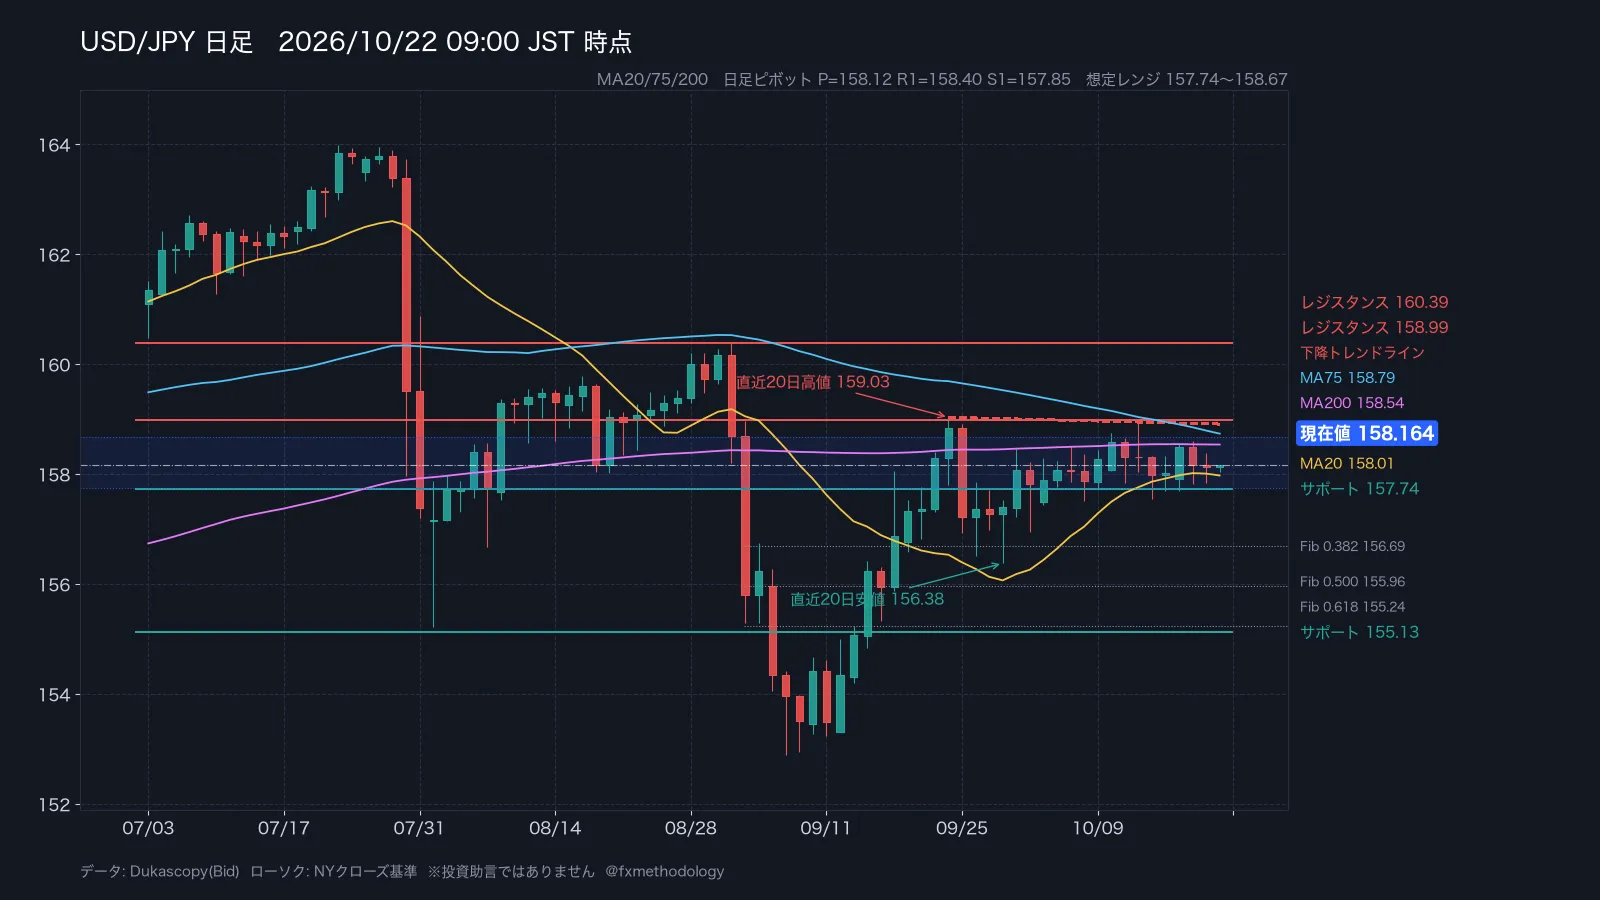
The daily chart is in a range, with MA20, MA75, and MA200 converging and no clear directional bias. The current value 158.16 sits above MA20 (158.01). The next resistance is 158.99, with the next level at 160.39; 158.99 is just below the high of 159.03 on 9/24. The lower level is 157.74, with a break targeting 155.13. The Fibonacci retracement from 152.89 to 159.03 places the 0.382 level at 156.69. ATR14 is 77 pips.
Key Lines on the 4-Hour Chart
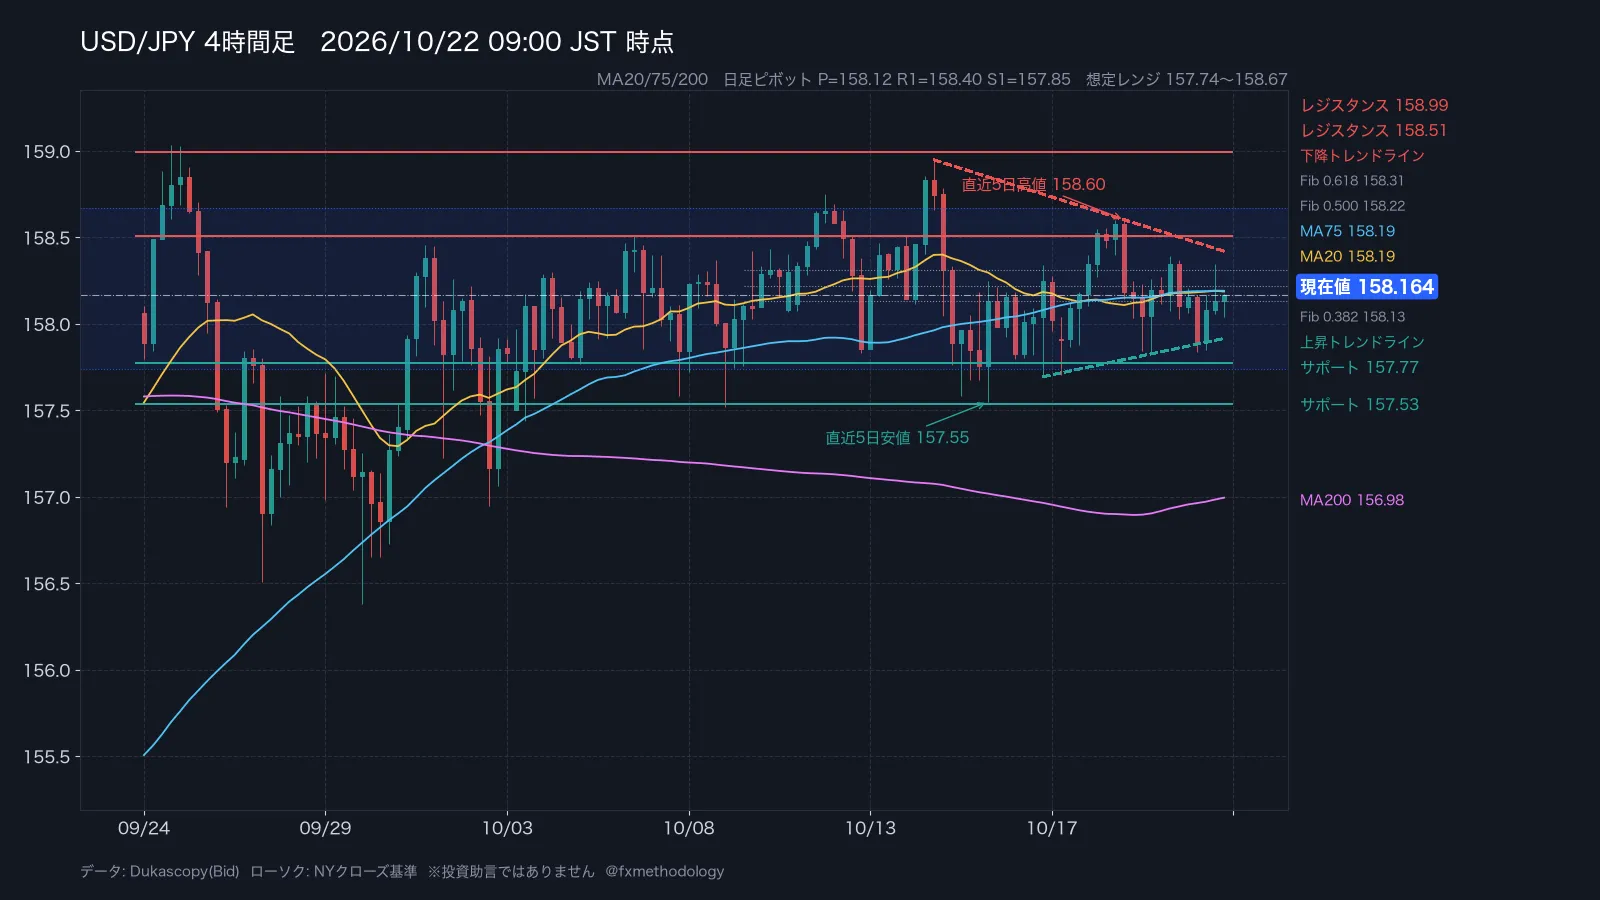
The 4-hour chart also shows three lines crossing; the current price is below MA20 (158.19). On the upside, 158.51, with a breakout above 158.99. On the downside, 157.77 and 157.53 sit in sequence. The automated drawn downtrend line is at 158.44 and the uptrend line at 157.90, forming a tight squeeze. ATR14 is 28 pips, relatively narrow.
Connecting Indicators and Charts
The focus is the 21:30 US initial jobless claims. Until then, a 157.74–158.67 range is likely to be watched. Daily pivot is P at 158.12, with R1 at 158.40 and S1 at 157.85; the current price is slightly above P. If the indicator data breaks above 158.67, the next target could be 158.99; if it breaks below 157.74, the path toward 156.38 becomes more likely.
Also in the Video | Morning Fixed Observation for USD/JPY

Answer for the Previous Business Day
It was a pass. Yesterday’s close of 158.13 stayed within the expected range of 157.83–158.85, aligning with the main range for the day. The price range was limited to 55 pips, forming a bearish candle without a clear directional bias.
Yesterday's USD/JPY closed at 158.15, down 0.03 from the previous day, with a price range of 57 pips. It opened at 158.17 and barely moved, staying within the high of 158.39 and the low of 157.82 for the day.
Verification Data
After the US initial jobless claims release, the 1-hour average USD/JPY range (out of 158 observations) is 49 pips, and the share of the initial direction persisting after 1 hour is 77%. This is surprisingly straightforward for a weekly indicator.
The up-day rate after touching MA200 from below (last 10 years, 105 instances) is 49%, with an average move of +2 pips. Since there’s little directional bias, it seems reasonable to wait for a reaction at the level^^
Today's Question
Between 158.67 and 157.74, which do you think will be tested first?
If you’d like, please tell me with a Like or a comment.
Content from FX Methodology Institute published on GogoJungle


※ The verification uses USD/JPY 1-hour data from January 2016 to March 2026. It does not indicate future performance.
Indicator data: Independently edited based on Forex Factory / Tradays. Price: Dukascopy (Bid) (as of 2026-10-22 09:00)
※ This is Stacking’s personal view. Please make investment decisions on your own.