
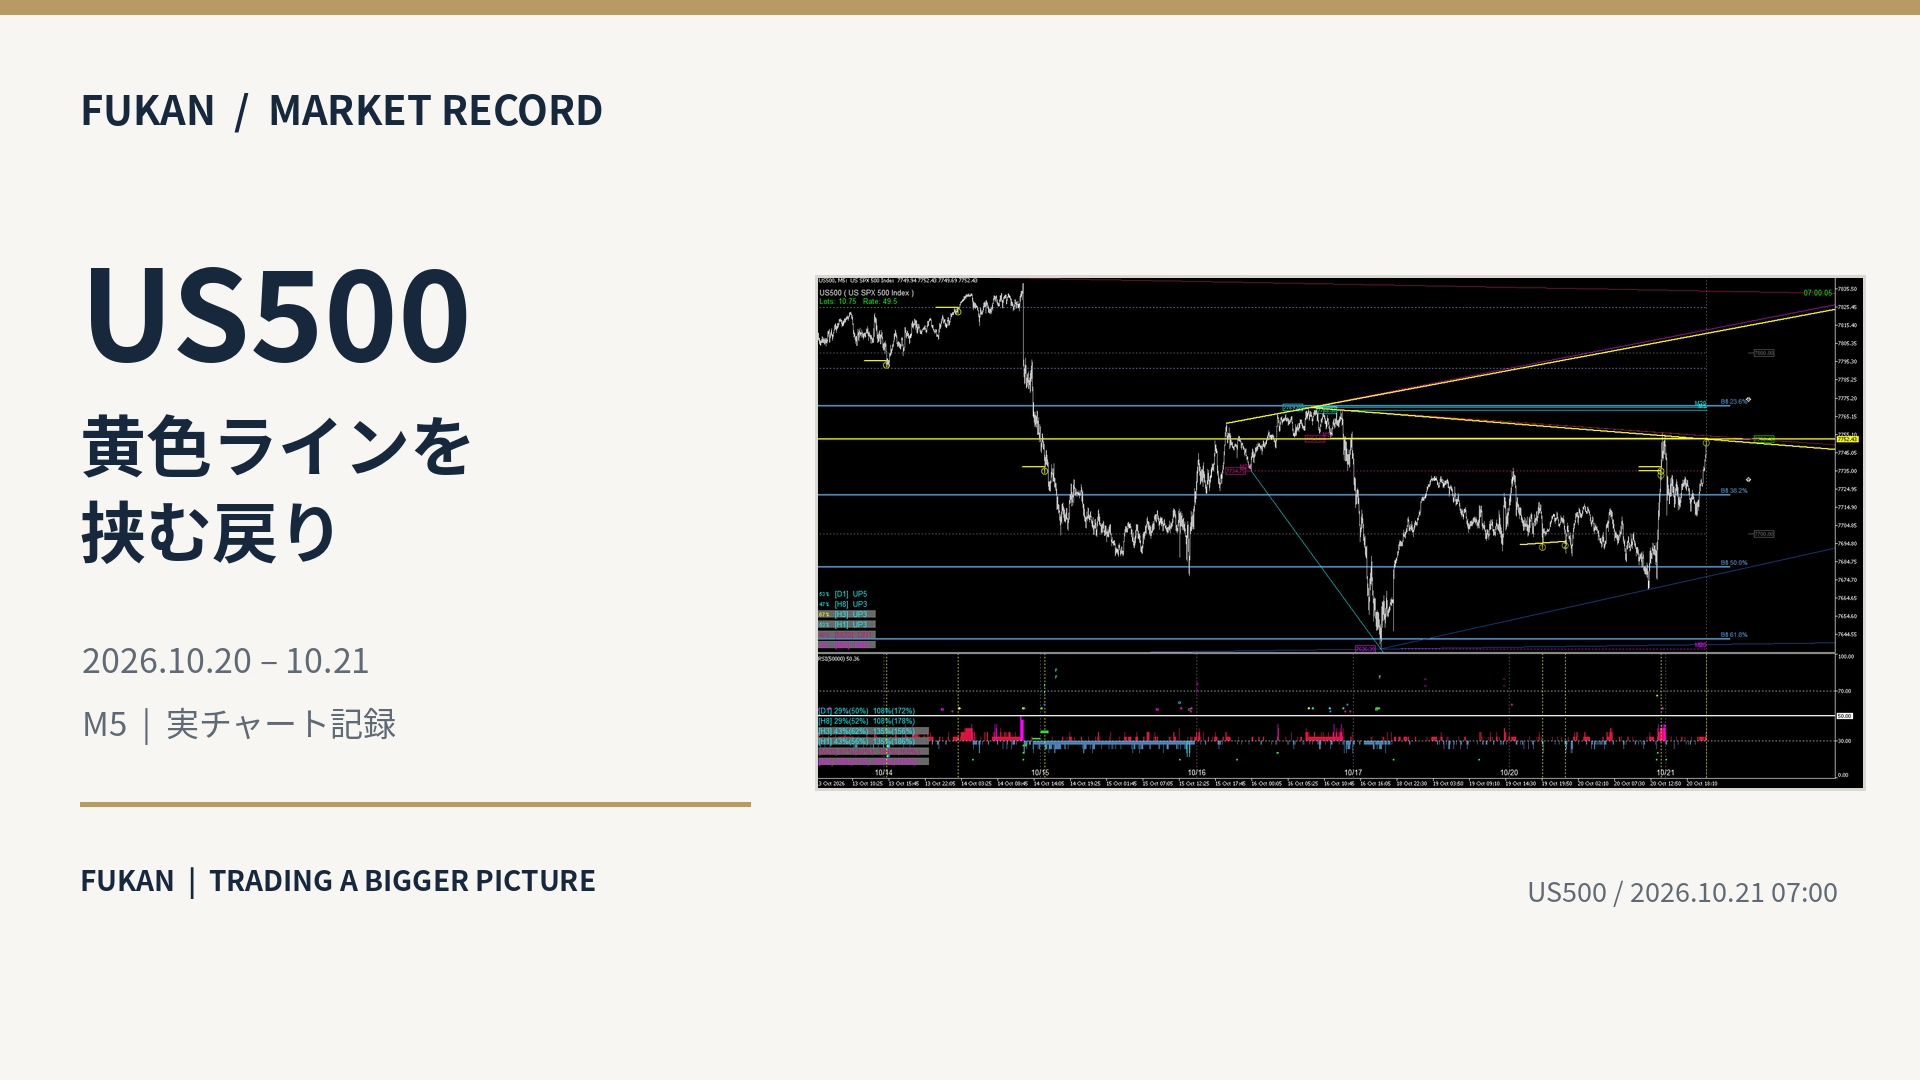
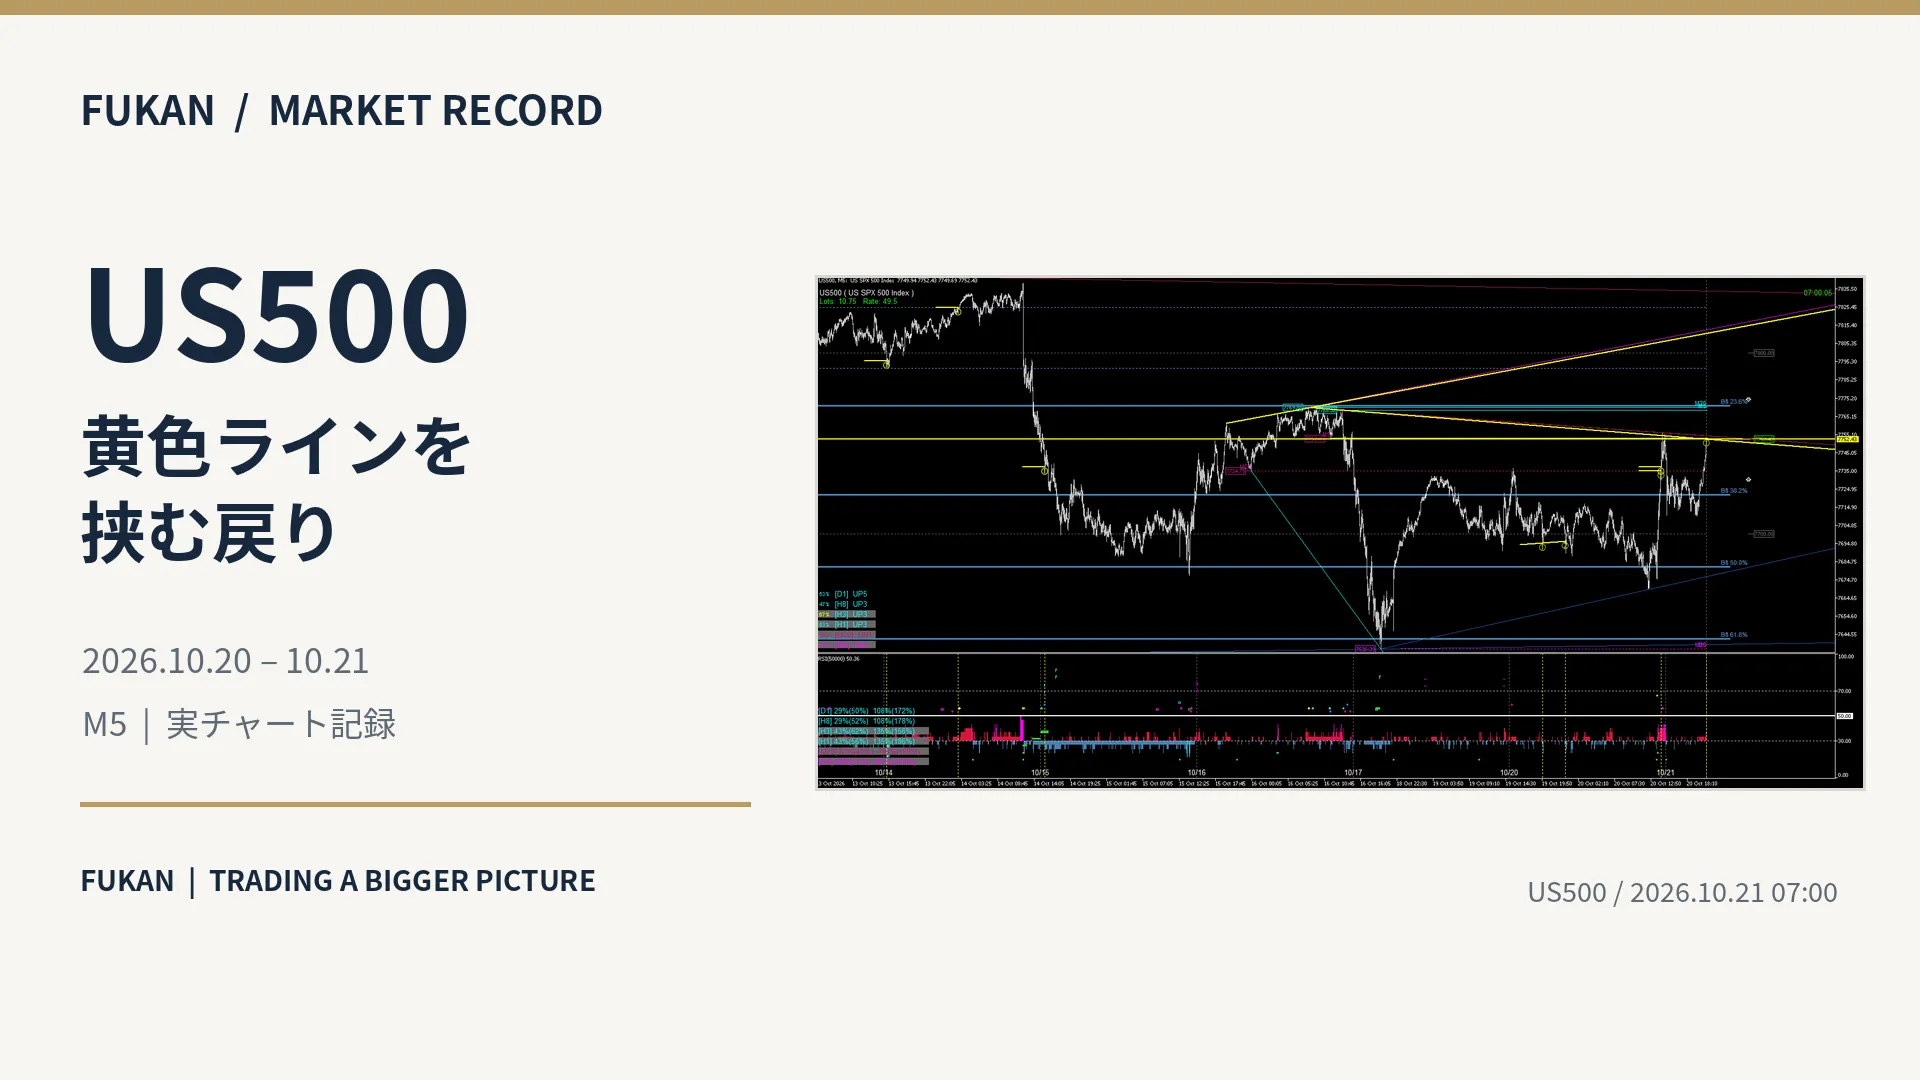
US500 | The pullback between the yellow lines — Support and resistance from October 20 to 21
FUKAN / MARKET RECORD
US500 | Retracement Encircled by Yellow Line — Support and Resistance from October 20 to 21
US500 M5 chart captured from October 20 to 21. From the lower support zone to the upward diagonal line, then again to the yellow horizontal band, the position relationship between price and level has shifted.
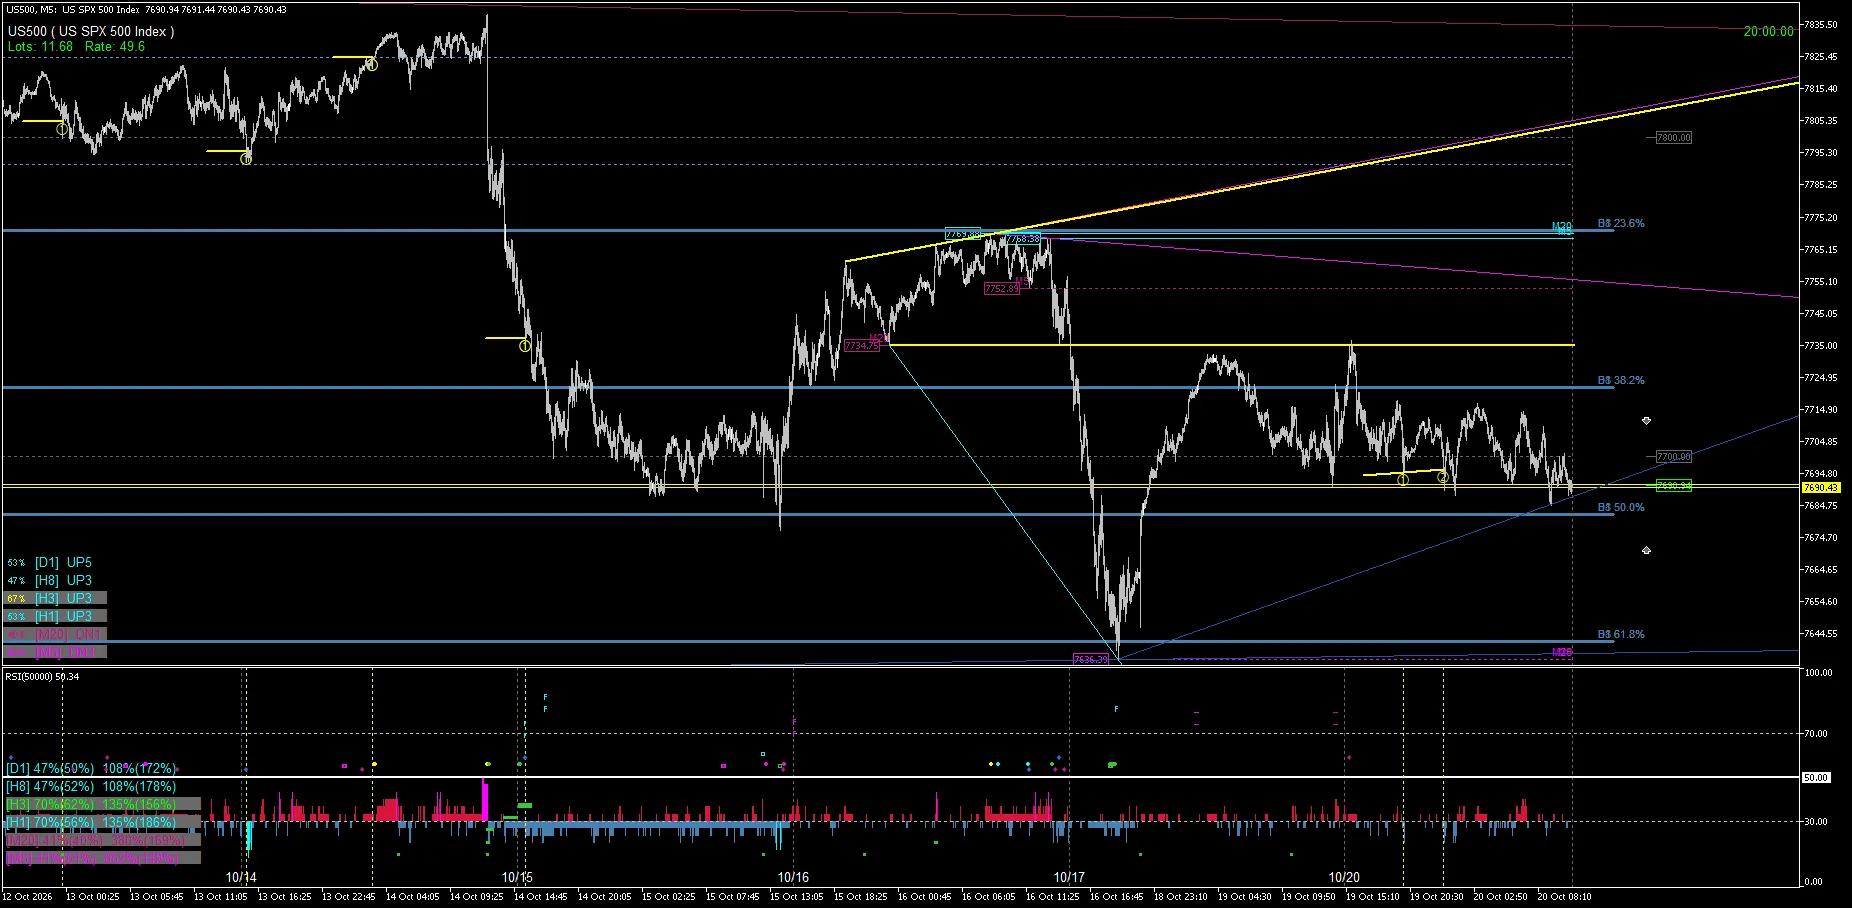
01|2026-10-20 20:00 Lower Support Zone
Toward the end of the 20th, price overlapped with the yellow horizontal band near 7,690. The blue upward-sloping line is approaching the same price area.
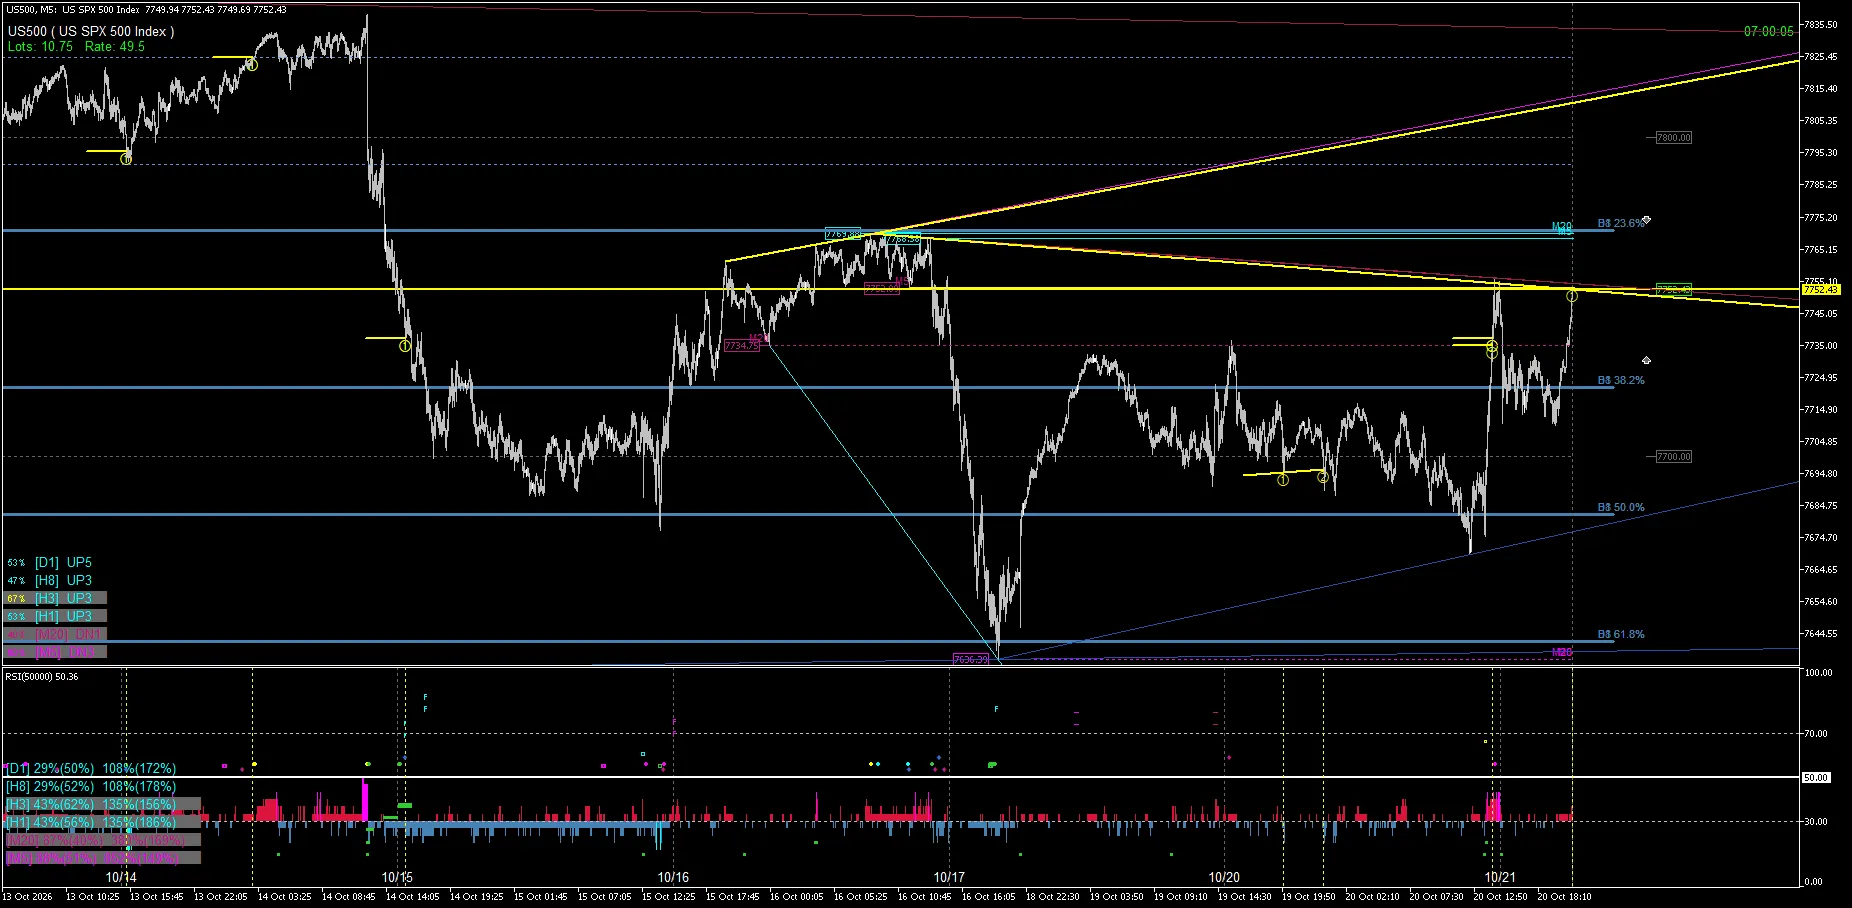
02|2026-10-21 07:00 Near the Upper Line
In the morning of the 21st, price approached the yellow horizontal band near 7,752. A downward-sloping diagonal line and a yellow circle mark are visible.
03|2026-10-21 11:00 Below the Upper Band
In the 11 o'clock image, price is located below the aforementioned upper band. The distance between the upper diagonal line and the lower horizontal band can be read.
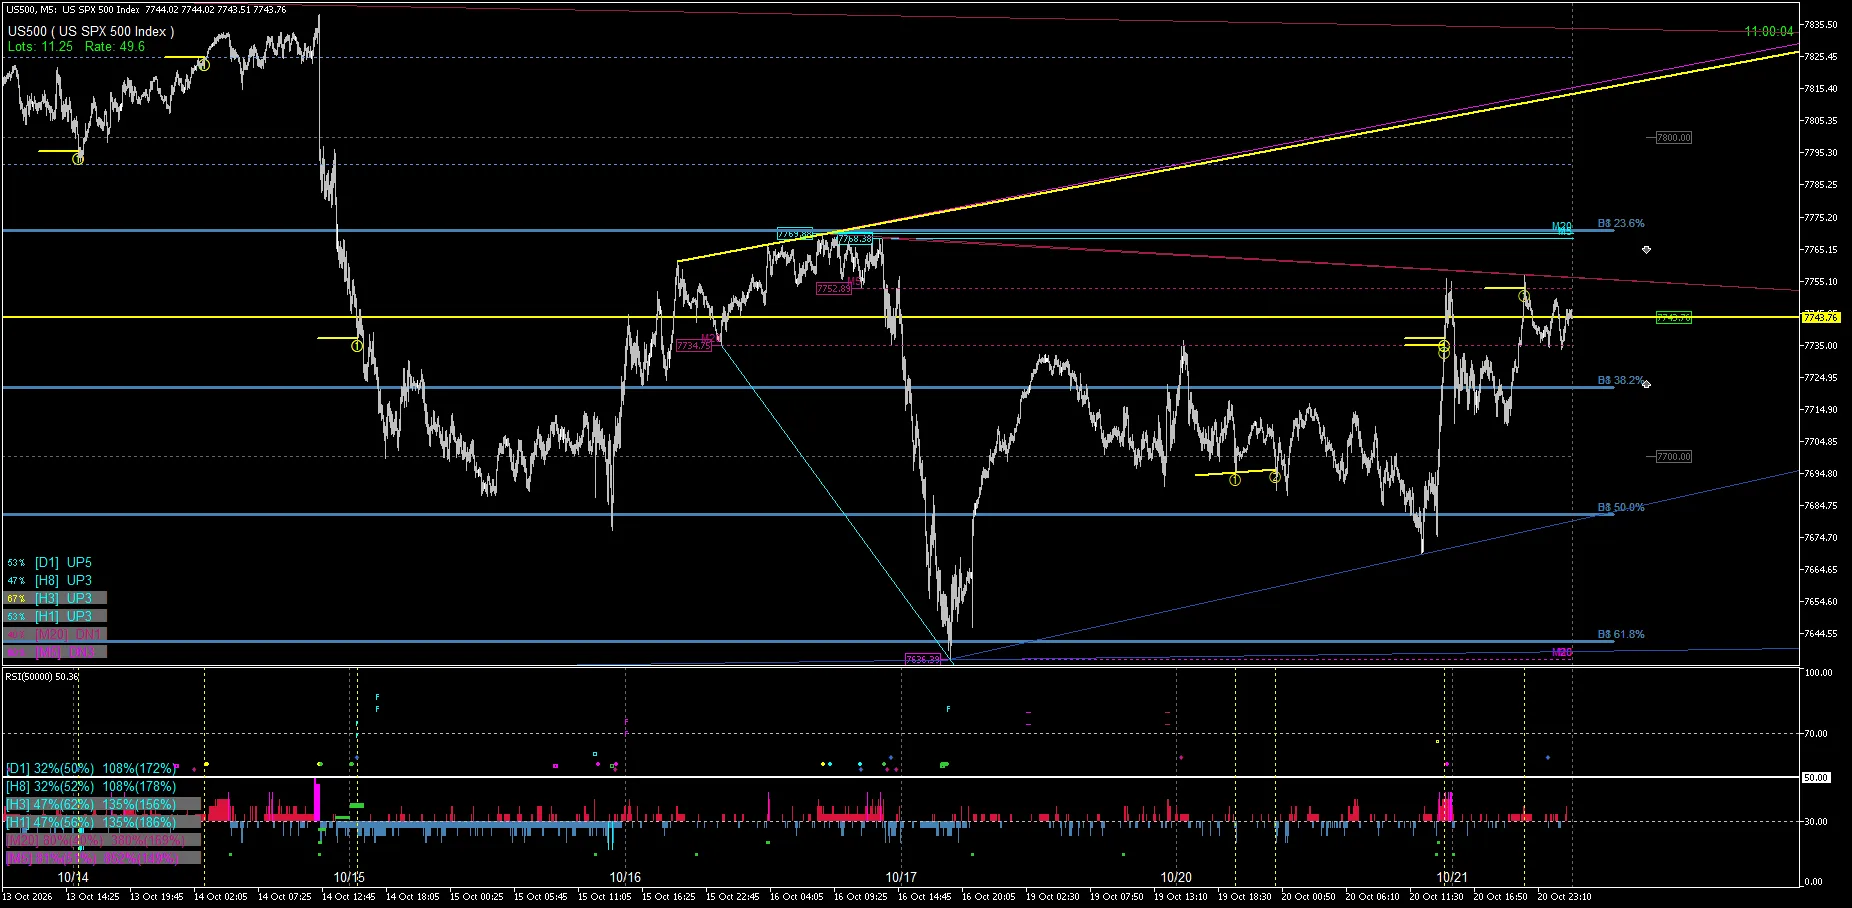
04|2026-10-21 15:52 Re-contact with Yellow Horizontal Band
In the 15:52 image, there is a yellow circle mark near the yellow horizontal band around 7,734. The upper diagonal line remains visible.
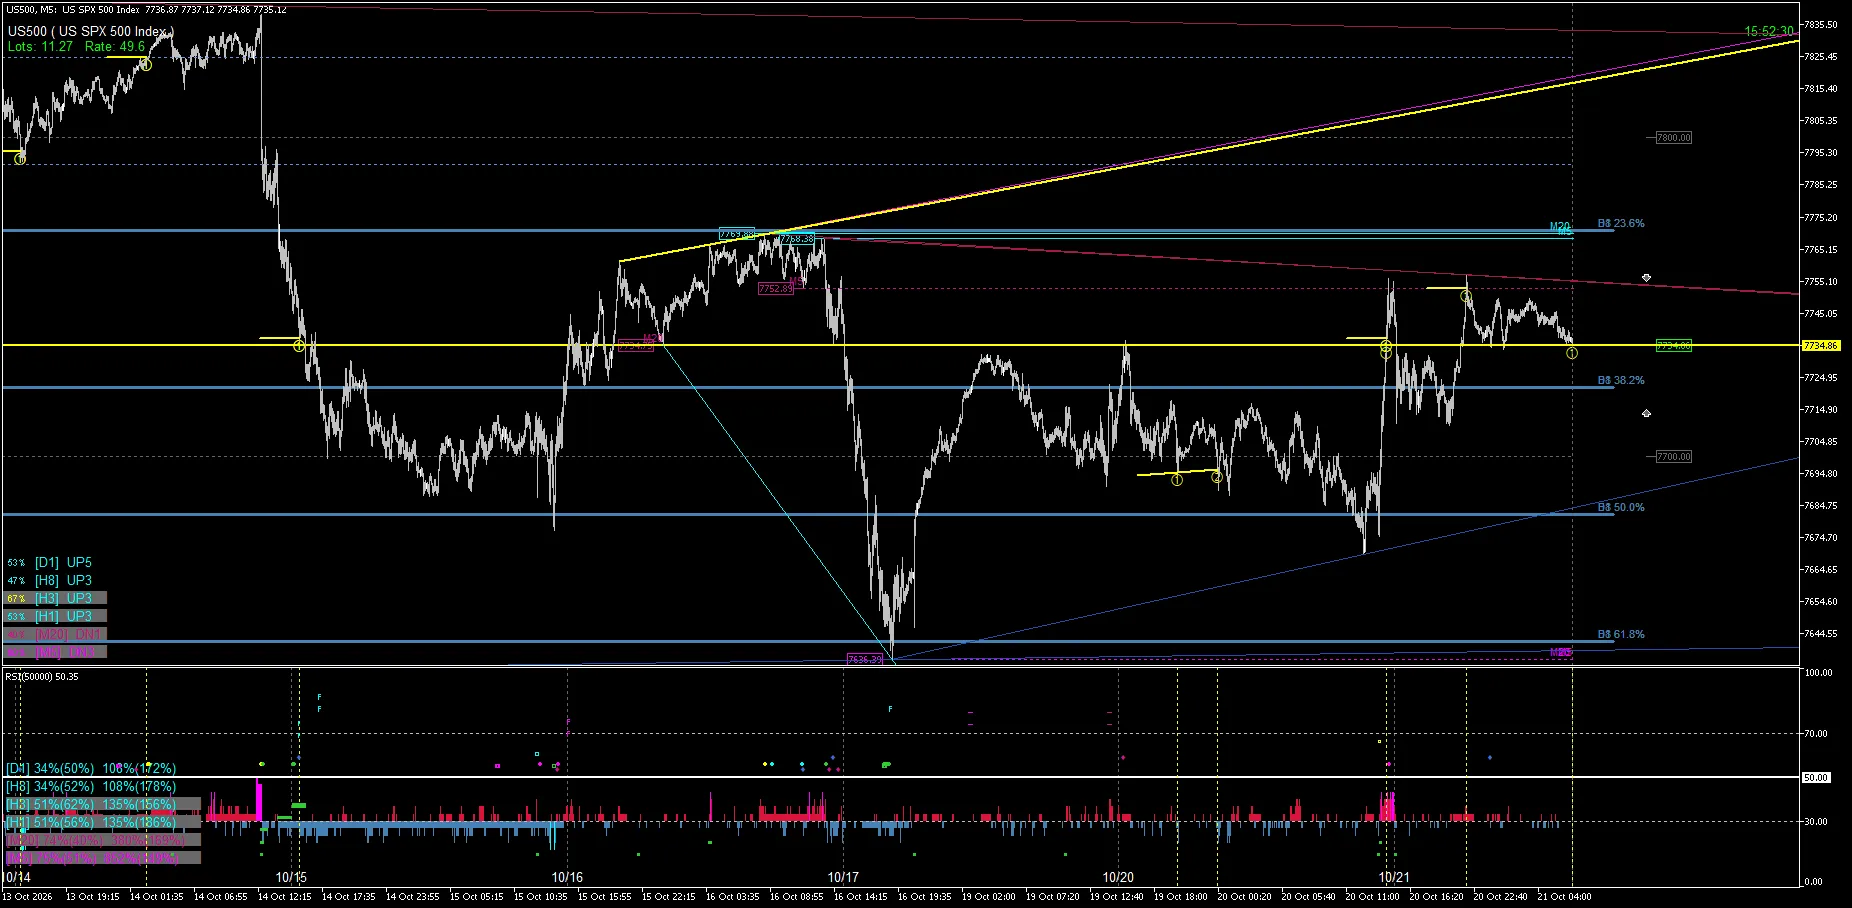
The spatial relationships among the yellow circle mark, the horizontal band, and the diagonal line can be compared across the four capture points.
For details on the function of FUKAN and the 7-day Trial, please check the product page.
This article is a market observation and analysis record and is not investment advice or a buy/sell recommendation. It does not guarantee future price movements, profits, or win rates.