

[AI Prediction Verification] The Aftermath of the Gold Strategy October 21st | Practical Verification of Buy on Dips and Stop-Loss Judgments
?This article was posted on October 21, 2026=>Latest related articles?
Last timeAI Analysis Visualizerused to forecast GOLD.
 | 【AI Forecast】Gold Next Week Strategy October 18 | Specific entry price, stop loss, and take profit lines Forecast using MT5 AI Assistant and AI Analysis Visualizer. Analysis content Target: GOLD (XAUUSD equivalent, two-decimal display) Data: MT5 GOLD daily and 4-hour charts, economic calendar (server time=UTC+3, Japan time=+6 hours) ... |
In four scenarios, select “? Long strategy ①: dip limit (main)” to enter and place limit orders (below and above the green line)
- Buy Limit ①4152.00(0.5 lots assumed)
- Buy Limit ②4145.00(0.5 lots assumed)
- Stop loss (SL): 4124.90
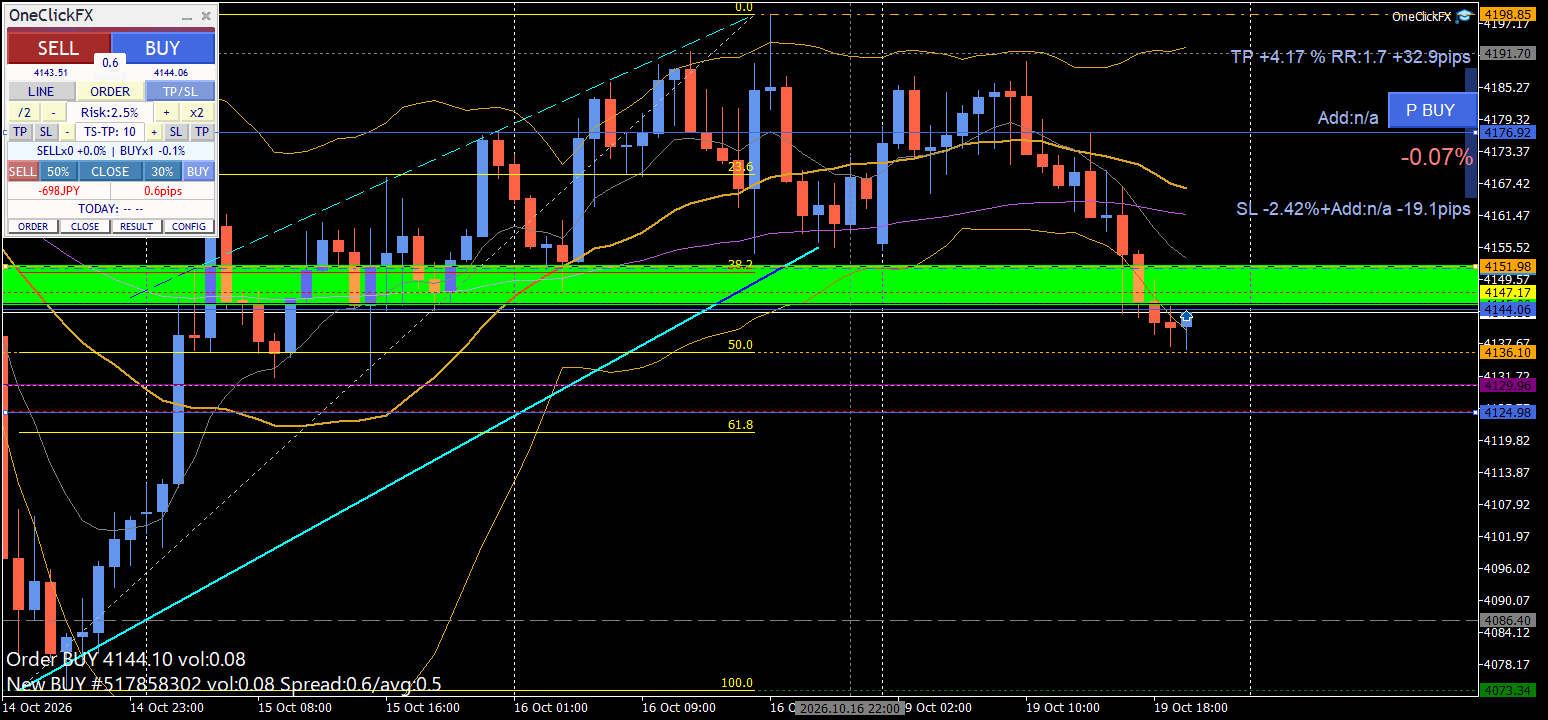
However, it did not rise.
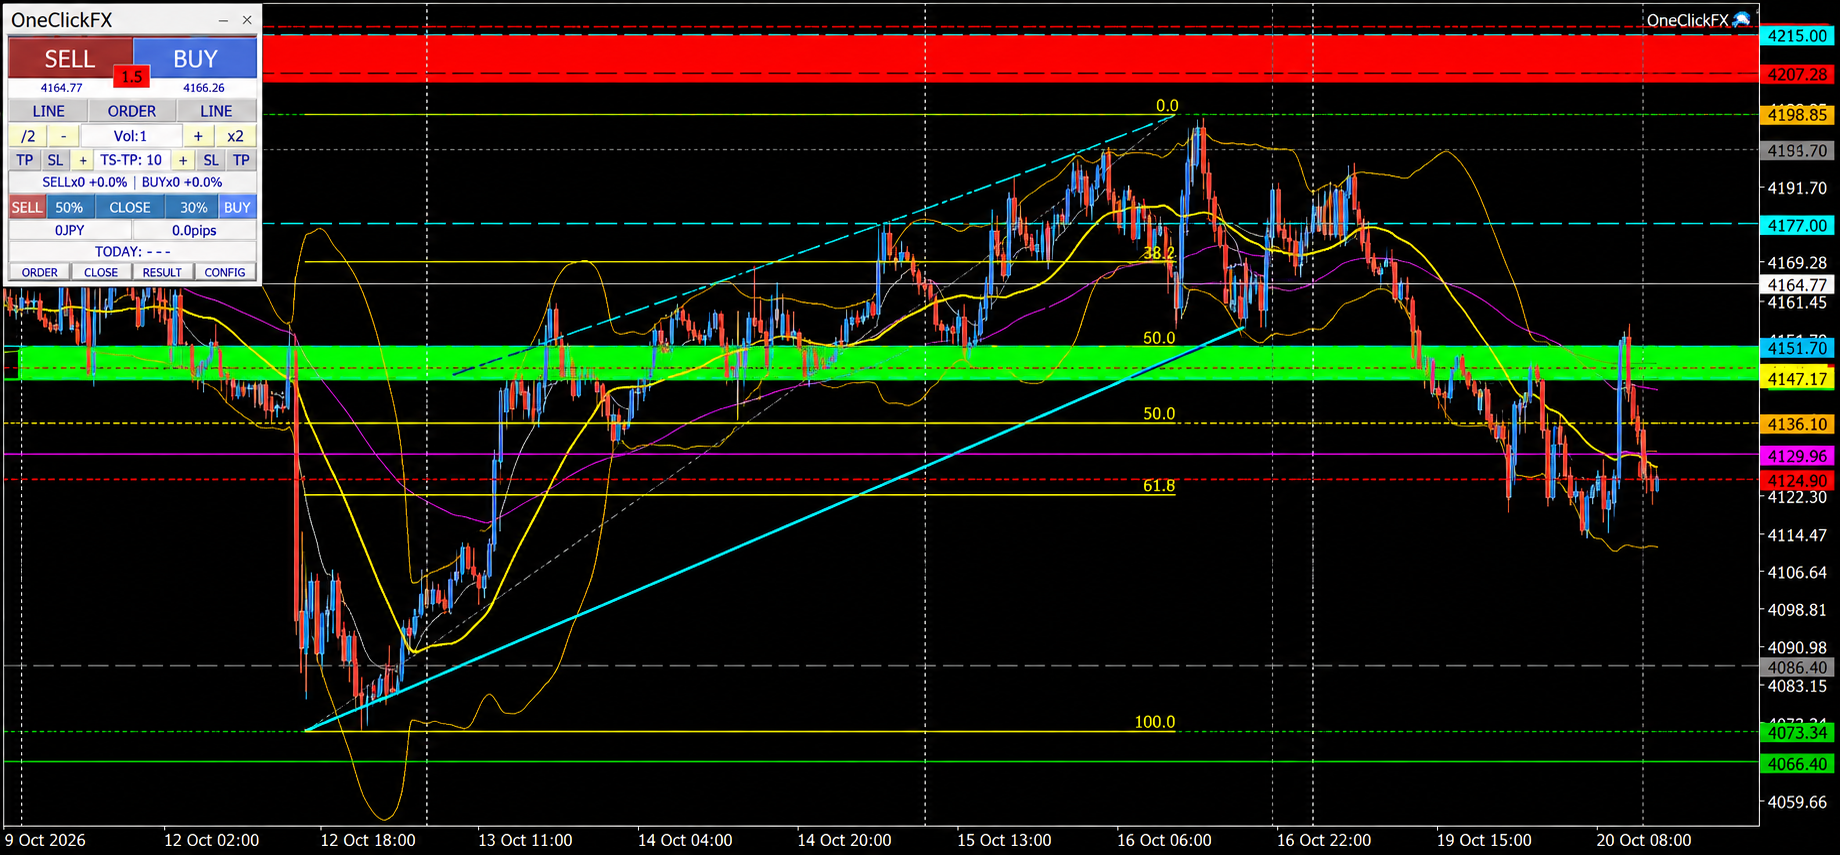

Again, I’m asking MT5 AI Assistant.
Q: Should I cut losses?
① Should cut losses — Conclusion: If following the plan, exiting (stop) is coherent
Reason (conditions pre-decided in the plan, both occurred)
- SL 4124.90 (the rule-based exit line) breached:Current price 4118.70, from SL−6.20 dollarsdown
- The long premise also broke at “4129.96 (rising low on 4-hour chart)”=the structure collapsed. The plan stated “if daily close below 4129.96, long is invalid,” and that condition has been triggered
Estimated amount (0.13 lot = 13 ounces)
- Average 4147.32 → 4118.70:−28.62 dollars/ounce ≒ −372 dollars ≒ −58,900 yen(unrealized loss −67,186 yen = total of 2 positions)
- Difference from “cutting at SL” isonly −6.2 dollars ≒ about 12,700 yen. Cutting here would hardly increase losses
- On the contrary, if not cut and allowed to fall to4111.60 (today’s low), the additional risk would be about −7 dollars ≒ 14,600 yen.If it fell through to 4073.34 without a stop, the additional risk would be about −45 dollars ≒ 92,500 yen (this is to be avoided)
Options
- A: Close all positions at market now(Rule-abiding. Losses are realized, but risk of further loss is eliminated)
- B: Hold selectively, mechanically close when H1 close below 4111.60(If price returns, targets 4129.96–4147.30 for a breakeven exit. The average 4147.32 is the upper bound of the return)
- Do not do: averaging down. Averaging down on a declining price is a typical pattern that enlarges losses
GOLD long incurs negative swap (total −1,296 yen) and costs accumulate just by holding.
Q: How about the latter half of the week?
② Analysis for the latter half of the week
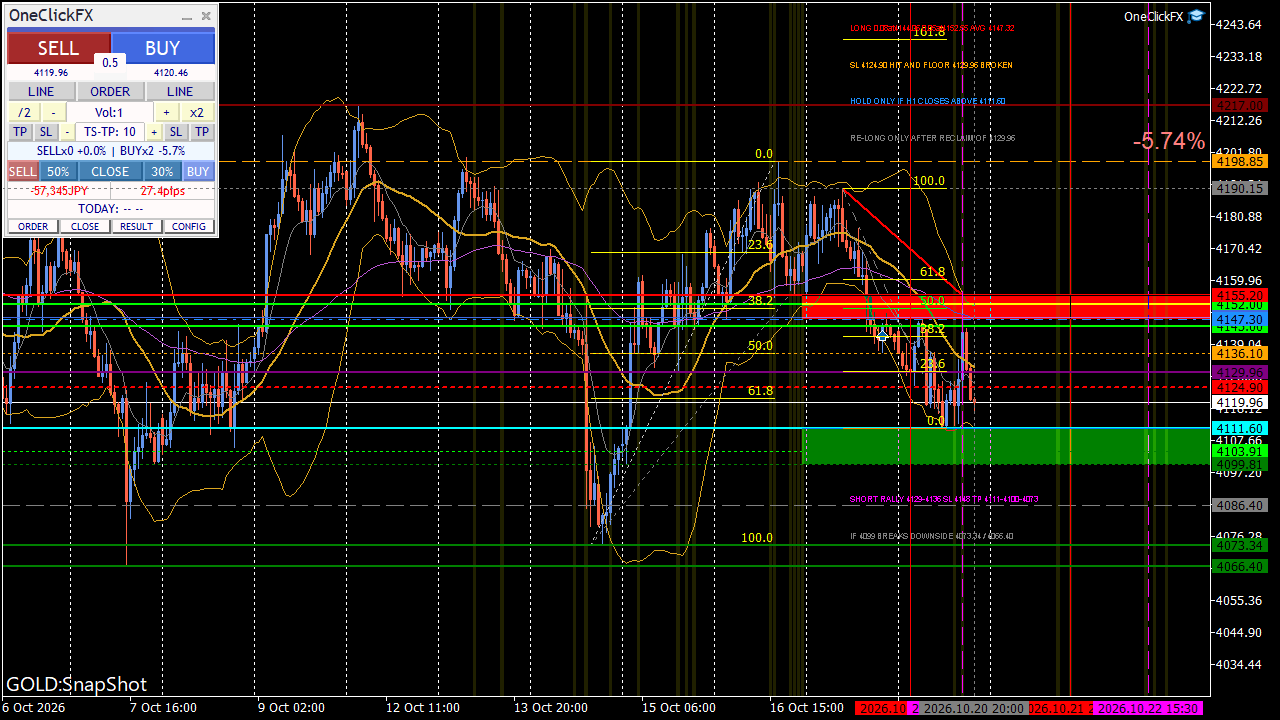
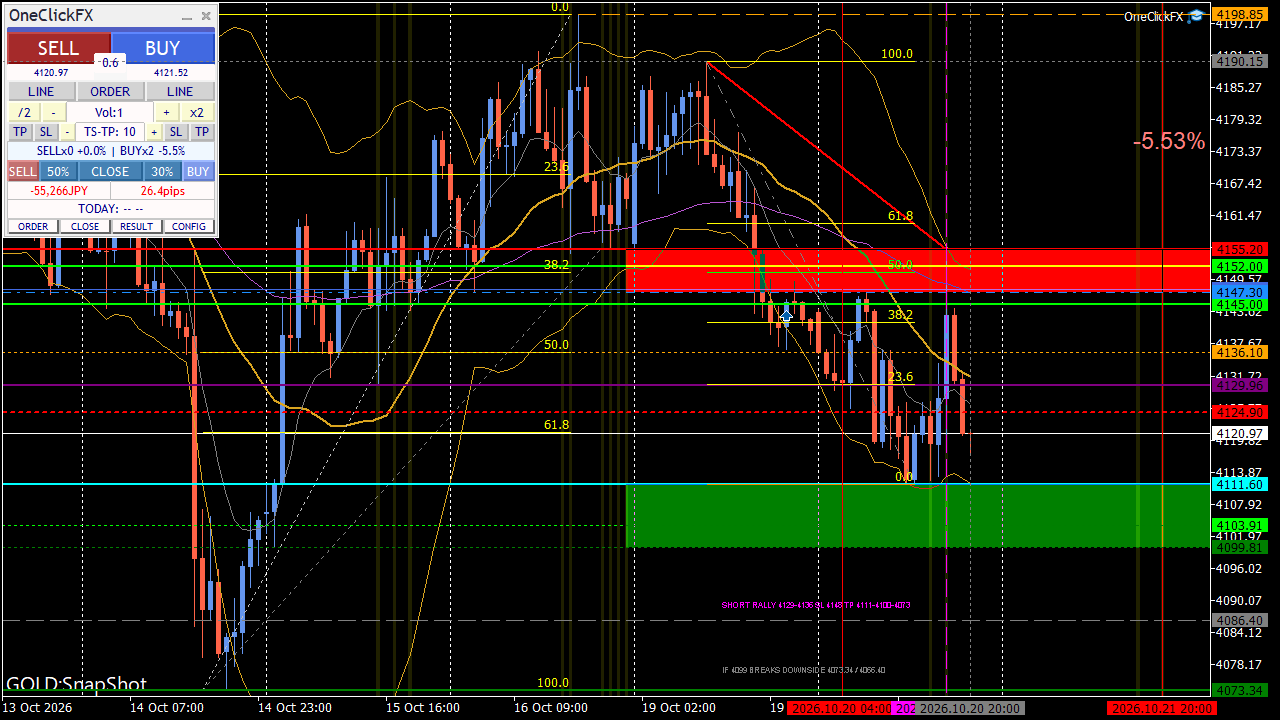
What happened (10/19–10/20)
- Mon: rose to 4190.15 → pulled back to 4136.57 and closed at 4140.15 (upper rejection candle) )
- Tue: U.S. housing data worsened significantly (housing starts1.221M vs 1.468M expected, pending sales−7.3% vs −0.9%)→ at 15:00 surged to4155.20→ thenfell back to 4111.60
- Weak data (US indicators worsening) and good data still sold off =selling pressure at the highs
- Dollar is weak against euro (EURUSD 1.1210→1.1260) yet gold falls =Gold’s own weakness (position adjustment)
Technical
- Below the range lower bound 4129.96, and below daily 10-day line (~4147.0) and 20-day line (~4169.5)breached
- Retracement of the up move (4073.34→4198.85) 61.8% retracement4121.28 also breached, next level is78.6% = 4100.20
- Higher prices are trending lower: 4190.15 → 4155.20 (downtrend line formed)
Levels
- Upper prices (retracement-selling candidates):4129.96 (broken floor turned into resistance) /4136.10 /4147.30 (average entry price) /4155.20 (Tuesday high = short invalid) / 4190.15
- Lower prices:4111.60 (today’s low) / 4103.91 /4099.81 / 4086.40 /4073.34 /4066.40(major lows)
Dominant scenario (main) = selling on rallies (continuing downtrend)
- Sell if rejection of the 4129.96–4136.10 retracement occurs.SL 4148.00 (above the downtrend line and today's high)TP1 4111.60 / TP2 4099.81 / TP3 4073.34
- Range: SL −16 to −19 dollars, TP1 +18 dollars, TP2 +30 dollars, TP3 +57 dollars (roughly 1:1.0 / 1.8 / 3.2)
Sub-scenario = rebound (conditional)
- Only if H1 close recovers 4129.96, then long bias returns. Target 4147.30 → 4155.20 (breaks if exceeded, indicating structural repair)
- However, due to the FOMC, even if it retraces, upside is limited
Remaining events (Japan time)
- 10/22 (Thu) 02:00 U.S. 20-year Treasury auction(previous yield 5.42%)— if weak, yields rise → headwind for gold. Largest volatility driver this week
- 10/22 (Thu) 21:30 U.S. Initial jobless claims( previoous 199K / forecast 198K )
- 10/23 (Fri) 23:00 University of Michigan consumer sentiment(watch for 1-year inflation expectations 4.7%)
- 10/29 (Thu) 03:00 FOMC/10/29 (Thu) 21:30 PCE— Next week. Until then, large directional bias is unlikely,upside remains heavy but rebounds (short covering) after declines are commonin the market
⚠️ All are probabilistic discussions, not guarantees. Scenarios can reverse easily depending on data results.

Q:When rechecking, there was a real falling scenario as the main one, right!
First, the issue is how it was written
What I wrote is this.
? Short Strategy ②: Break below 4129.96 (main falling scenario)
The intention was to indicate “the main fall among bearish setups,” but readers might interpret it as “main = the main scenario.” And in the same article it stated “the main is to buy on dips.”It was my mistake to present it inconsistently. My own assessment was “range continuation with a slight upside,” and the downturn was treated as secondary. If so, I shouldn’t have labeled it as the “main.”
Then, why did I choose the long (the reasons at that time and why it failed)
Reasons for choice
- Weekly long lower shadow, 4-hour rising lows, above the 10-day line (4151.6), alignment with pivot 4151.70, dollar soft
Points relied on too much (this is the real cause of the failure)
- Higher timeframes are bearish:Highs fell from 4696.53 → 4226.65 → 4217.00, closes below the daily 20-day line. It was a buying the dips within a downtrend
- Retracement at 4215.11 (23.6%) had stopped= retracement limit had already been shown
- A week with light fundamental catalysts before the FOMC= movement driven by the demand and positions rather than fundamentals
- “Pivot, moving average, and wicks”are effective in a range, but less so in a downtrend
Level setting was correct(4129.96 is the critical line, that reading is correct). What was wrong wasthe weighting of probabilities.

Editorial note: the importance of rules is the same for AI
This trade outcome reinforced the importance of rules even more than the forecast being wrong.
The buy plan clearly stated: “If H1 closes below 4129.96, cancel the limit order (buy becomes invalid).” However, despite this condition, the stop-loss line recovered and was left alone. When it rose further, the second limit order was filled by a wick. As a result, losses doubled.
If I had exited according to the rules, losses could have been minimized.A stop loss is not just about admitting defeat; it is risk management to protect capital and prepare for the next opportunity.
Not only predicting AI forecasts, but how to apply presented scenarios and rules in actual trading. The potential of AI analysis is indeed significant.