
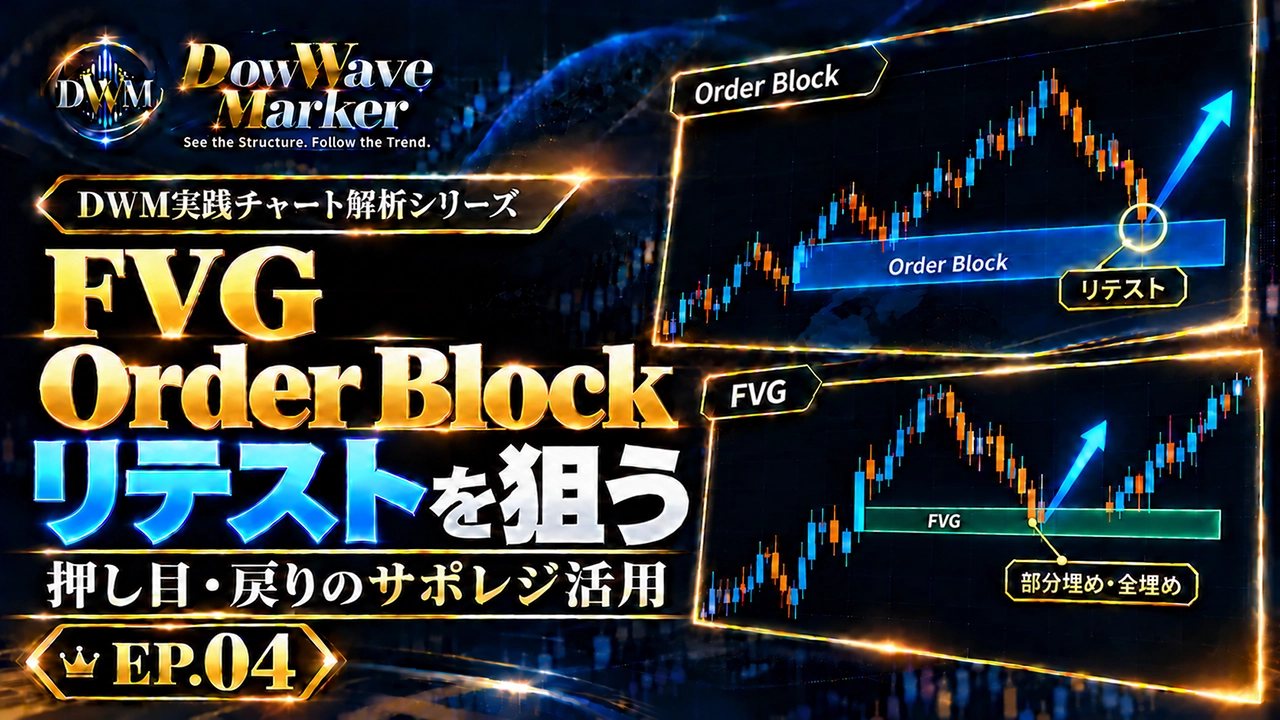
How to Use FVG・Order Block? Reading Push Breakouts and Pullbacks with Retests and Supported Resistance [DWM Practical Chart Analysis EP.04]
DOWWAVE MARKER | DWM Practical Chart Analysis Series EP.04
How to Use FVG and Order Block?
Reading with retests and S/R, candidate zones for pullbacks and back-moves
Centering on the USDJPY 1-hour chart, explaining partial and full fillings of FVG and retests to Order Block. Also introduces the meaning of confirming higher-timeframe zones using GOLD on the 4-hour and daily charts.
When waiting for a pullback or a rebound, where on the chart should you focus?
This time we coverFVG and Order Block as candidate zones for support/resistance that observers watch for price returningas a use case.
In EP.03 last time, we read ongoing and turning Dow waves from CHoCH/BOS and new highs/lows.
This time we overlay FVG and Order Block on that market structure,“where to wait, and what to confirm”in concrete terms.
Confirm market structure → select candidate zones → wait for retest → track reactions after touch and new highs/lows.
We will organize the view of pullbacks and rebounds along this flow.
DWM PRACTICAL CHART ANALYSIS / EP.04
Watch: How to use FVG and Order Block in video
Movements away from zones, retests, and subsequent reactions are shown in sequence with chart zooms and markers.

01 / FVG & ORDER BLOCK
Viewing FVG and Order Block as S/R candidates
FVG and Order Block are zones captured with different concepts.
FVG (Fair Value Gap)
Generally refers to the portion where the price ranges of the first and third candles do not overlap.
A zone that captures imbalances in price movement created by a strong move.
Order Block
Typically a zone based on a candle that started a major price move.
In the video, we use the zones shown by DWM to observe the reaction when price returns.
Both can be viewed as candidate supports/resistances for pullbacks and rebounds, i.e.,S/R candidatesto watch.
When price returns to the lower target zone, observe whether the decline is supported; when price returns to the upper target zone, observe whether the rise is contained.
Here, the termRetestrefers to price briefly leaving a zone and then testing it again. By checking the touch of the zone and the subsequent rebound or drop, you can organize price movement more easily.
02 / FAIR VALUE GAP
FVG: partial fill, full fill, and subsequent reactions
An upward FVG is the range between the high of the first candle and the low of the third candle where the two do not overlap.
A downward FVG is the range between the low of the first candle and the high of the third candle.
Later, price returns into the FVG and proceeds inside that area—this movement is described as “filling.”
In this video, two aspects are explained based on the reach of the wicks:
Partial fill
Price returns inside the FVG but has not yet reached the far edge.
Full fill
Price reaches the far edge on the opposite side of the FVG.
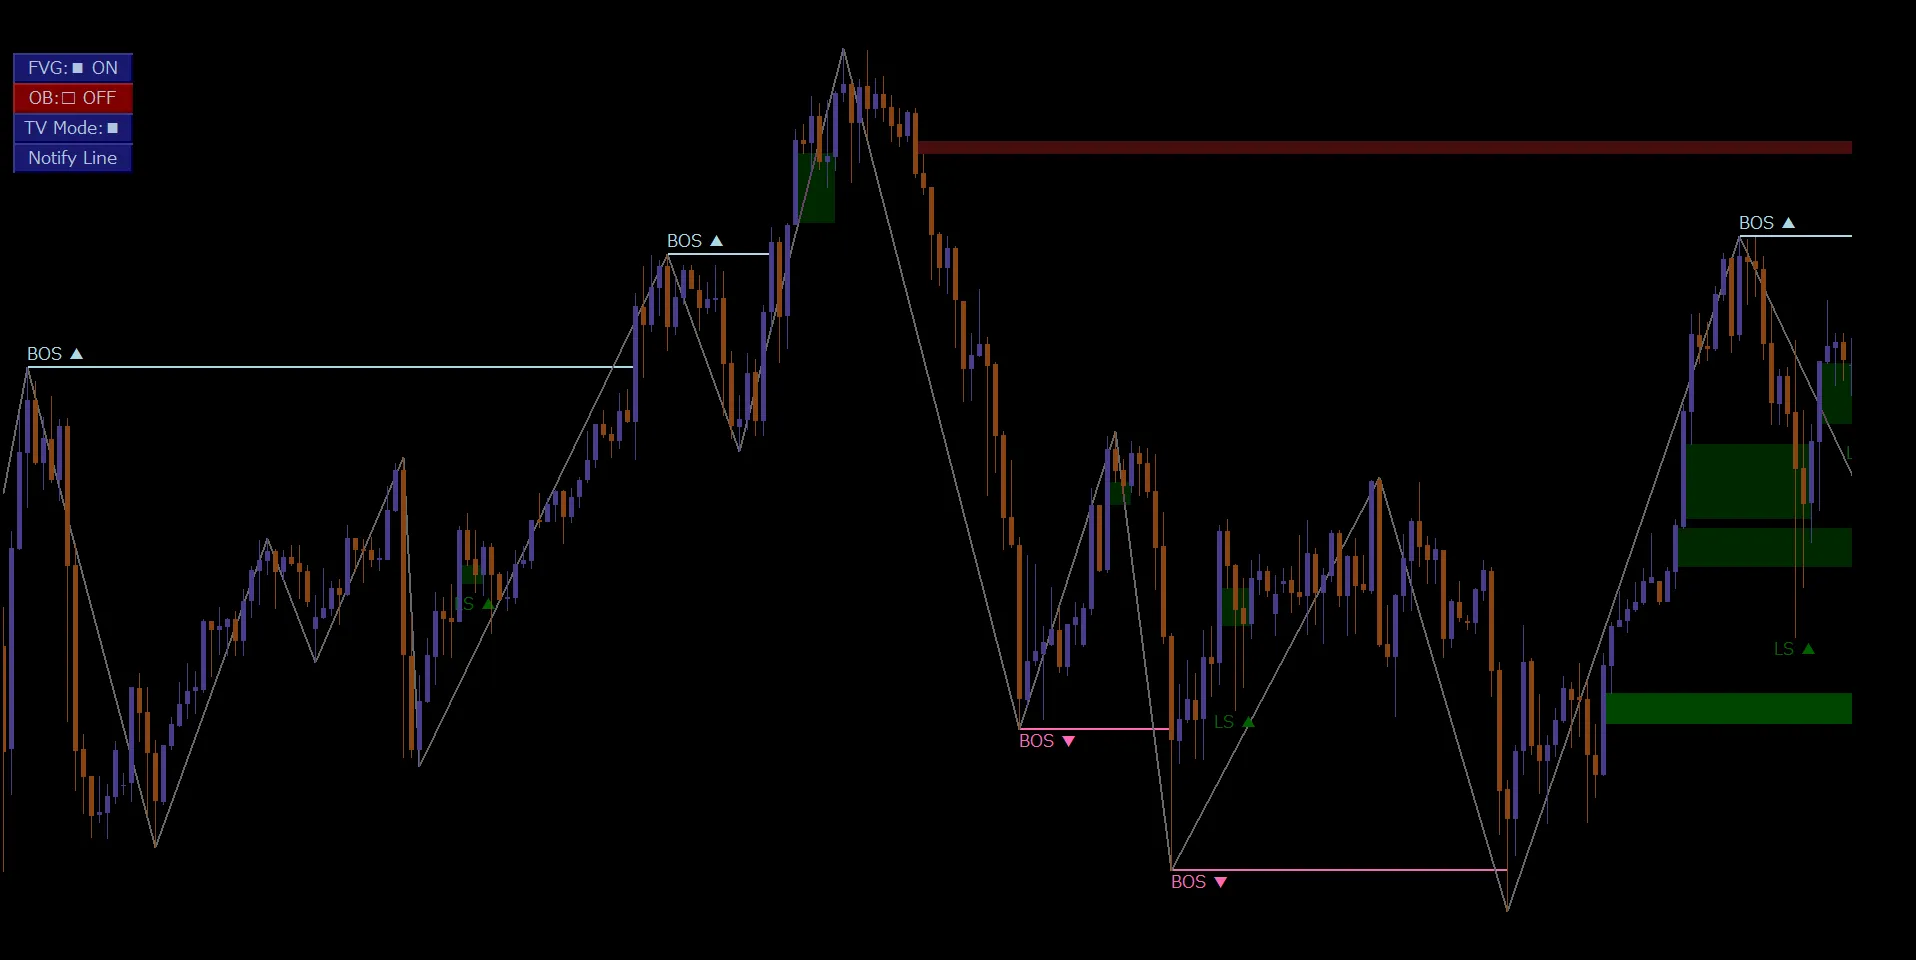
Note the green FVG formed on the upward move on the right and the price action after returning from the high into the zone.
USDJPY・1-hour: Return to FVG
In the USDJPY video, the green FVG is shown on the right side during an upward move.
After hitting a high and the price falling back into the displayed zone, it moves back up again.
In this example, we observe the touch to the displayed zone and the subsequent reaction.
The distinction between partial fill and full fill is explained with a schematic in the video that fixes the upper and lower edges of the original FVG.
With FVG, watch two things: “how much of the fill occurred” and “how it moved afterward.”
Separating the retracement depth from the subsequent reaction is the key.
03 / RETEST & REACTION
USDJPY・1-hour: Retest of the Order Block
In USDJPY’s Order Block, we compare responses as support/resistance between the lower blue zone and the upper purple zone.
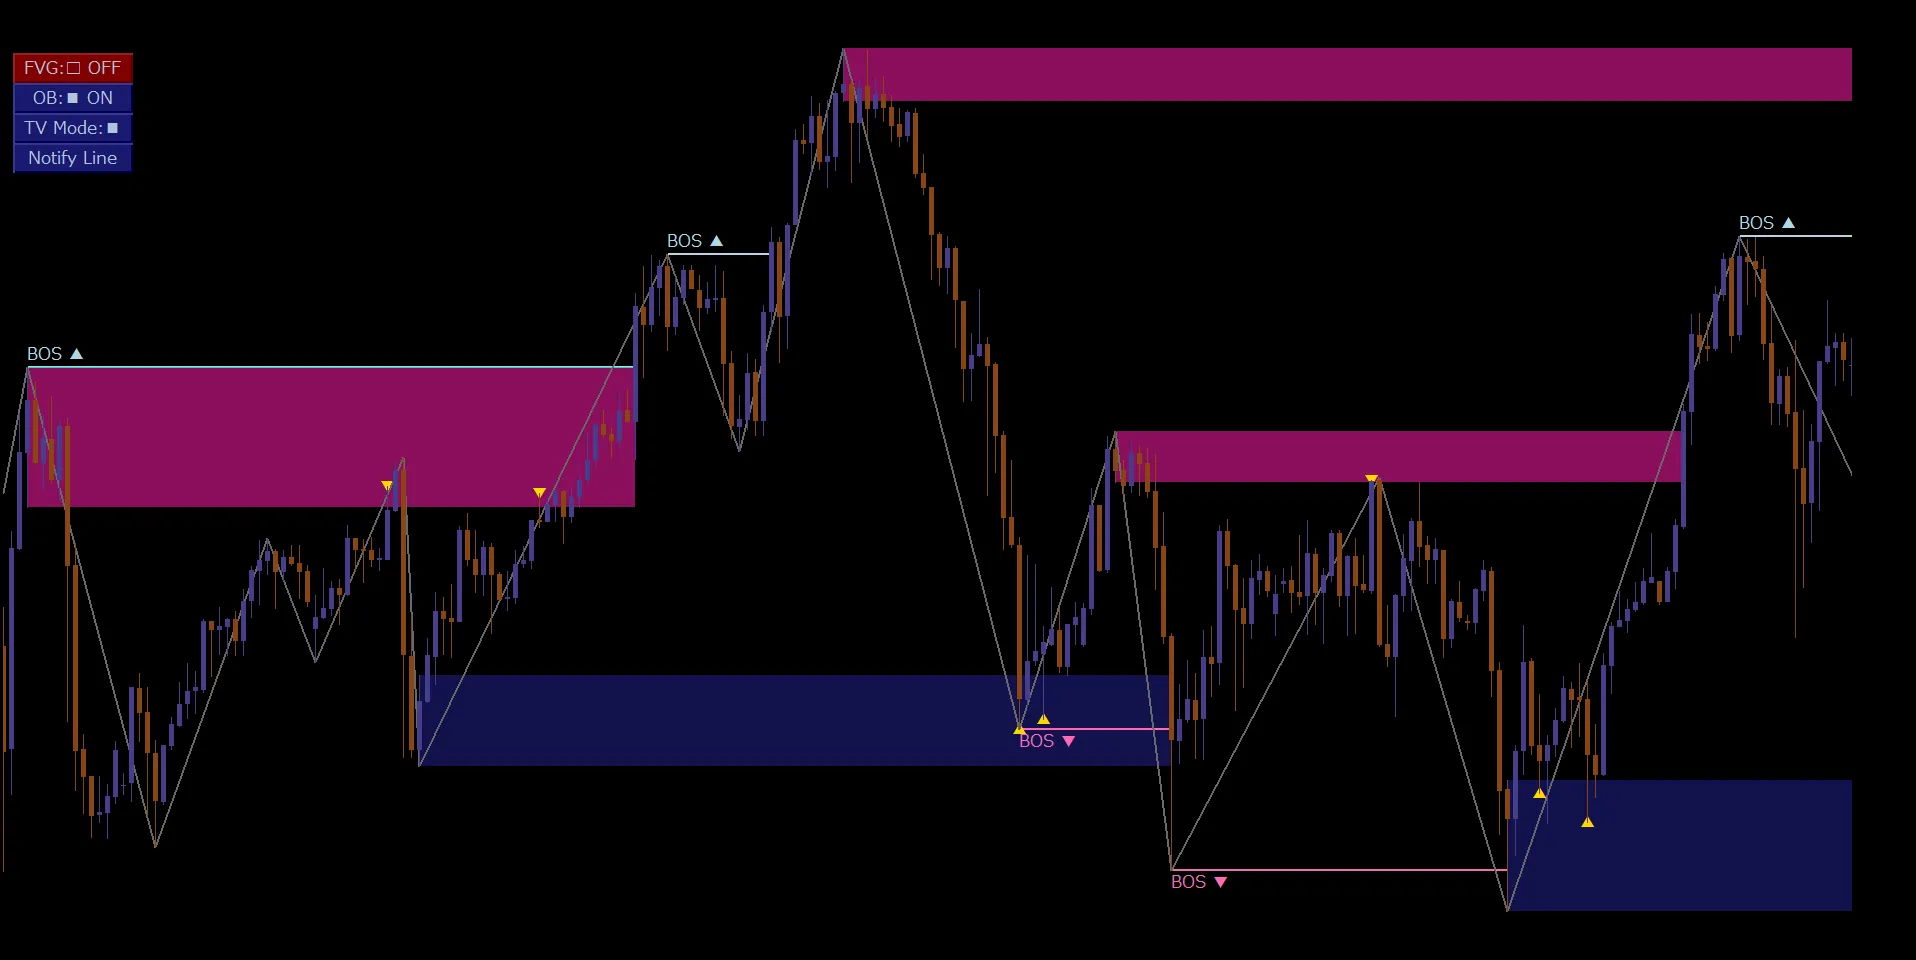
Check the blue zone at the lower center, the purple zone at the right center, and the blue zone at the lower right in order.
① Central-lower Blue Zone: Reaction as Support
Price initially rises significantly, moves away from the zone, then returns by dropping from the central high.
Wicks enter the zone, then price moves up toward the purple zone around the central-right.
This is an example where the lower Order Block acted as support.
Since there are also instances where price breaks below that same zone afterward, we continue to track the subsequent high and low after the reaction.
② Central-right Purple Zone: Reaction as Resistance
Prices that fell from this zone rise again and touch near the lower edge of the zone.
Afterward, the gains are capped and price declines toward the lower-right low.
Compared to the earlier support example, you can see the direction of return and how it moves away after touching.
③ Bottom-right Blue Zone: Retest Within a Pullback
From the low, price rises briefly, then returns to the blue zone with the wick entering inside.
In the video, this movement is captured as part of the same pullback, and then the price moves higher to the upper-right.
Move away from the zone → retest → react.
Pay attention to whether it touches the boundary or goes inside, to read the pullback/retracement pattern more precisely.
04 / REACTION & BREAKOUT
GBPUSD・1-hour: Reactions within the same zone and breakouts
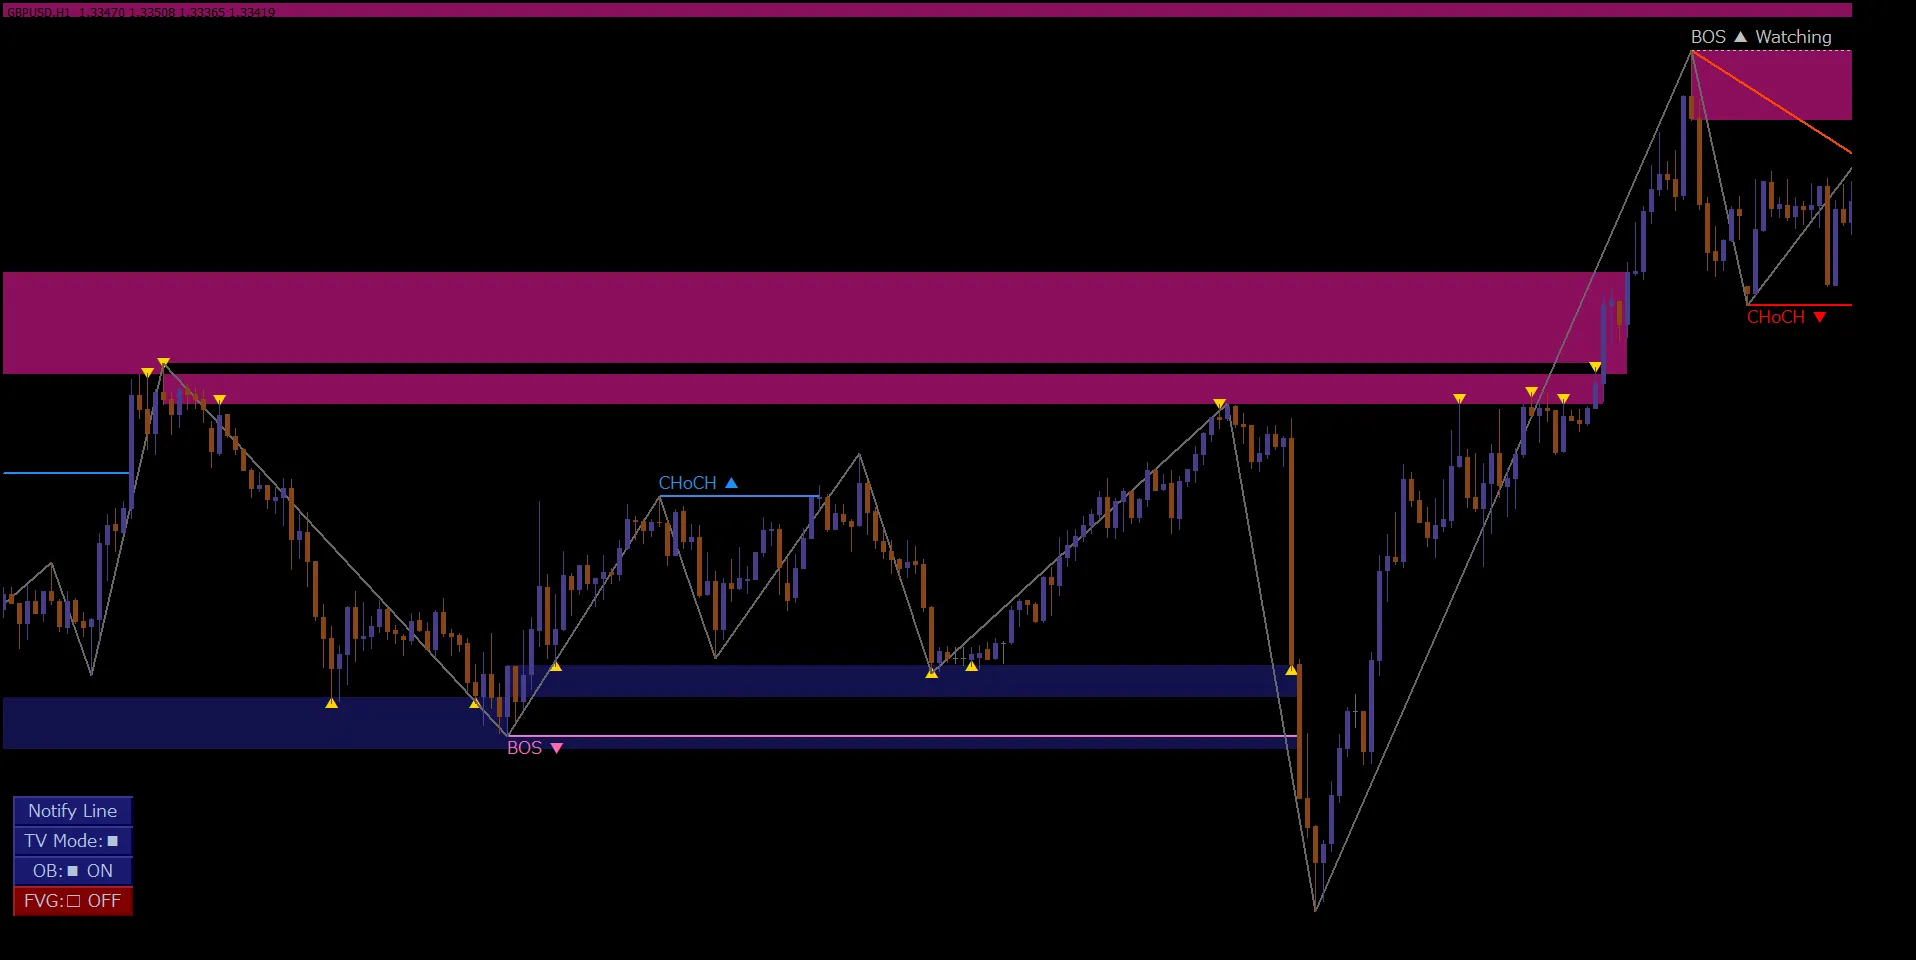
Compare the scenario where price falls to the upper purple zone and the scenario where it breaks higher on the right.
In the supplementary GBPUSD, there are cases where price touches near the lower edge of the upper purple zone and then falls sharply.
Conversely, on the chart’s right side, price reaches the same zone and breaks higher.
From this comparison, you can understand the meaning of watchingwhere price moves away after touching and how the ensuing highs and lows change.
We follow both reactions and breakouts from the zone as the starting point.
05 / HIGHER TIMEFRAME
GOLD・4-hour and daily: Confirming higher-timeframe Order Blocks too
In addition to the intraday zones, having knowledge of higher-timeframe zones helps organize which S/R candidates the price movement is likely heading toward.
Check the upward flow on the 4-hour chart
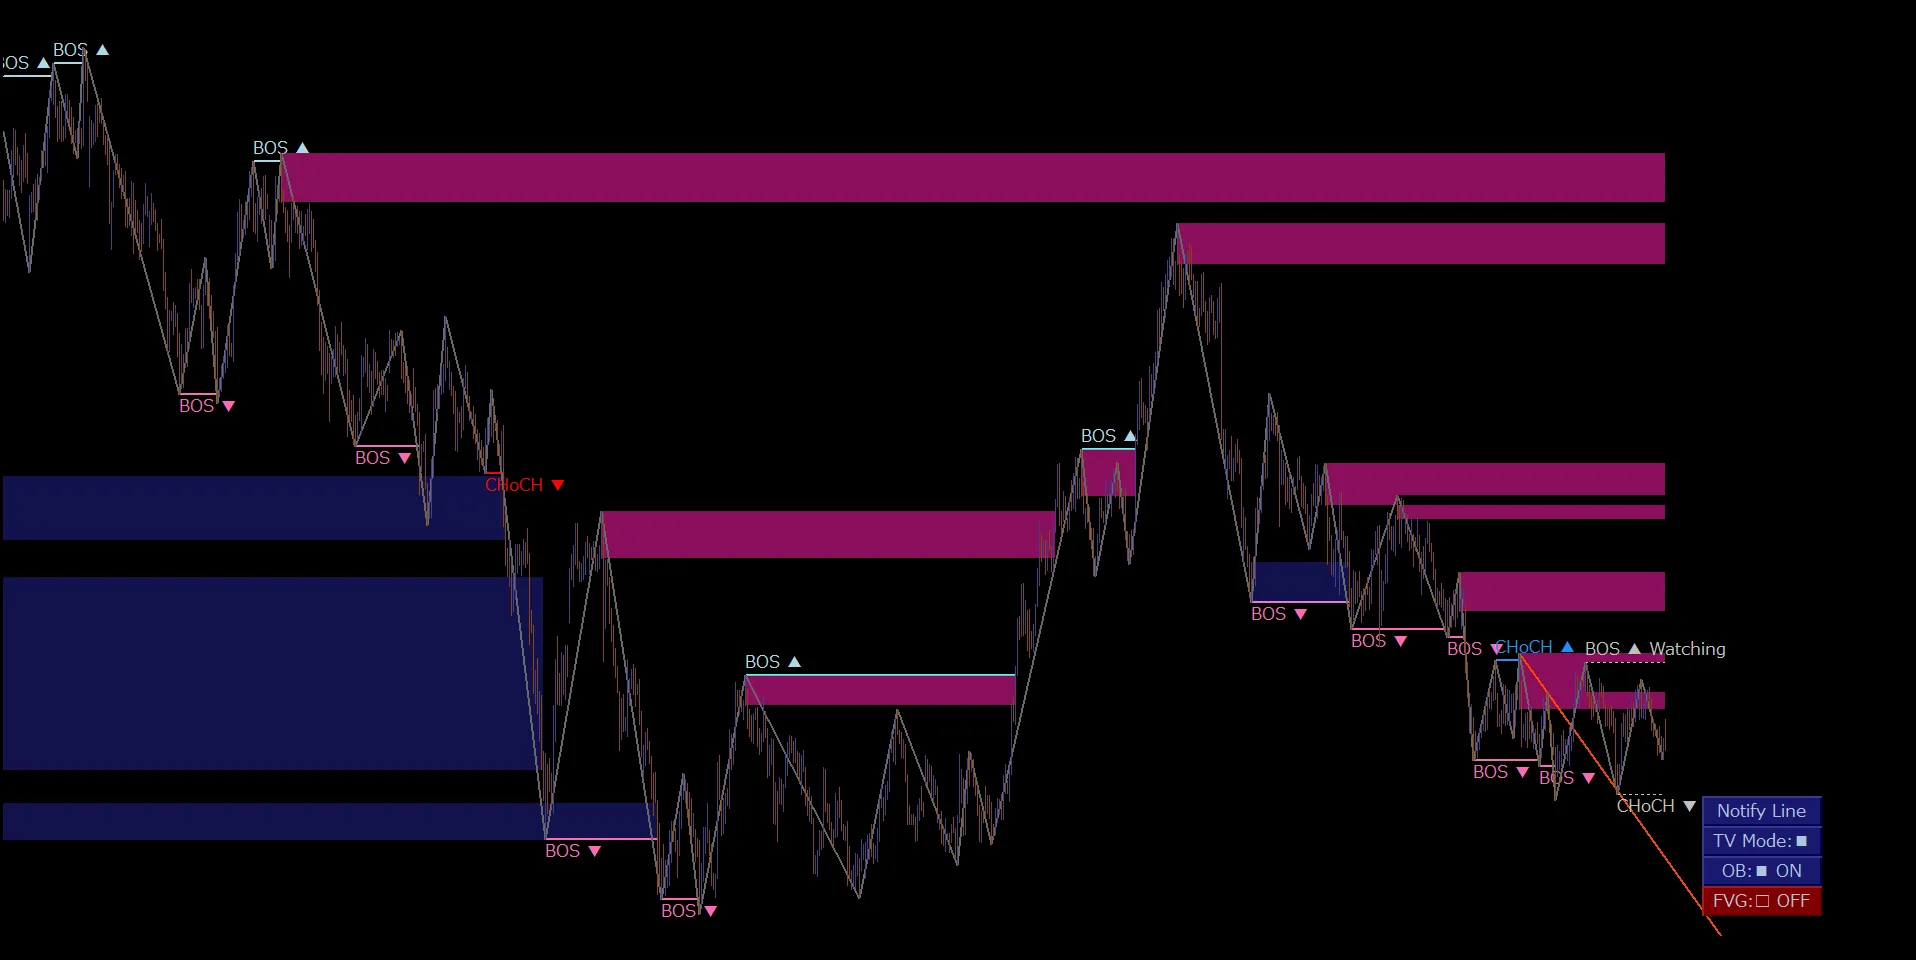
Shows price movement over a wider period. The price breaks above the 4-hour Order Block on the way up from a low.
In the GOLD・4-hour video, the display is scaled to allow viewing of a larger time span.
You can observe the price breaking above the 4-hour Order Block during the ascent from the low.
Switch to daily to view the upper zone
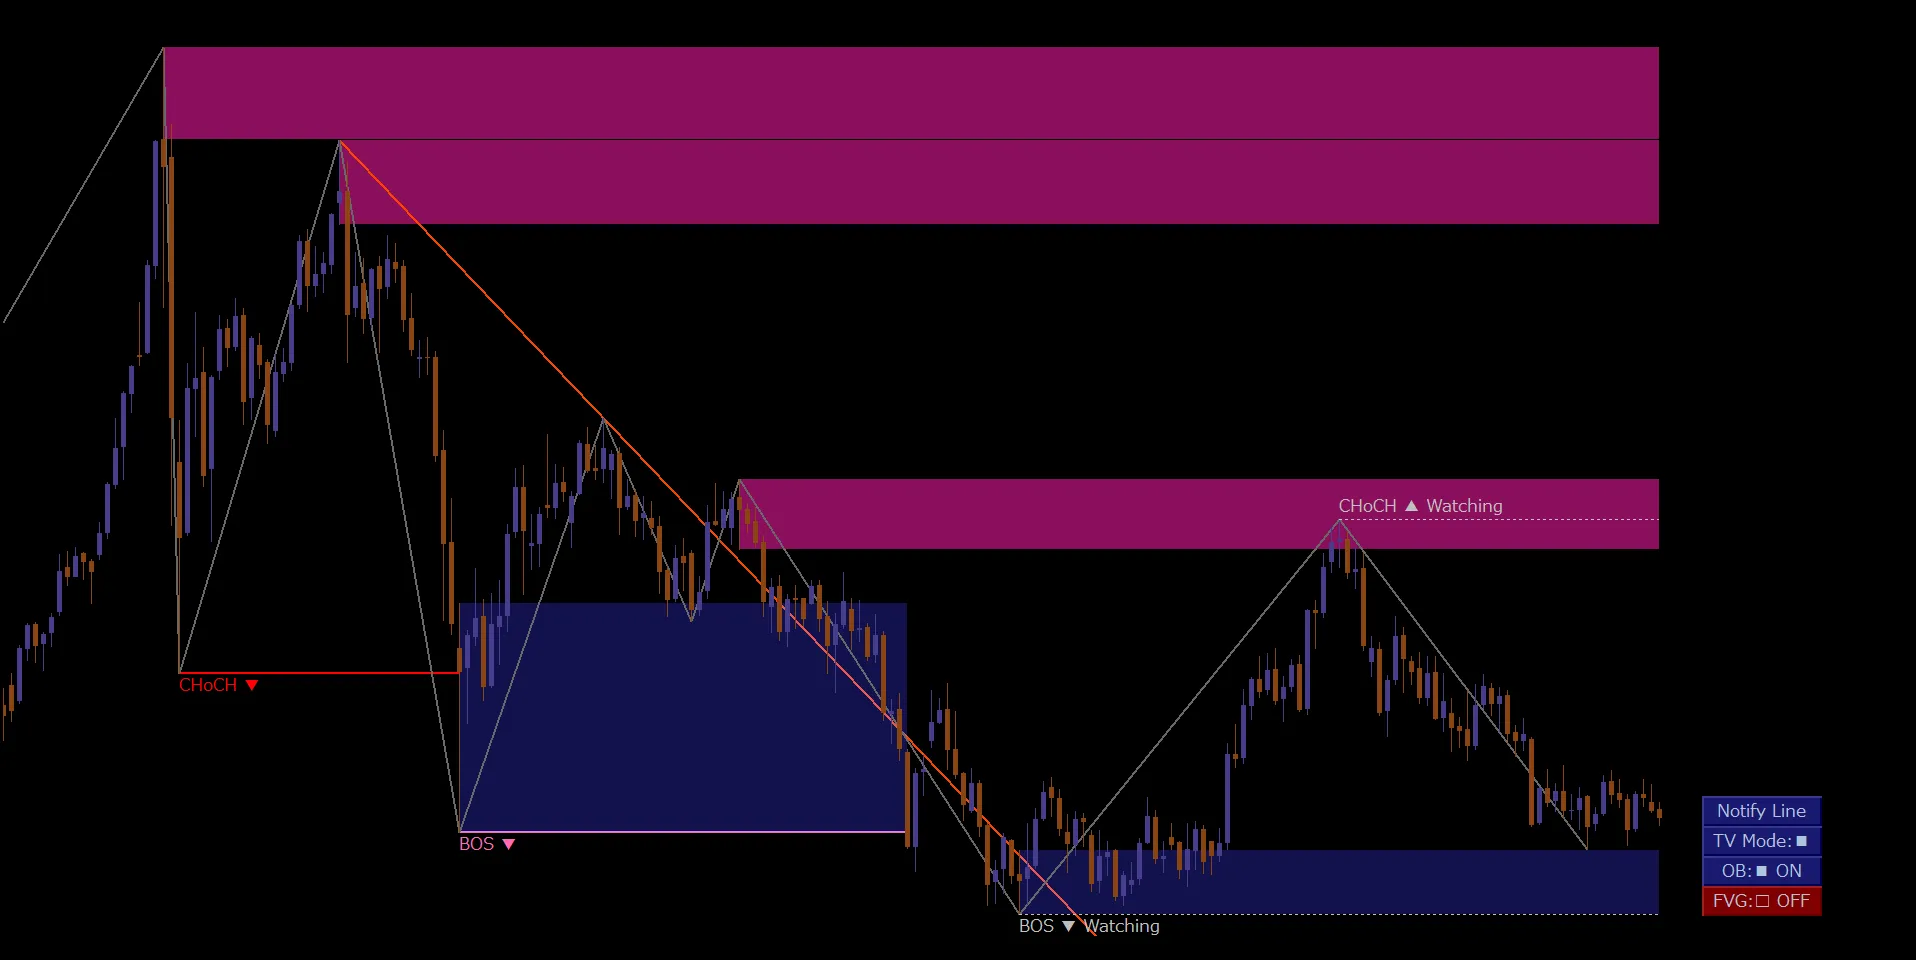
A daily-chart view of the upper Order Block. Focus on retests of the zone and subsequent declines.
The daily chart shows the upper Order Block.
From this zone, price falls after testing the low, then rises to retest, and then declines again.
When considering pullbacks/retracements on the intraday chart, also check the higher-timeframe S/R candidates that lie ahead.
By aligning price movement direction with the zone positions, you can clearly identify the next areas to observe.
DWM’s FVG and Order Block are drawn on the chart at the time frame being displayed.
View daily-zone confirmations on the daily chart and compare with the 4-hour price action.
06 / PRACTICAL STEPS
Four steps to verify on actual charts
Organize the current flow from CHoCH/BOS and new highs/lows.
Identify FVGs and Order Blocks near the current price and zones along the pullback/retrace path.
Also grasp the position of higher-timeframe zones.
Track the price returning to the target zone, watching touch at the boundary and entry inside.
Note the direction of movement after touch and the subsequent highs/lows formed.
In FVG, watch the fill and the reaction; in Order Block, watch the retest and the reaction.
With this sequence, it becomes easier to translate chart information into pullbacks/retracements observations.
07 / FREE TRIAL
Check pullback/rebound候補 on your own chart
DowWave Marker(DWM)is an discretionary trading tool that supports environmental awareness by combining CHoCH/BOS-based market structure visualization with moving averages across multiple timeframes, FVG, Order Block, Pivot, and market highs/lows.
On your usual symbols and timeframes, see where FVG and Order Block appear and how prices move when they return. Compare with market structure on your chart.
MT4 / MT5 compatible, try all features of the integrated SMC model
DowWave Marker
14-day free trial
08 / SUMMARY
Summary: Set zones, wait, and read reactions after retest
This time focused on USDJPY, confirming returns to FVG and retests to the upper/lower Order Blocks.
In GBPUSD, comparing reactions and breakouts, and in GOLD, aligning intraday with higher-timeframe zones.
Understand the market structure to capture the flow, narrow your focus to FVG and Order Block, and confirm price movement after touch.Try incorporating this flow into your daily environmental awareness.
See the Structure. Follow the Trend.
Look at the market structure, wait for pullbacks, and capture the trend resumption.