

[Video] Performance in the Last 3 Months | GOLD STREAM signal movement from July to September 2026
"After the Signal, How Did It Move?"
A thorough test of GOLD STREAM across three periods totaling 68 signals. Looking at the win rate and the contents of PF for each period.
When viewing FX signal tools, isn’t the first thing you’re curious about the “win rate”?
However,win rate alone cannot determine whether a signal can truly be used for trading.
What matters is
"Not just wins, but what happened including losses?"
This is the point.
This time, regarding the GOLD-only day-trading support tool"GOLD STREAM"we confirmed the price movement after signals in video across three different verification periods, and further conducted a thorough numerical verification with the "Win/Loss Verification Indicator."
2026.7.1~8.8
Price Movement After GOLD STREAM Signals
First, after past GOLD STREAM signals appeared,we check how the actual chart moved.
Signals without a win/loss mark were signals discarded due to inconsistency in correlation.
Period: July 1, 2026 to August 8, 2026
33 Signals Verified with the "Win/Loss Verification Indicator"
From here, we examine the price movement for Period ①using the data from the Win/Loss Verification Indicator.
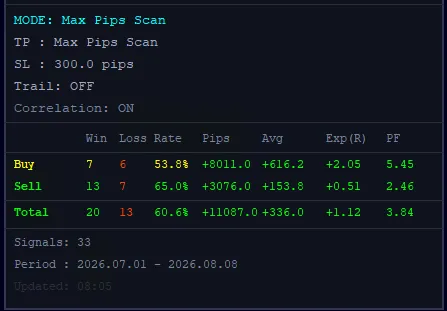
Verification Result ①
Verification period: 2026.07.01 ~ 2026.08.08
Period ①: Look at BUY and SELL results
2026.8.10~9.4
Price Movement After GOLD STREAM Signals
Next, in another period, after GOLD STREAM signals appeared,we check how the actual chart moved.
Signals without a win/loss mark were signals discarded due to inconsistency in correlation.
Period: August 10, 2026 to September 5, 2026
18 Signals Verified with the "Win/Loss Verification Indicator"
From here, we examine the price movement for Period ②using the data from the Win/Loss Verification Indicator.
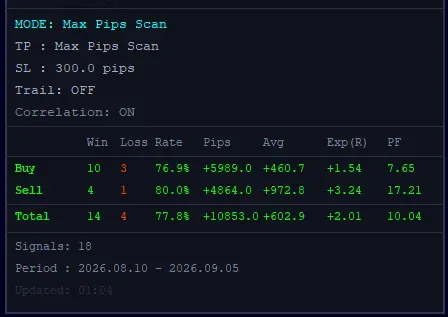
Verification Result ②
Verification period: 2026.08.10 ~ 2026.09.05
Period ②: Look at BUY and SELL results
2026.9.7~9.30 GOLD STREAM
Price Movement After Signals
Furthermore, for the most recent Period ③ after GOLD STREAM signals appeared,we verify how the actual chart moved.
Signals without a win/loss mark were signals discarded due to inconsistency in correlation.
Period: September 7, 2026 to September 30, 2026
17 Signals Verified with the "Win/Loss Verification Indicator"
From here, we examine the price movement for Period ③using the data from the Win/Loss Verification Indicator.
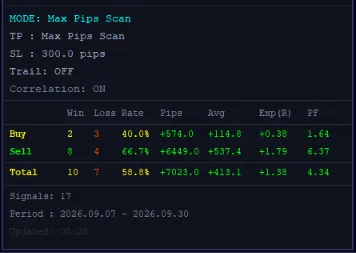
Verification Result ③
Verification period: 2026.09.07 ~ 2026.09.30
Period ③: Look at BUY and SELL results
What is notable is not only the “Win Rate”
Even across multiple verification periods, although the win rate fluctuates, what is truly important is not solely that.
Stable Profit Factor and Expected Value
Each period maintains high PF andExp(R)numbers, indicatinga system that reliably secures profit potential.
Even with a high win rate, a single large loss can wipe out overall profits. Conversely, if you can secure larger profit ranges, it leads to trades with an edge on expected value.
Of course, these areresults of each verification periodand do not guarantee the same numbers in the future.
Maximum Reach in Pips = Not Actual Profit
The listed maximum reaching pips (+11,087 pips / +10,853 pips / +7,023 pips) are verification values aggregating the maximum move reached after each signal. In actual trading, entry/exit timing, spreads, slippage, and market conditions can alter results.
GOLD STREAM is not just a tool to look at signals
The purpose of GOLD STREAM is not simply to display “BUY” or “SELL.”
Even on the official product page,Ready → Signal two-stage notification, signal strength and correlation, GOLD PIVOT LINE, TP/SL (EA included for free), etc., are organized and presented as information needed for judgmentand is the core of the design.
you should consider
“How to judge a signal when the conditions are met.”
This is how it is intended to be used.
This TRADE REVIEW is not merely a report of wins.It provides verification material to see how past signals moved thereafter.
The important thing is not to take everything
GOLD can move strongly in one direction, but it can also experience sharp reversals or range-bound periods.
Therefore,you do not need to capture every price movement.
What matters is to select the moments when conditions are right,then test the subsequent price movement and incorporate it into your trading rules.
The multiple verification results this time are one such material for that purpose.
Review the price movements via video and confirm the overall picture with numbers. This“Chart + Data”perspective allows a calmer evaluation of the signal tool.
See GOLD STREAM in detail
GOLD-specific, two-stage notification x strength & correlation analysis x settlement trailing EA
▶ See GOLD STREAM product details and verification dataFor those who want to know more about this feature
Questions or confirmations about GOLD STREAM can be directed to the developer via direct message.
▶ Ask the developer a questionThe figures in this article are based on past verification results of signals that occurred during multiple verification periods (2026.07.01–08.08, 2026.08.10–09.05, 2026.09.07–09.30).
Win rate, PF, maximum reachable pips, etc. do not guarantee future profits or win rates.
Maximum reachable pips are reference values aggregated from the maximum ranges reached after each signal and may differ from actual entry/exit results.
Actual results vary with spreads, slippage, entry/exit timing, market conditions, etc.
Please make your final trading decisions at your own risk.