
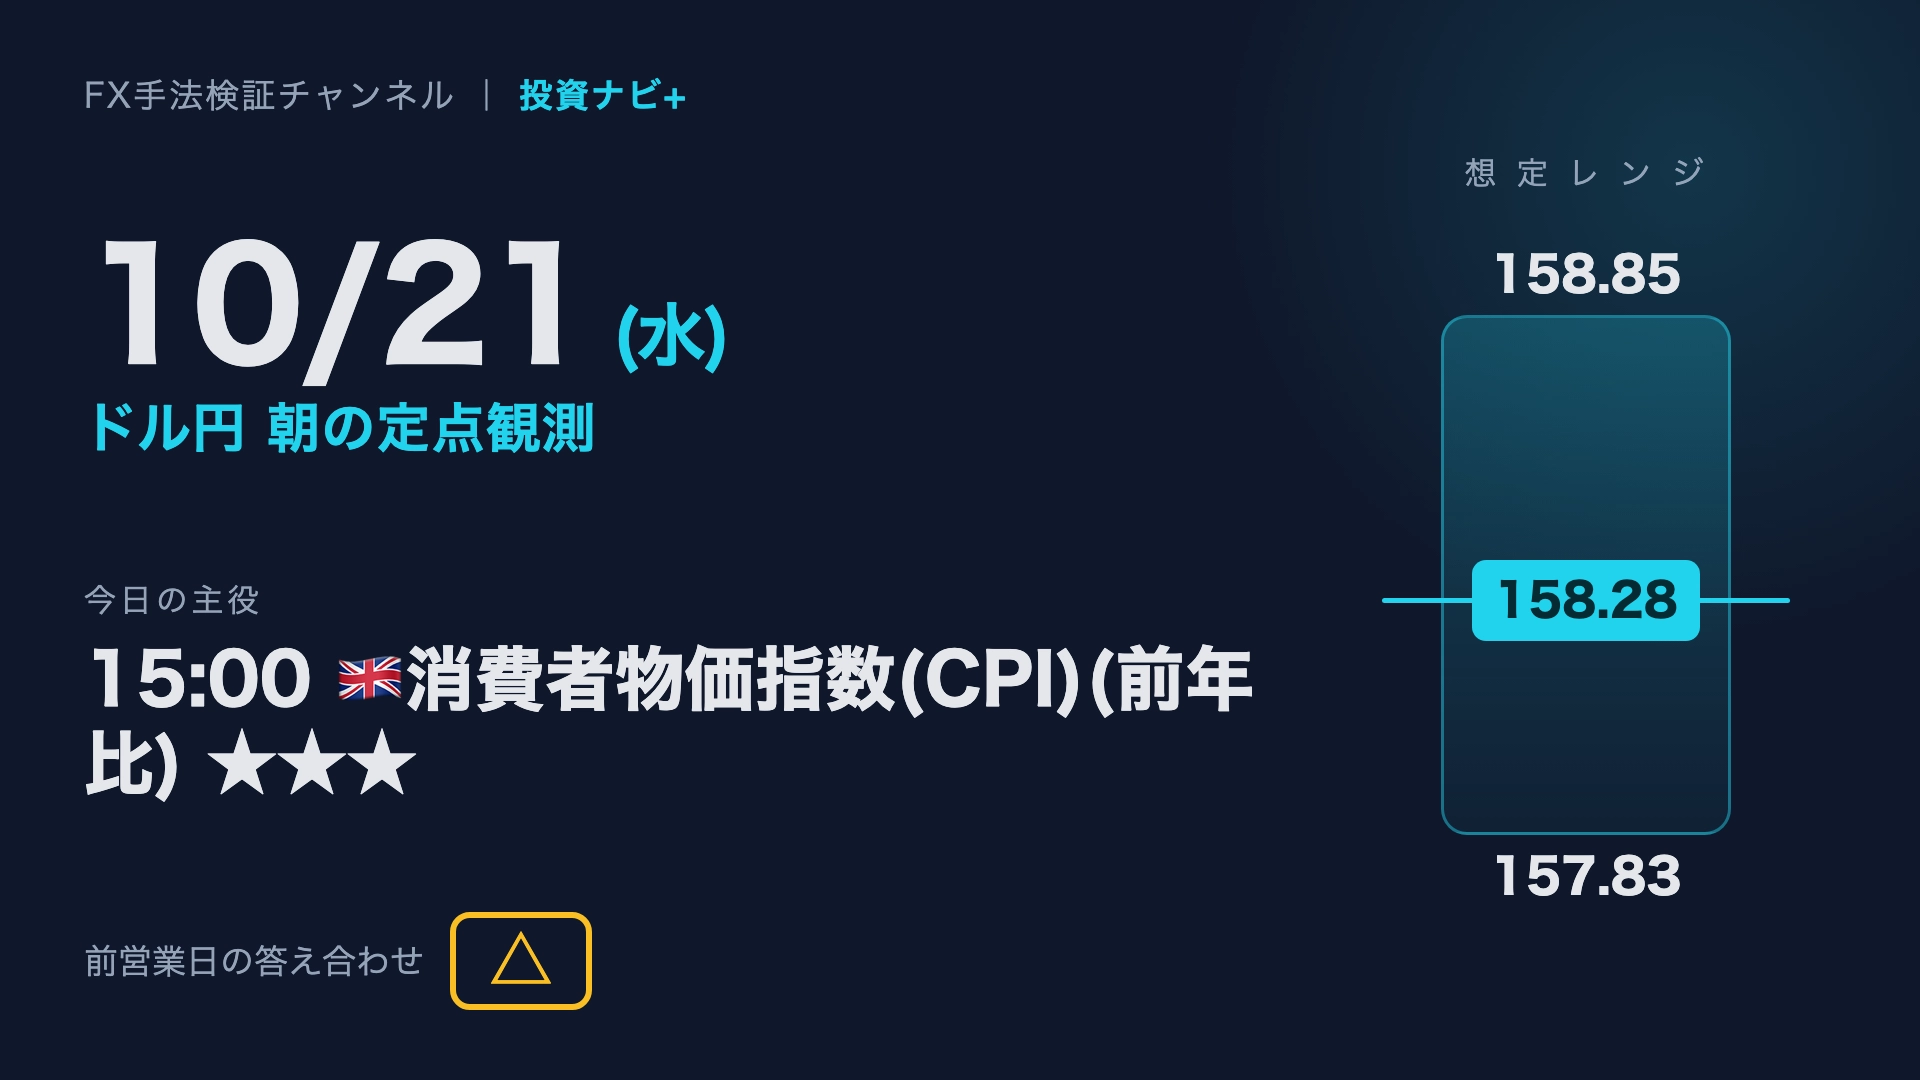
【10/21 Wed】Dollar-Yen Morning Fixed Observation|Star at 15:00 UK CPI (YoY)★★★
This is the morning record for Wednesday, October 21. Today's main focus is 15:00 UK Consumer Price Index (CPI) (year over year) ★★★. The USD/JPY current price is 158.28 yen, with an estimated range of 157.83–158.85 yen.
The answer from the previous business day was a draw. Below are the indicators, charts, and scenarios in that order.
First 60 seconds | Today’s Economic Indicators

Today’s Economic Indicators (10/21 8:30 - 〜 JST 8:29 the next day)
| Time (JST) | Country | Indicator | Importance | Forecast | Previous |
|---|---|---|---|---|---|
| 08:50 |  | Trade Statistics (Customs Basis) | ★ | -0.26T | -0.84T |
| 15:00 |  | Consumer Price Index (CPI) (YoY) | ★★★ | 3.4% | 3.1% |
| 15:00 | | Core CPI (YoY) | ★★ | 2.8% | 2.6% |
| 15:00 | | PPI Input (MoM) | ★ | 1.3% | 0.3% |
| 15:00 | | PPI Output (MoM) | ★ | 0.7% | 0.7% |
| 15:00 | | Public Sector Net Borrowing | ★ | 23.8B | 18.3B |
| 15:00 | | Retail Price Index (RPI) (YoY) | ★ | 3.9% | 3.4% |
| 16:15 |  | Nargel Bundesbank President Nagel Speech | ★★ | — | — |
| 17:30 | | House Price Index (YoY) | ★ | 1.2% | 1.4% |
| 19:00 | | Bundesbank Monthly Report | ★ | — | — |
| 22:00 | | Bailey BoE Governor Speech | ★★★ | — | — |
| 23:30 |  | EIA Crude Oil Stocks | ★ | -0.1M | -8.6M |
What Moves Today
The UK CPI at 15:00 is expected at 3.4% vs 3.1 previously; the market is pricing in a certain degree of re-accelerated inflation. If the actual is above forecast, the pound tends to rally; if below, the pound can weaken, and through cross rates with the pound, the USD/JPY may also be affected. Since it’s inflation data that can influence BOE rate-cut decisions, there’s potential to ride this through Bailey’s 22:00 BoE speech.
Dollar/Yen: Current Position
Current Value158.28 (Previous close 158.17 / day-on-day -0.36)
Estimated Range157.83 (Pivot S1) 〜 158.85 (Daily MA75)
Main ScenarioRange-bound between 157.83 and 158.85. Direction awaiting the UK indicators after 15:00
AlternativeBreak above 158.85 targets 160.21 / Break below 157.83 to 157.48
Daily Timeframe: Environmental Overview
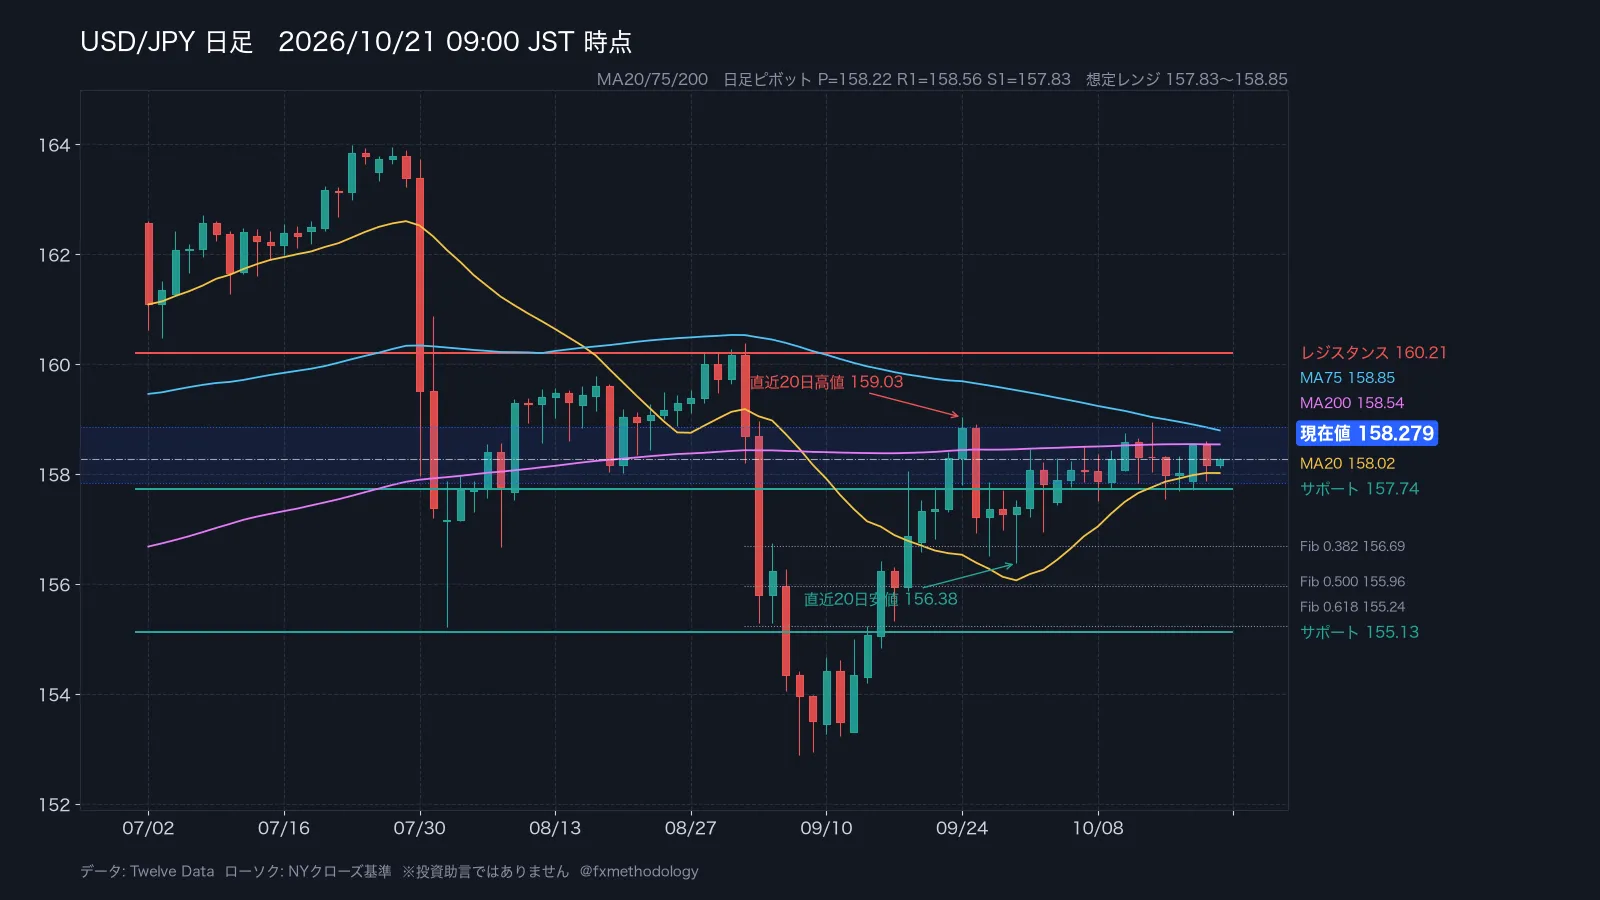
The daily chart is in a consolidation, with moving averages intertwined (no clear order). The three MA lines are tangled, giving no clear direction. The current price 158.28 sits above MA20 at 158.02. Upper level is 160.21, lower levels identified automatically at 157.74 and 155.13. The 20-day high is 159.03 (9/24), the low is 156.38 (9/30). Looking at the move from 152.89 to 159.03, 0.382 corresponds to 156.69 and 0.5 to 155.96. ATR14 was 82 pips.
4-Hour Timeframe: Key Lines
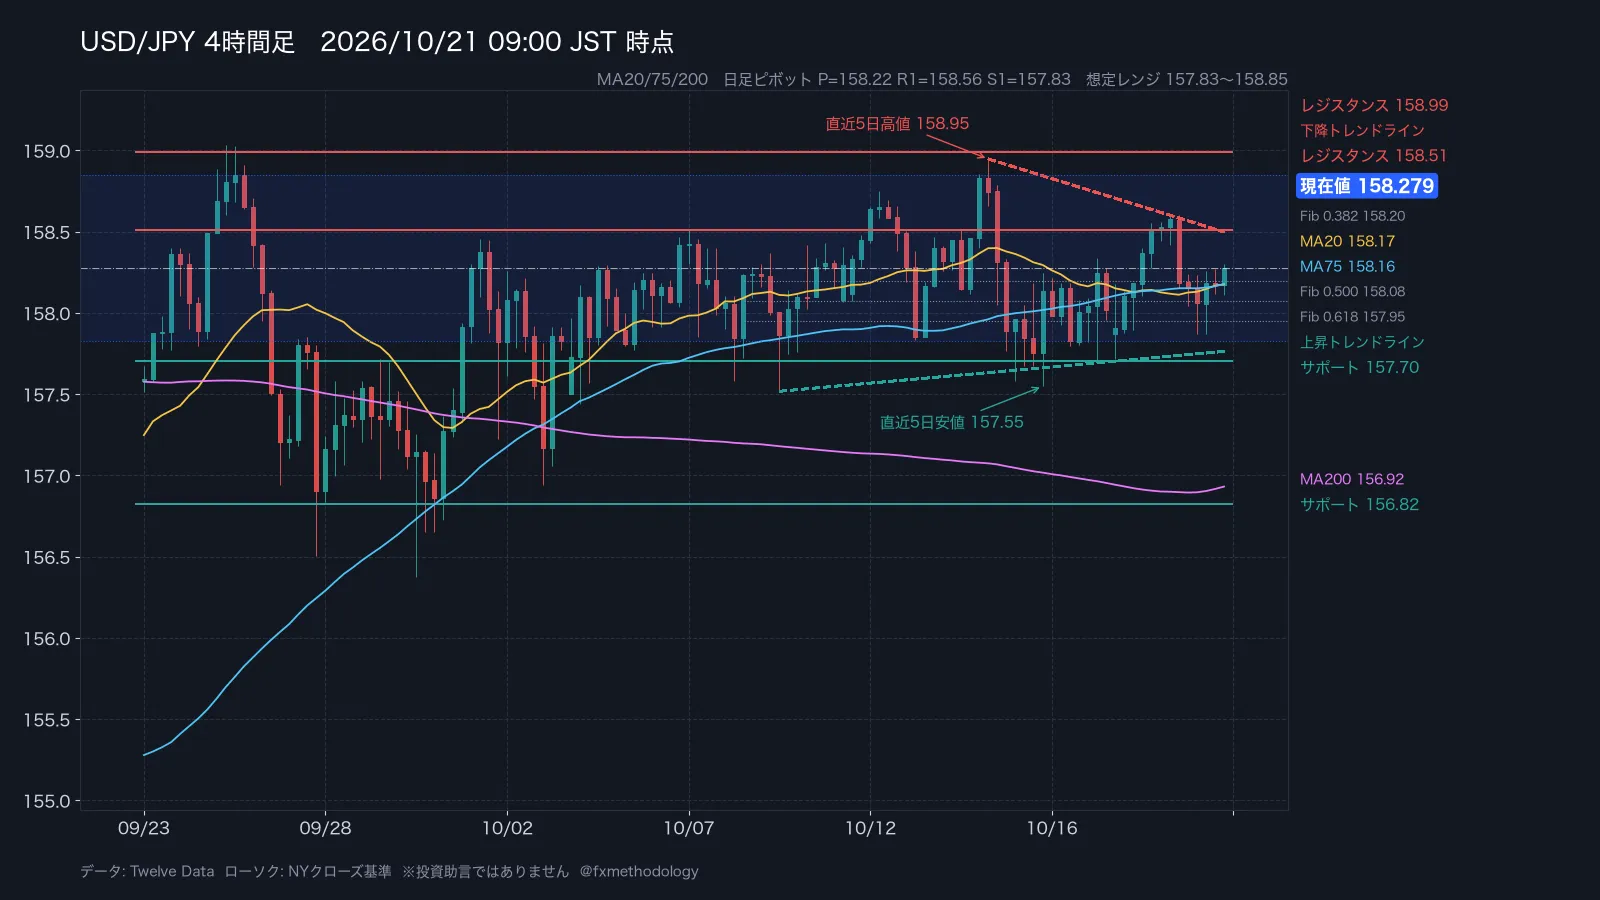
The 4-hour chart shows an uptrend with MA20 > MA75 > MA200. Up levels are drawn mechanically at 158.51 and 158.99, down levels at 157.70 and 156.82. The uptrend line starting 10/09 hits at 157.76, the downtrend line starting 10/14 hits at 158.52, forming a squeezed position. ATR14 is 31 pips.
Connecting Indicators and Charts
The focus is on the 15:00 UK CPI (YoY); it may ripple through to USD/JPY via the pound. Until then, the market is likely to stay within the expected range of 157.83 (Pivot S1) to 158.85 (Daily MA75). Daily pivot points: P at 158.22, R1 at 158.56, S1 at 157.83, with the current price near P. The 22:00 Bailey BoE speech is also in the pipeline.
Watchable Content | USD/JPY Morning Fixed-Point Observation

Answer from the Previous Business Day
It’s a draw. The range was 157.98〜159.03; the price briefly dipped below the lower bound, but closed at 158.17 within the range. There is no clear breakout, so it’s treated as a draw.
Yesterday’s USD/JPY closed at 158.17, down 0.36 yen from the previous day, with a daily range of 73 pips in a bearish candle. In the 15:00 UK average wage release, 11.8 pips moved in 15 minutes and 16.5 pips in 1 hour, both downward directions.
Verification Data
The one-hour average USD/JPY range after the UK CPI release (past 36 occurrences) was 24 pips, and the initial direction persisted after one hour in 66% of cases. For USD/JPY, indicators from other countries often translate into a straightforward move, surprisingly.
Today there is a touch to MA200 from below. The bullish rate after touching MA200 from below (last 10 years, 105 occurrences) was 49%, with an average movement of +2 pips. There is almost no directional bias, and reading the direction from the touch itself is challenging.
Today’s Question
Between 158.85 and 157.83, which will be tested first?
If you don’t mind, please share your thoughts with a like or a comment.
For those who want to run the same verification in their own setup, we’ve provided a version with the rules programmed.RCI Method MT4 Version / MT5 Version
Materials published by FX Method Research Institute on GogoJungle


*The verification uses USD/JPY hourly data from January 2016 to March 2026. It does not indicate future performance.
Indicator data: Edited from Forex Factory / Tradays; Price data: Twelve Data (as of 2026-10-21 09:00)
※ This is the personal view of Tsutsumi. Please make investment decisions on your own.