
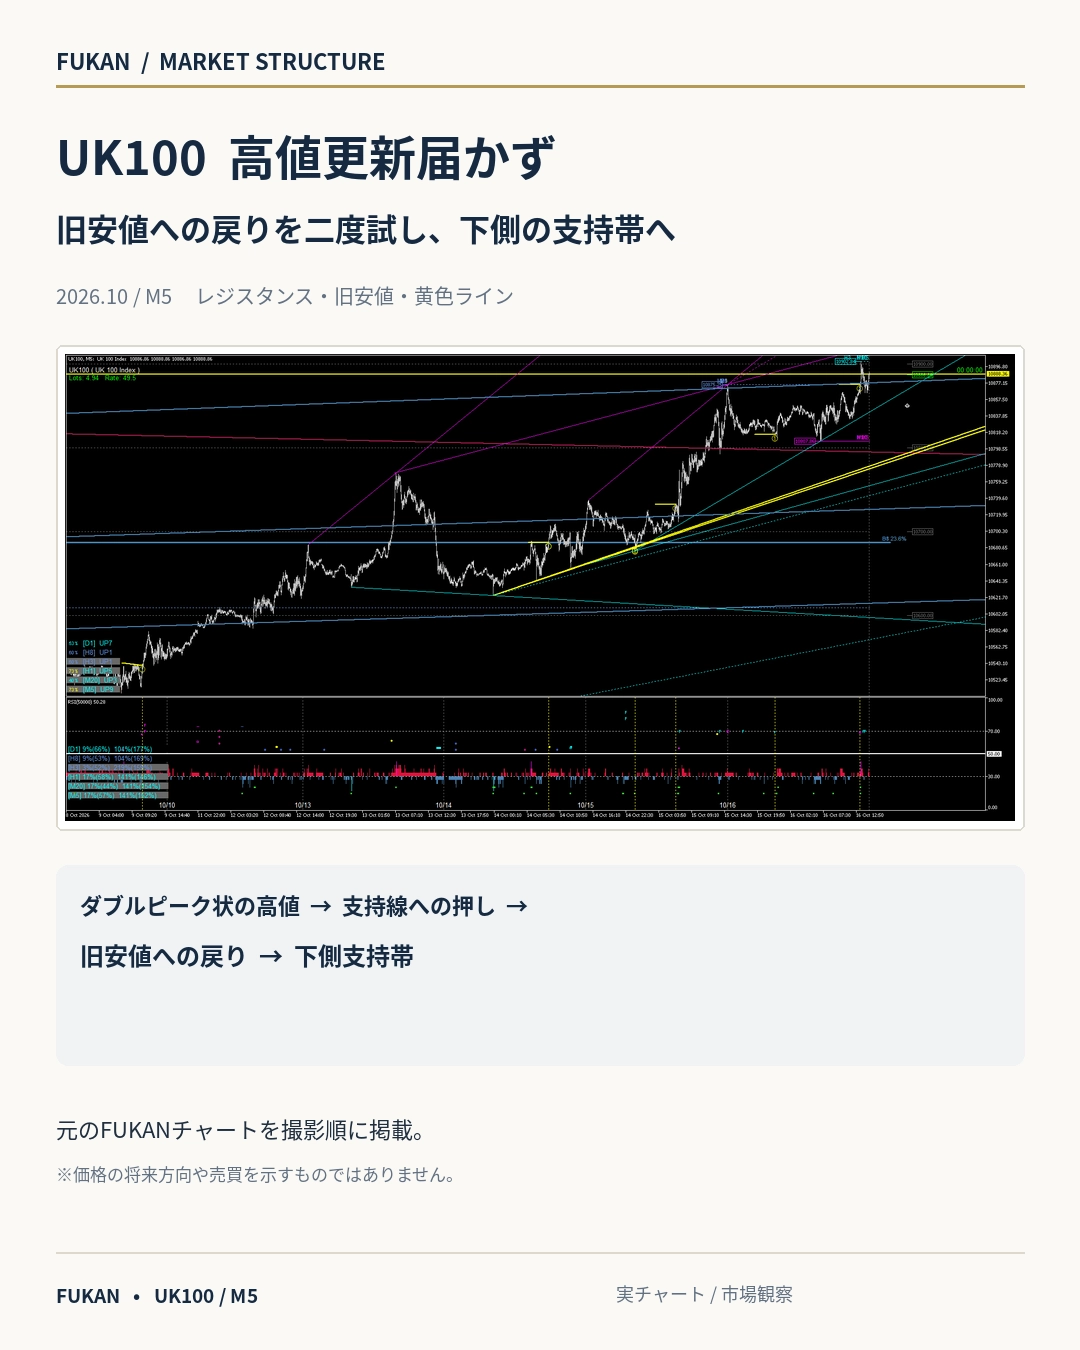
UK100 failed to reach a new high—attempted to return to the previous low twice, retreating toward the lower support zone
UK100 could not reach a new high — attempting twice to return to the old low, moving to the lower support band
UK100 / M5 / October 2026 / FUKAN MARKET STRUCTURE
After reaching two highs near the upper trendline, UK100 fell below the support line. In the rebound after breaking the low, the old lows across multiple timeframes act as resistance twice. Four real-time FUKAN charts are arranged in time order.
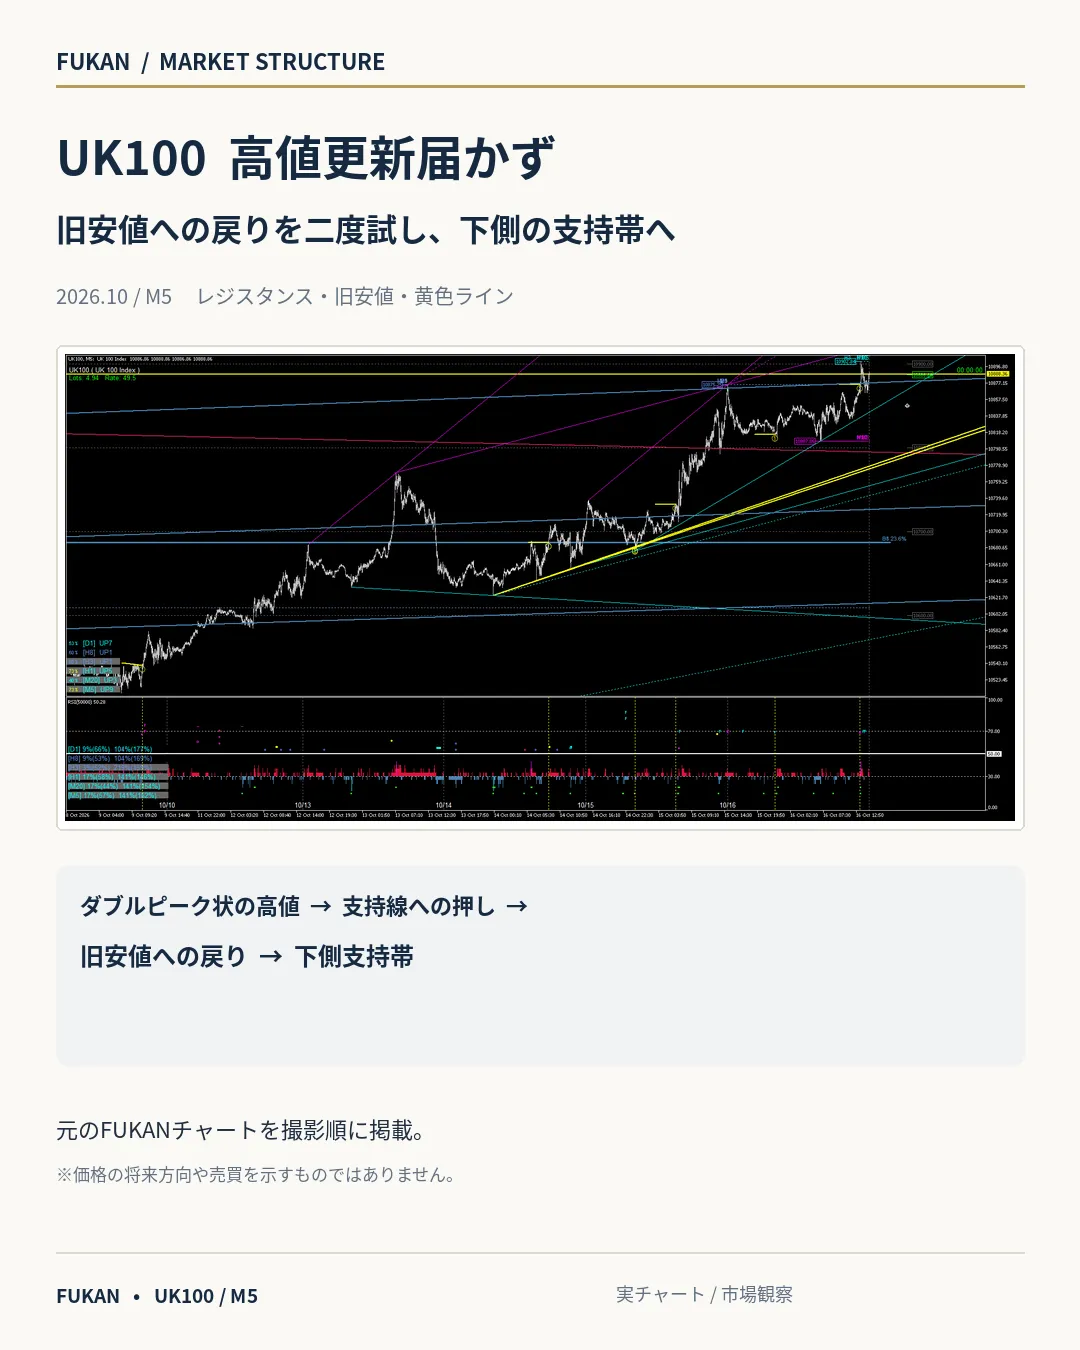
01|Upper resistance|Two highs
Prices progressed from the ascending support line and formed two peaks near the upper trendline. They did not reach a new high.
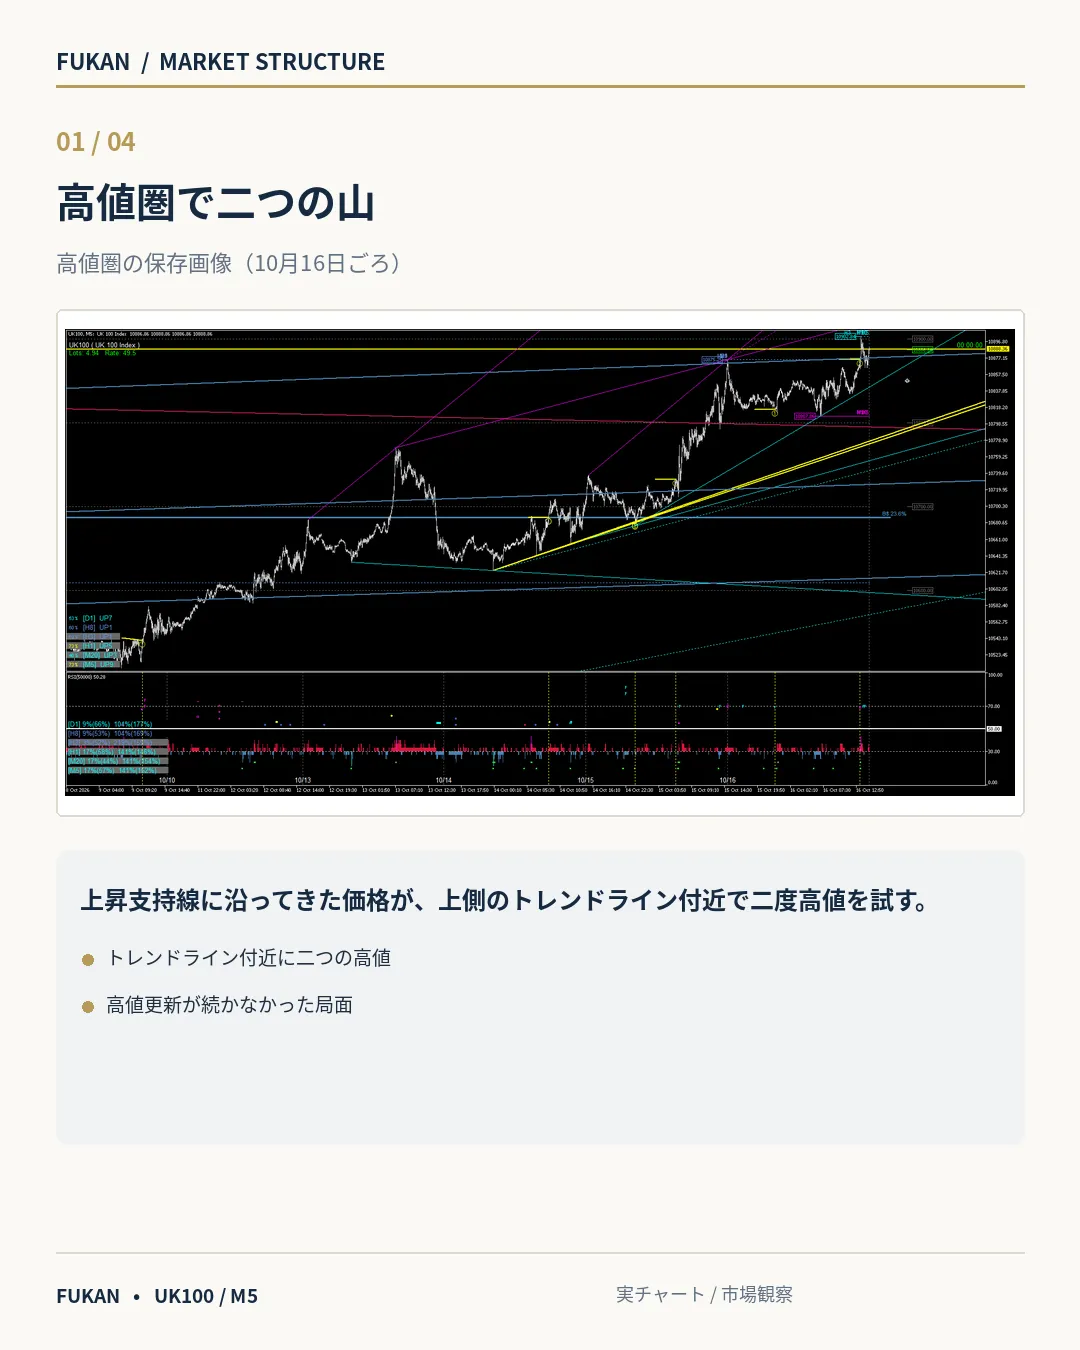
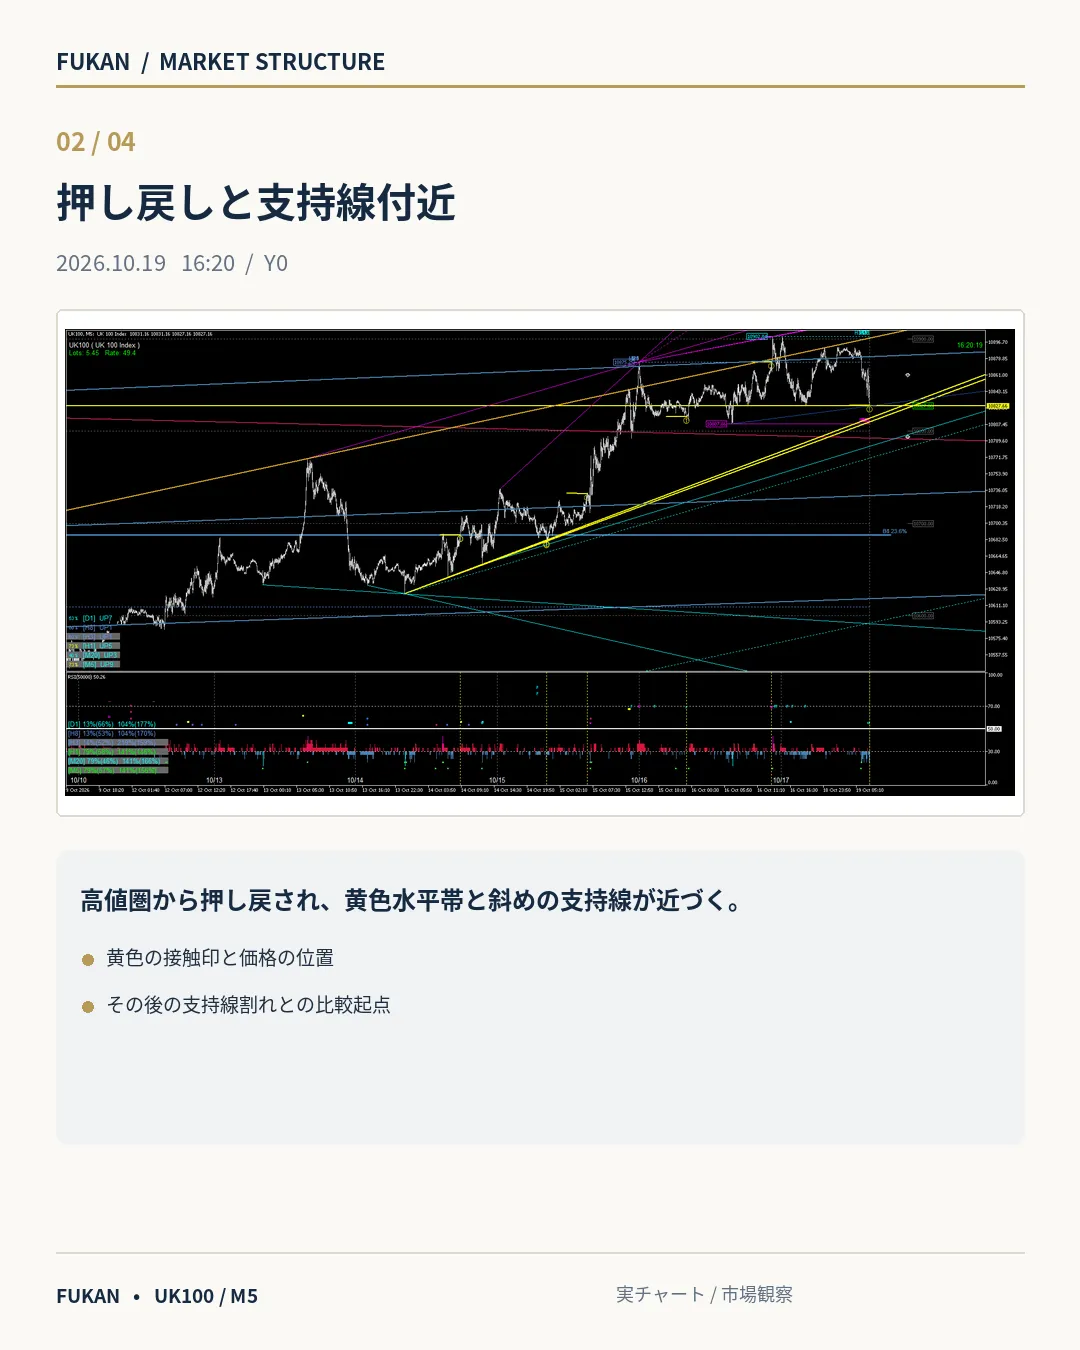
02|Near the support line|October 19 16:20
From the high-price area, the yellow line and the diagonal support line approach the price. Compare this with subsequent images.
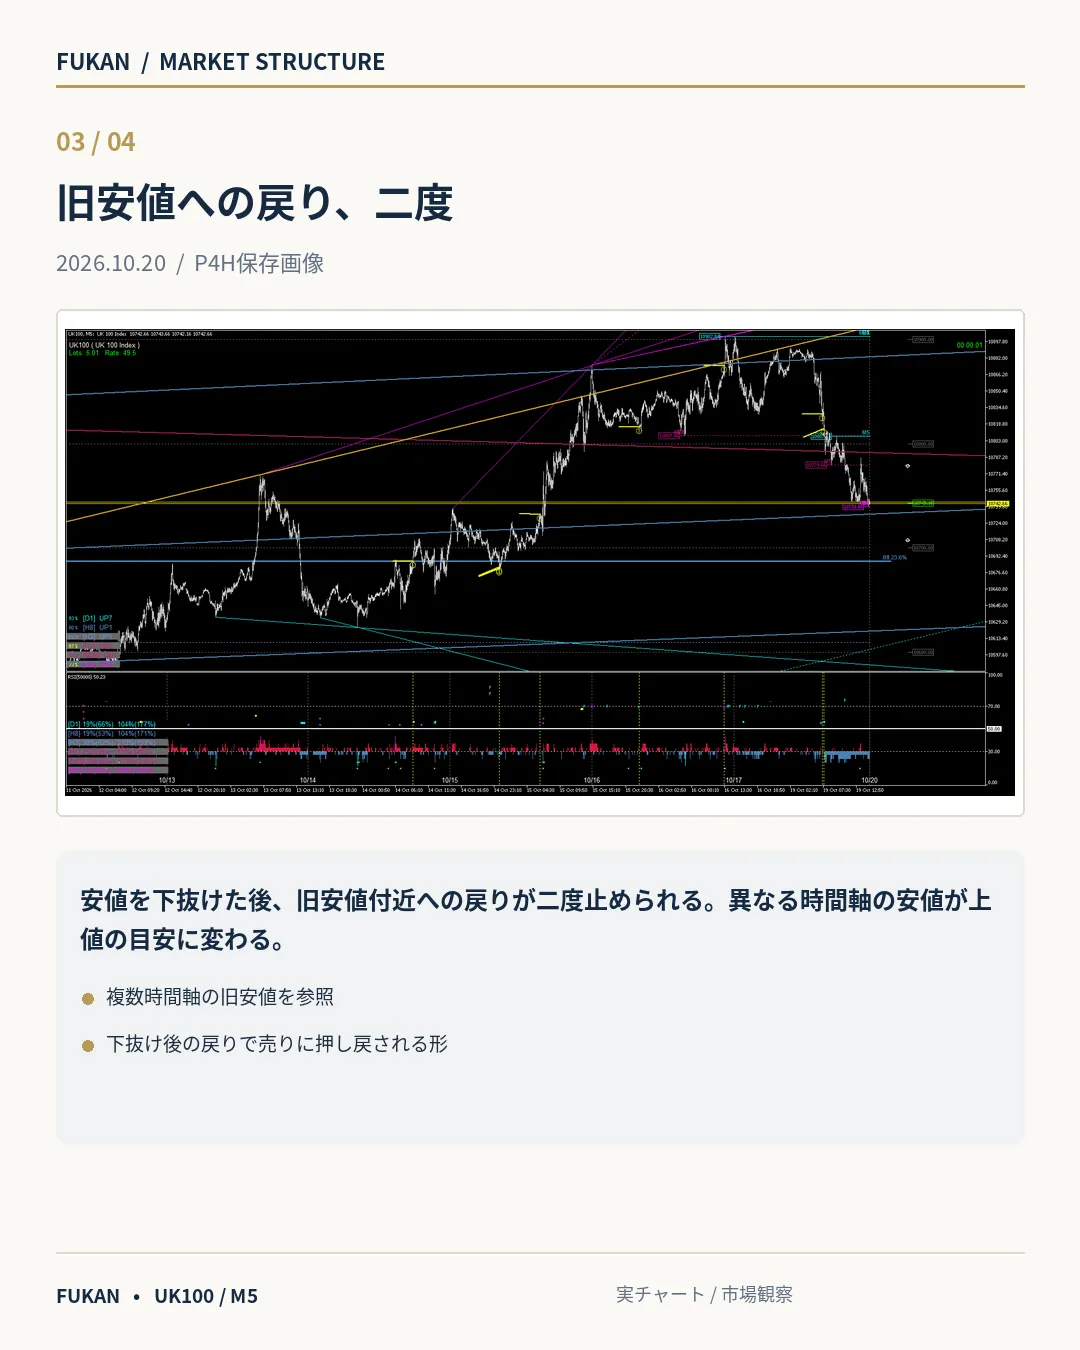
03|Two stops at old lows|Saved image from October 20
The rebound after breaking the low is a structure where two upper limits were restrained starting from the old lows across multiple timeframes. The image still shows a scenario where the price cannot break above and is pushed back down by selling again.
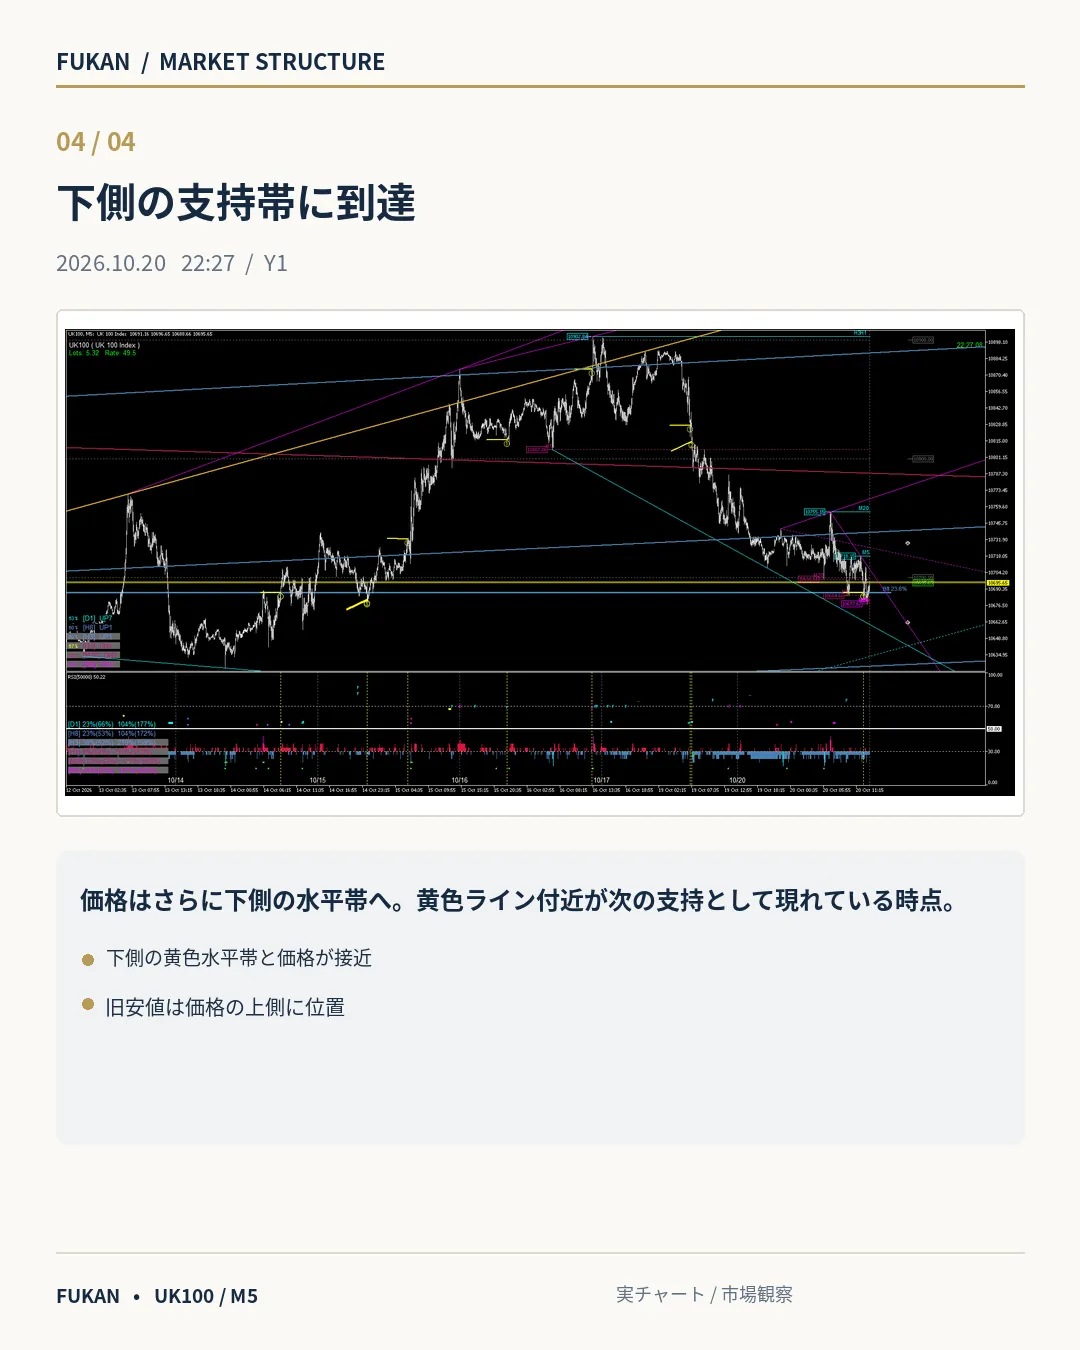
04|Lower support band|October 20 22:27
The price moves toward the lower yellow support band. The saved image retains contact near the yellow line.
Position relationships seen in FUKAN
The upper-trendline resistance, breaking the support line, two rebounds to old lows, and the lower yellow support band. In the four real-time charts, the levels that served as support later appear as resistance in the rebound process.
※Market observation record by FUKAN. The displayed prices are reference values from CFD brokers. This does not identify actual orders or volumes from individual traders based on line reactions, nor is it investment advice or a buy/sell recommendation, nor a guarantee of future price movement, returns, or win rate.