

Although I won, the money in my account isn’t increasing. I want to reevaluate with gold, the way to leave profit
"I won many times today. Yet, the money in my account hardly increased."
If you’ve been trading gold, have you ever had this kind of experience?
The history shows a streak of profits. The direction was somewhat correct. Yet when you look at the total, the remaining amount isn’t as much as you thought. In some cases, it’s negative.
When that happens, the next thing you might want to search for is a "signal that hits more often."
But before that, I would like you tonot look at the number of wins, but the amounts won and lostinstead.
Even with 4 wins, you can be in the red with one loss
For example, if you gain 2,000 yen once, four times, and then incur a single 10,000 yen loss,
your profit is 8,000 yen, your loss is 10,000 yen. Net is minus 2,000 yen.
The number of wins is 4 out of 5. Yet the overall balance is negative. This is a hypothetical calculation, but it shows that the feeling of “doing well” and “money staying” are not the same.
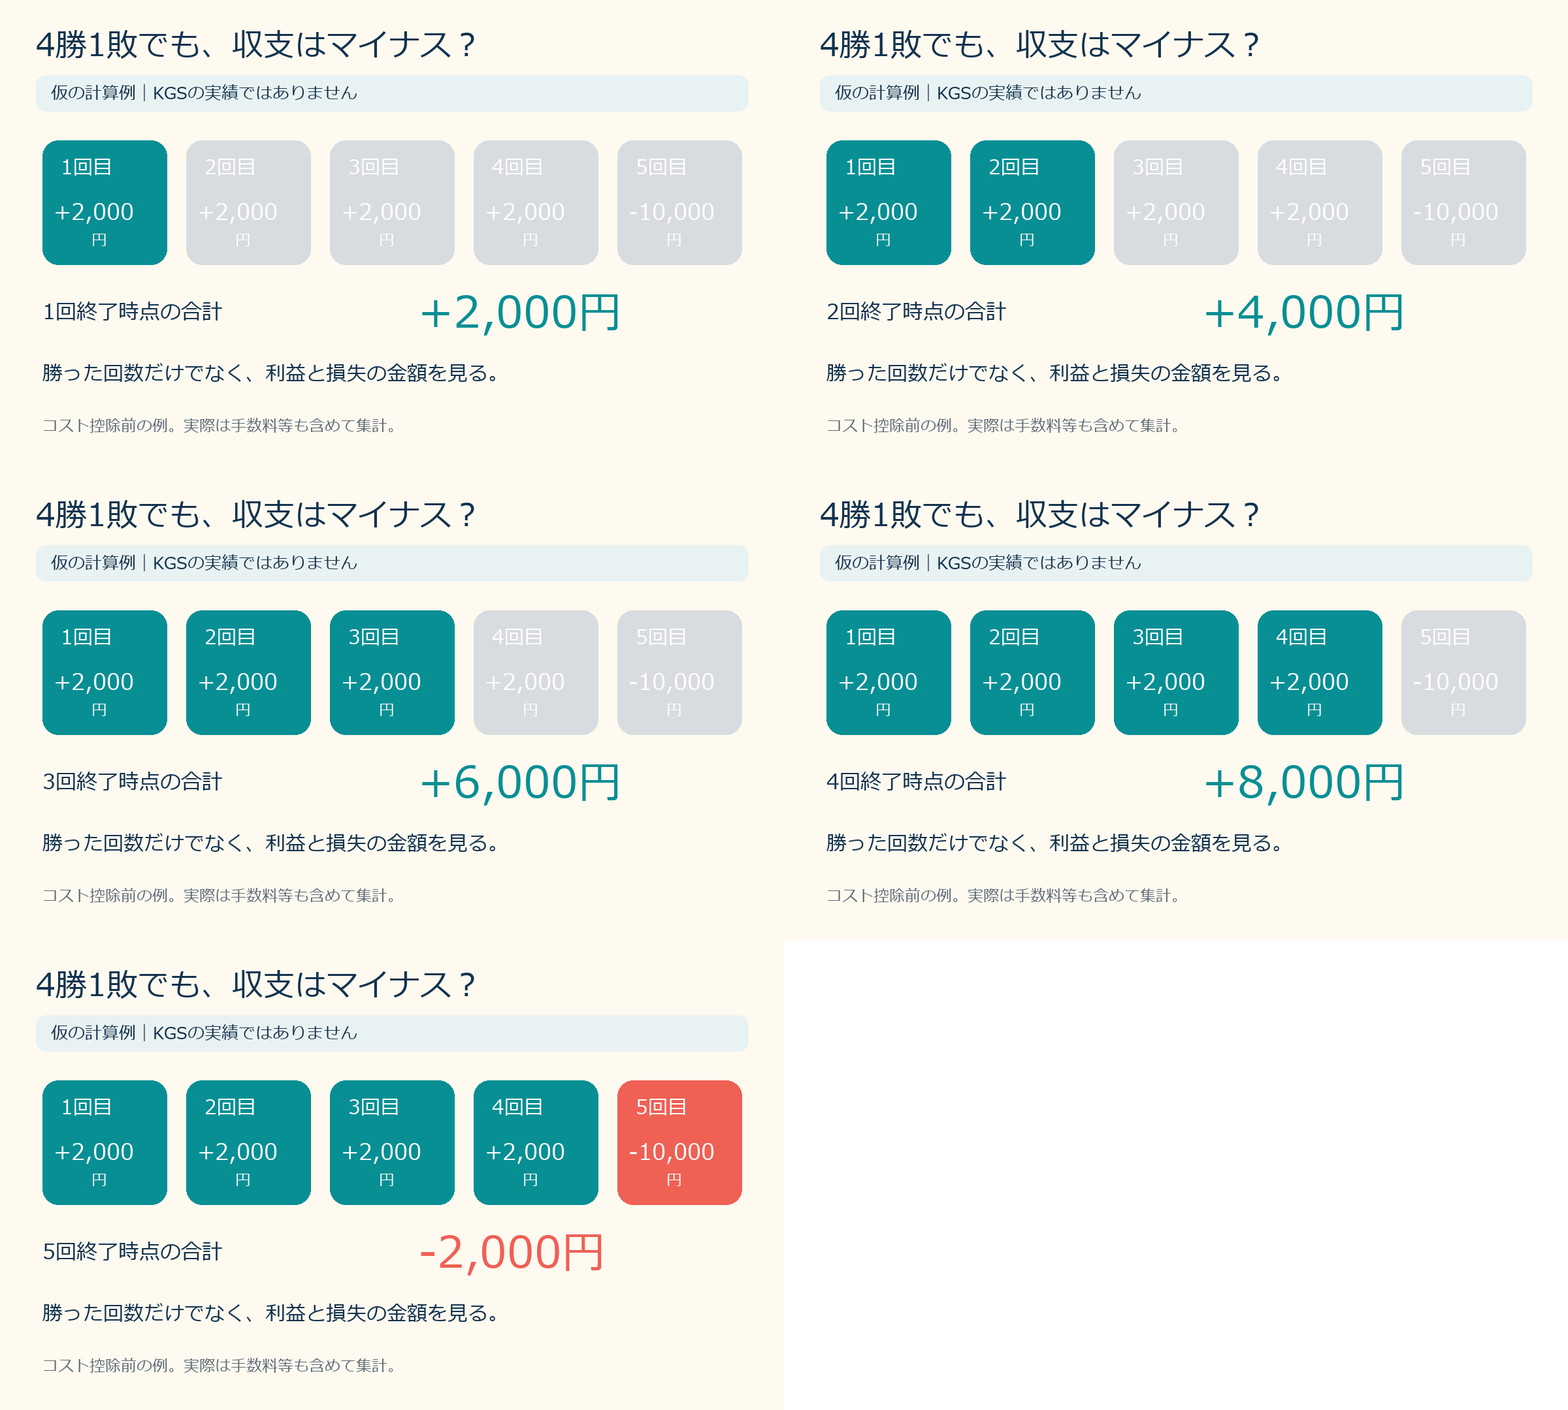
These numbers are before trading costs. When you actually review, you should look at profits and losses including fees and swaps. Do not double-count costs that are already reflected in the trading history.
“How much did it move?” and “How much was left?” are separate
Even if you capture the same price range, the profit amount varies with the lot size.
You might be losing profits earned with small lots to losses with large lots. When you win, you end quickly; when you lose, the amount can be larger than expected. Such biases are hard to notice if you only look at win rate.
Therefore,do not end your review with “I had 3 wins today.”
How much remained from profitable trades? How much did profitable trades reduce from losses? What were the lot sizes and exit decisions at that time? Laying it out that way makes where to review more concrete.

Making profit targets farther away doesn’t automatically solve it
Here, thinking “then place take profits farther away” is also a bit off.
Moving take profits farther just to improve the appearance of numbers doesn’t guarantee you will reach them. Conversely, moving stop losses closer just to show smaller losses may not match the trading scenarios you encounter.
What I want you to value is,to check the entry, exit, and lot as a bundle before entering.
At which price will you enter? How far will you aim, and where would you conclude your assumptions were wrong? With that range, what loss would you bear with your current lot size?
If the amount exceeds your tolerance, you have the option to lower the lot size or skip the trade. Recklessly chasing to recover losses is not a solution.
Don’t end KGS with just an arrow
KURAMA GOLD SIGNAL PRO is an indicator that displays the reference prices for gold buy/sell signals, entry, take profit (TP), and stop loss (SL).
I want you to use not only the direction to buy or sell, but also“you can see the exit before you enter.”to be useful.
Is the current price moving away from the entry reference price?
From the current price to TP and SL, how wide is the gap?
Does that gap and your lot fit your funds?
By checking the display, you won’t rush to think after reacting to the signal; you’ll have materials to organize before placing an order.
However,the width of the TP/SL does not directly correspond to your account’s profit or loss.
Actual amounts vary depending on lots, broker terms, account currency, and order prices.
KGS is not an automated trading EA; you place orders and settle them yourself.
Please distinguish the shown reach to reference prices from the execution results on your own account.
Organize your history before increasing your next trade
First, lay out the trades from the same period, including both wins and losses.
- Average amount of winning trades
- Average amount of losing trades
- Each trade’s lots and the amount of loss you expected before placing the order
- Total profit/loss including costs
Even collecting only winning trades won’t reveal the cause. Do not decide the method’s quality from a few results; continue recording to understand what biases exist in your trading.
Because you want to increase your hit rate,change your perspective to “how to preserve money with win and loss.”That shift is your next step.
Tools for organizing entry and exit for those who want them
It is difficult to think of entry and exit from a chart with nothing on it each time. I want you to view not only the signal but also take-profit and stop-loss references.
For those, please check an actual screen on the KGS product page. It’s prepared as a tool to organize the pre-trade materials for short-term gold trading.
 KURAMA GOLD SIGNAL PRO
If you want to learn the method, a complete set with private coaching
Not only using the indicator, but also learning my MA method and chart interpretation. I want to ask questions about moments you’re unsure of to deepen understanding.
For those,a complete set that combines GOLD and USD/JPY two indicators with my method materials, video materials, and private coachingis recommended.
Since you can access tools, materials, and a place to ask questions all in one, this set is worth considering for those who value depth and cost effectiveness.
When you ask a question, please also send the chart you’re unsure about and what you didn’t understand, so I can explain the approach and how to read the indicators more easily.
Please hide any unnecessary personal information, such as account numbers in images.
Not to boast about winning counts, but so you can understand and review your own trades. If you want both tools and an environment to learn, please take a look here.
 【Develop into a Professional Trader】GOLD × USD/JPY Indicator + Materials + Private Coaching
※ The numbers in this article are illustrative examples and do not reflect KGS trading performance. KGS is a tool to support investment decisions and does not guarantee profits, win rate, or executions at specified prices. Private coaching is to assist understanding of materials and tools, not a service that guarantees profits. Trading involves the risk of loss, and final decisions should be yours.