
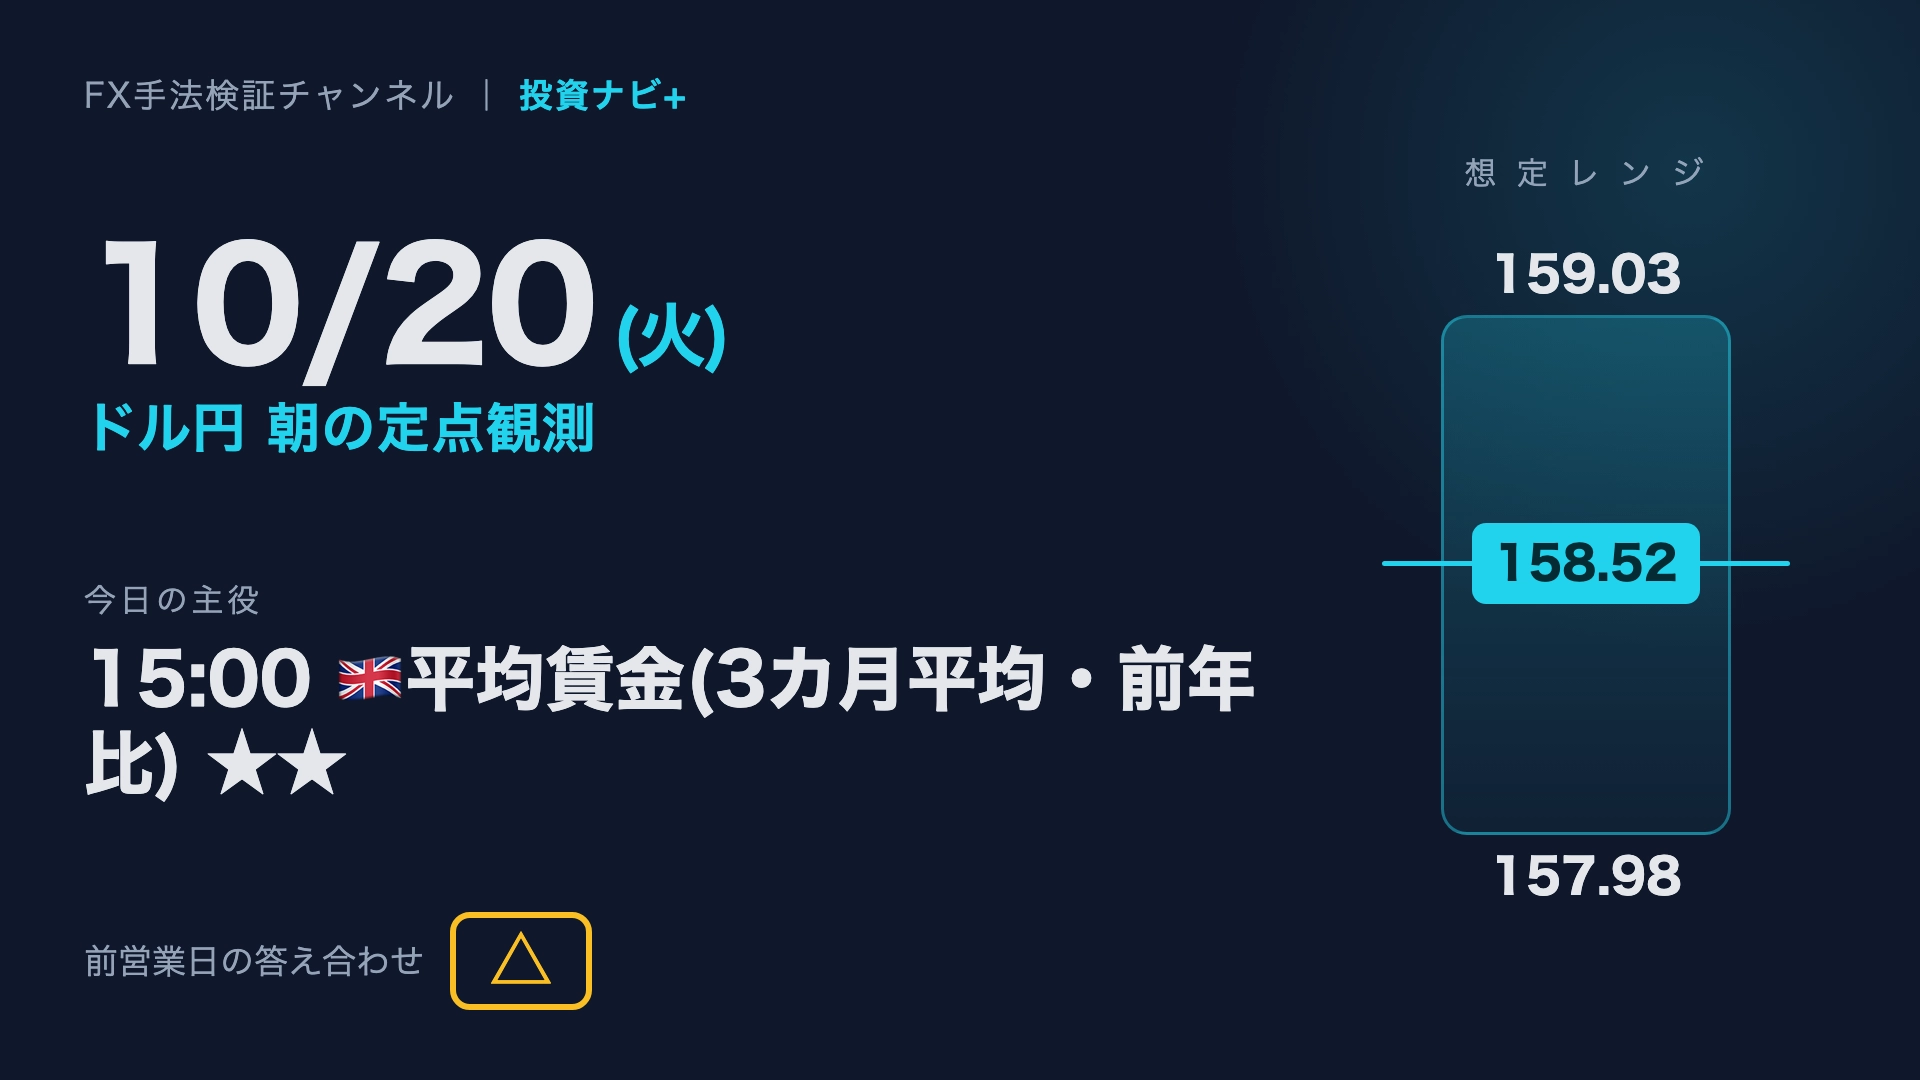
【10/20 Tue】USD/JPY Morning Fixed Observation|The star at 15:00: U.S. average hourly earnings (3-month average — year over year)★★
This is the morning record for Tuesday, October 20. Today's main focus is 15:00 UK average wage (three-month average, year-over-year)★★. The USD/JPY current price is 158.52 yen, with an expected range of 157.98 to 159.03 yen.
The answer from the previous business day was a draw. Below are the indicators, charts, and scenarios in order.
First 60 seconds — Today's economic indicators

Today's economic indicators (10/20 8:30〜 JST 8:29 next day)
Today is a Gotō day.There is a tendency for dollar-buying demand ahead of the 9:55 fix.
| Time (JST) | Country | Indicator | Importance | Forecast | Prev |
|---|---|---|---|---|---|
| 15:00 |  | Average wage (three-month average, YoY) | ★★ | 3.8% | 3.9% |
| 15:00 |  | PPI (MoM) — Germany | ★ | 1.5% | 1.1% |
| 15:00 | | Initial jobless claims | ★ | 19.4K | 27.8K |
| 15:00 | | Unemployment rate (ILO) | ★ | 4.9% | 4.9% |
| 17:00 | | Current account | ★ | 29.2B | 27.6B |
| 18:00 | | German ZEW Economic Sentiment Index | ★ | 30.2 | 34.7 |
| 18:00 | | ZEW Economic Sentiment Index | ★ | 23.6 | 25.8 |
| 18:33 | | 10-year bond auction | ★ | — | 5.38|3.3 |
| 21:15 |  | ADP weekly employment | ★ | — | 24.8K |
| 21:30 | | Building permits | ★ | 1.39M | 1.39M |
| 21:30 | | Housing starts | ★ | 1.30M | 1.28M |
| 23:00 | | Pending home sales index (MoM) | ★ | -0.7% | 0.3% |
| Next 02:00 | | Green BoE MPC member remarks | ★ | — | — |
| Next 05:30 | | API weekly crude oil stocks | ★ | — | — |
Today’s moving points
The 15:00 UK average wage (three-month average, YoY) is forecast at 3.8% but previous was 3.9%, indicating a gradual slowdown in wage growth is priced in. If it beats estimates, the pound may rise; if it misses, the pound may weaken, with possible spillover to the dollar/yen via the pound/yen. This is viewed as a lead-up to tomorrow’s 15:00 UK CPI.
Dollar/Yen — current position
Current value158.52 (previous business day close 158.53 / day-on-day +0.51)
Estimated range157.98 (Pivot S1) ~ 159.03 (20-day high)
BaselineRange between 157.98 and 159.03. Direction awaiting the 15:00 indicators.
AlternativeIf breakout above 159.03, test 160.21; if break below 157.98, move to 157.43.
Daily chart environment
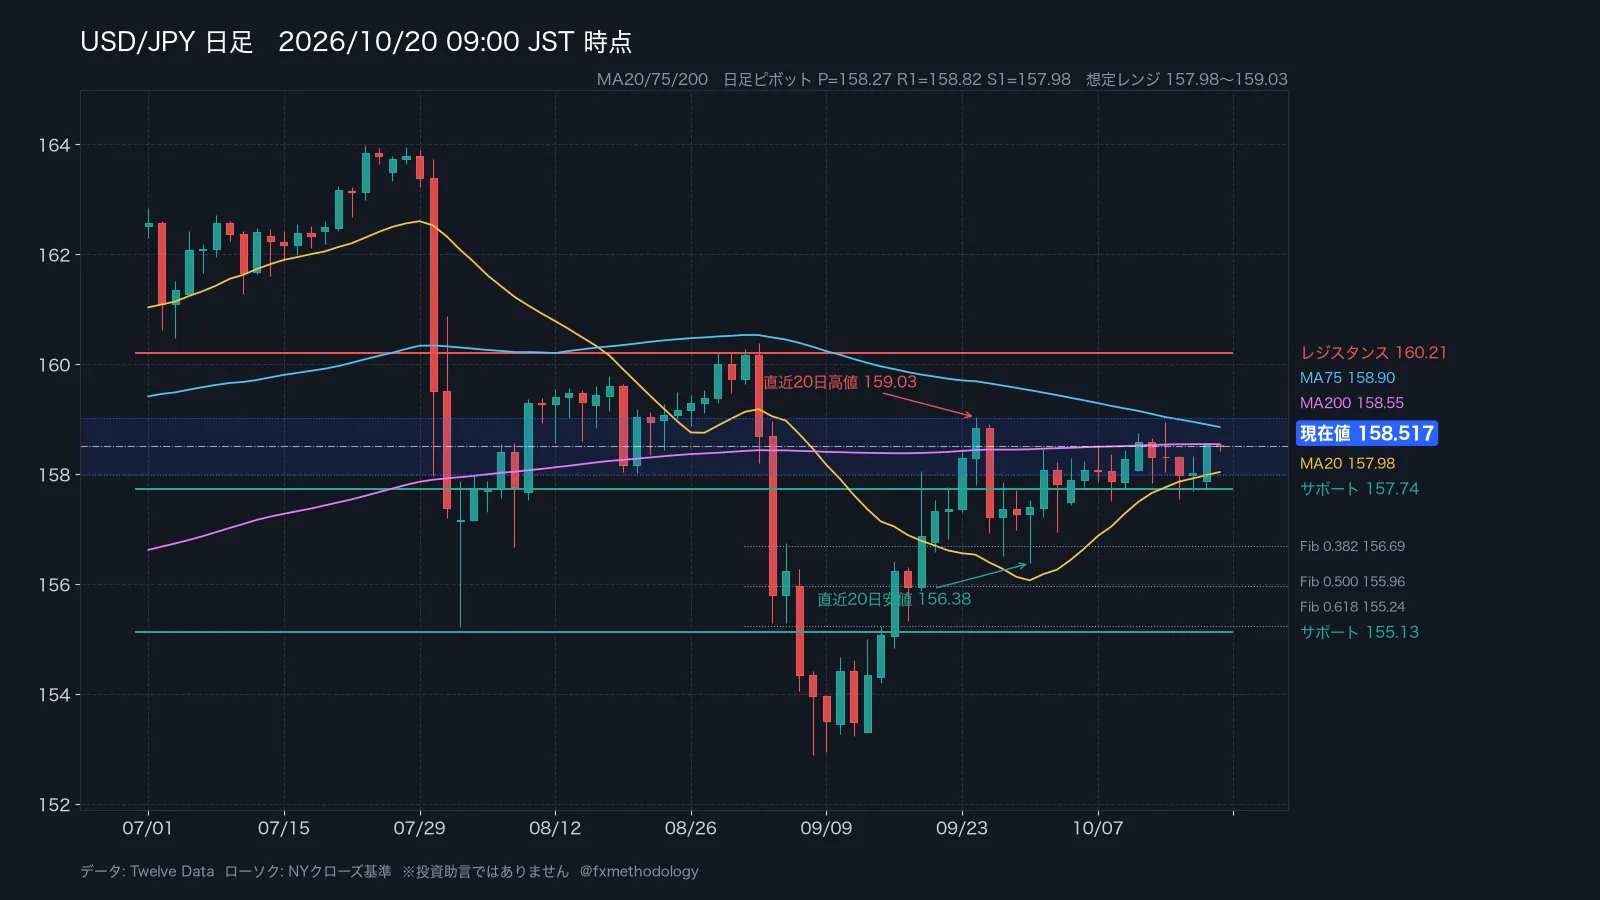
The daily chart is in a tug-of-war with moving averages tangled (no clear arrangement). Three lines are interwoven and direction is unclear. The current price of 158.52 sits above the daily 20-day moving average 157.98. On the upside, 159.03 is the 20-day high (9/24), then 160.21. On the downside, 157.74, then 155.13 serve as auto-detected supports. The 0.382 retracement of the rise from 152.89 to 159.03 sits at 156.69. ATR14 is 85 pips.
4-hour chart — notable lines
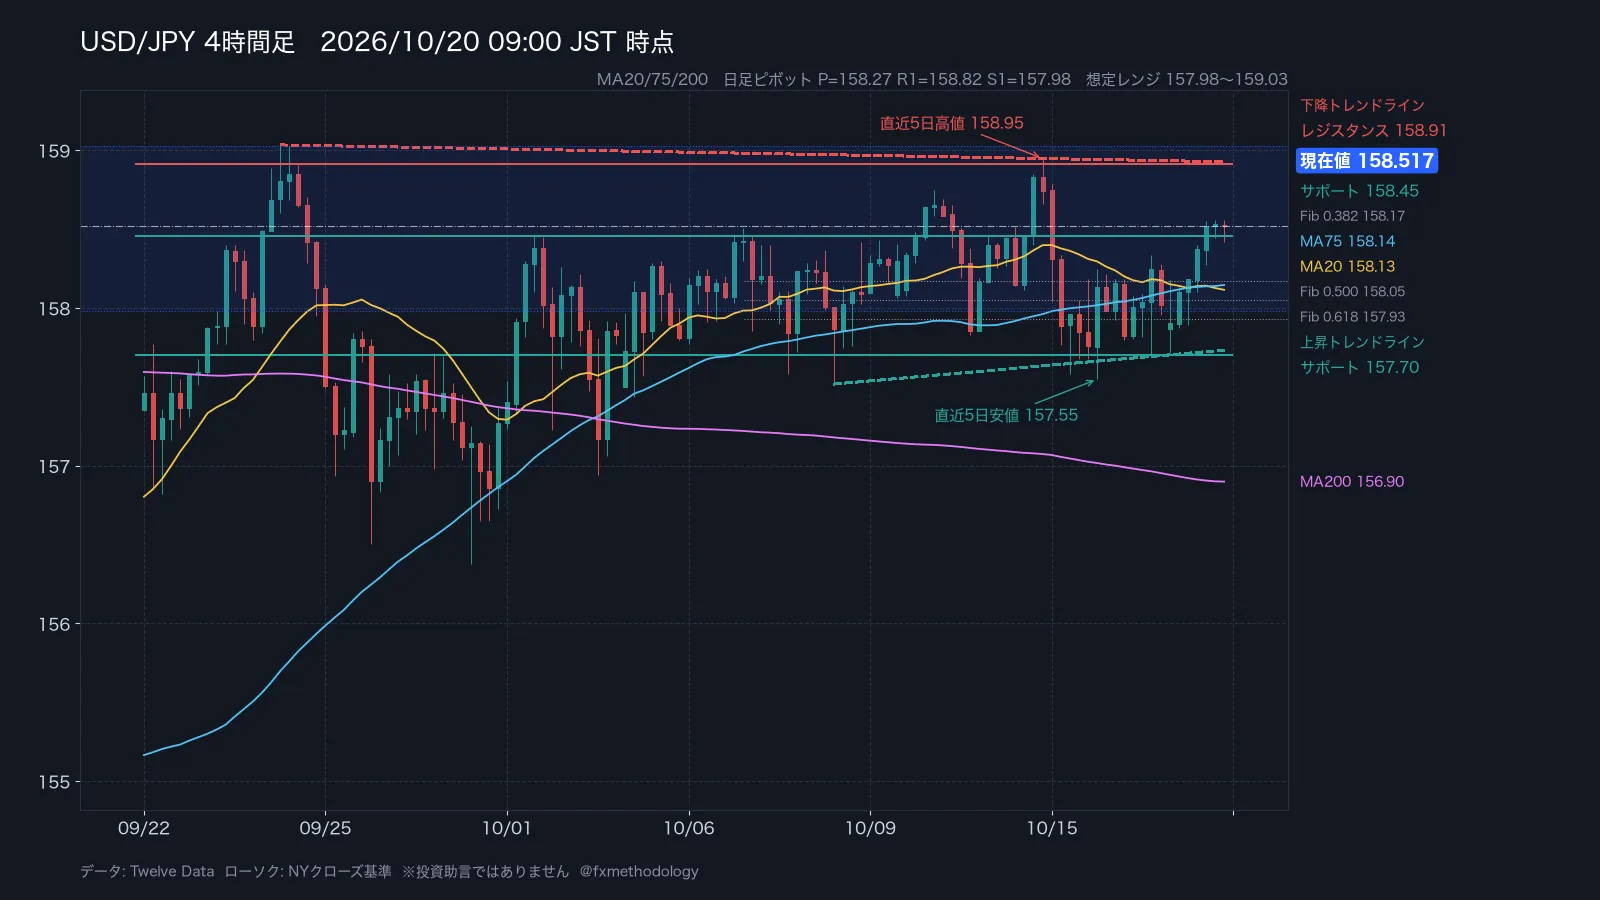
The 4-hour chart also has three lines crossing with no clear direction. On the upside, 158.91; the downward trendline starting at 9/24 22:00 comes near 158.93. On the downside, 158.45, below which are 157.70, and the upward trendline starting at 10/9 02:00 around 157.73. ATR14 is 34 pips, and current range is relatively small.
Connecting indicators and charts
Today, the biggest focus is the 15:00 UK average wage (three-month average, YoY). Until then, volatility is unlikely and the range of 157.98–159.03 is likely to hold. Pivot is P at 158.27, R1 at 158.82, S1 at 157.98. If price breaks above 159.03, 160.21 becomes a likely target; if it breaks below 157.98, 157.43 in S2 becomes a focus.
Also in the video — Dollar/Yen morning fixed-point observation

Answer from the previous business day
It was a draw. It briefly broke above the upper bound to 158.56, but the close at 158.53 remained inside the range. The result was judged as a draw.
Yesterday's USD/JPY closed at 158.53, up 0.51 from the previous day, with a high of 158.56 and a low of 157.71, a range of 84 pips. It seems to have tested higher while closing near the high zone.
Backtesting data
Today is a Gotō day. The average daily range of USD/JPY from 9:00 to 10:00 on Gotō days (past 230 occurrences) is 32 pips (typical days 30 pips); the percentage of up moves from 9 to 10 is 47%. It’s not as one-sided as often claimed^^;
Today we see a touch of the MA200 from below. The up-day rate after touching the MA200 from below (past 10 years, 105 cases) is 49%, with average move of +2 pips. The direction is almost a toss-up, suggesting a range-bound number^^
Today's question
Which do you think will be tested first, 159.03 or 157.98?
If you’re willing, please tell us with a like or comment.
FX Method Research Institute published on GogoJungle


※Note: The validation uses USD/JPY hourly data from January 2016 to March 2026. It does not guarantee future performance.
Indicator data: edited from Forex Factory / Tradays; Price data: Twelve Data (as of 2026-10-20 09:00)
※This is the personal view of Tsuji. Please make investment decisions on your own.