

After SILVER fell sharply, can it still sell? Consider pair BB expansion and profit protection
In a market that has fallen sharply by breaking through the lows, can we still aim for further selling? If you already hold a short, where should you secure profits? This shows examples of using the pair’s BB expansion and the short-term side’s contraction for each judgment.
In SILVER on October 14, 2026, after confirming a break below the most recent low, 75 minutes later we could confirm the BB expansion on the hourly and 15-minute charts. By this point, price movement had already appeared. We will focus on examining the selling possibility from that point and later reviews of holding.
First, confirm which low was broken
The 15-minute 11:00 bar fell to $58.37400 and closed at $58.52750. The 11:30 low was $58.44500, higher than the previous low. This is a scene where you can identify $58.37400 as a mark of the nearest lower bound.
The 12:30–12:45 bar closed at $57.76200 and ended below this mark. At 12:45, you can confirm the intended breakout below the low.
Even the bars that broke through show larger price movement. If you’re considering selling here, you will check the distance from the mark and your exit criteria. The next section centers on confirming the pair’s expansion 75 minutes after this breakout.
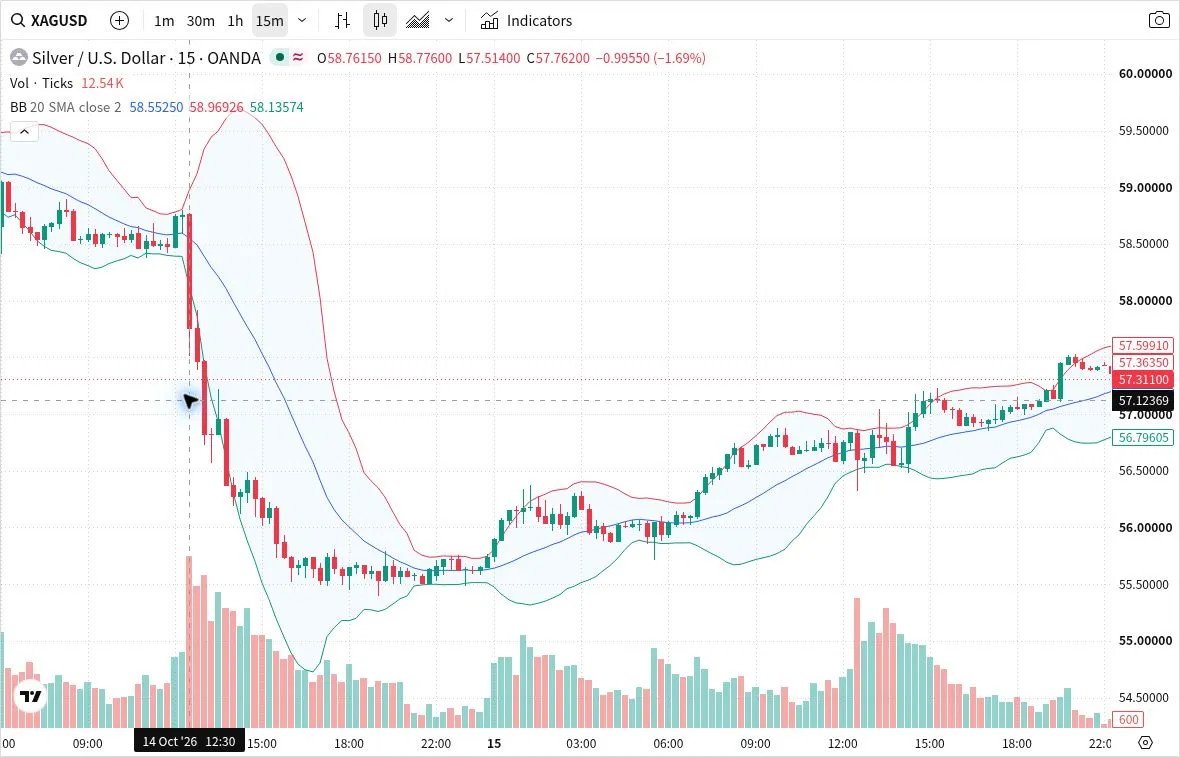
The moment the low was broken. 12:30 of October 14, 2026 (15-minute bar, 12:45 confirmed). Close at $57.76200. This is the moment when the previously identified low was closed below at the close.Chart: TradingView(UTC · Click the image to enlarge)
Using the 75-minute pair expansion from here as a basis to decide to sell
At 14:00, the 13:00 hourly bar and the 13:45 15-minute bar were confirmed.
Compared with the immediate previous bar, the hourly BB upper rose from $59.73575 to $60.10817. The lower bound fell from $58.00416 to $57.35289. For the 15-minute bar, the upper bound rose from $59.49406 to $59.60495, and the lower bound fell from $56.93739 to $56.60995.
In both timeframes, the bands expanded outward and the price moved downward. Although the BB upper bound rose, we do not take this alone as a buying justification. The reason to consider selling lies in the price breakout, and we observe the change in the chosen timeframe on the BB.
The 14:00 close was $56.37650. From the initial mark of $58.37400, the price had already moved down by about $2.00. The condition for initiating after a breakout is different.
If you are going to sell from here, compare the remaining room to the next support with your exit position when the price retraces. Verify whether the planned loss amount can be accommodated, and if conditions agree, consider selling. If the distance doesn’t fit, wait for a rebound. Even after confirming the pair expansion, judge including the price position.
If you were already short, continue to hold while using the breakout and pair expansion as factors for continuing or not, and also track your planned profit-taking conditions. This example confirms the state 75 minutes after the breakout.
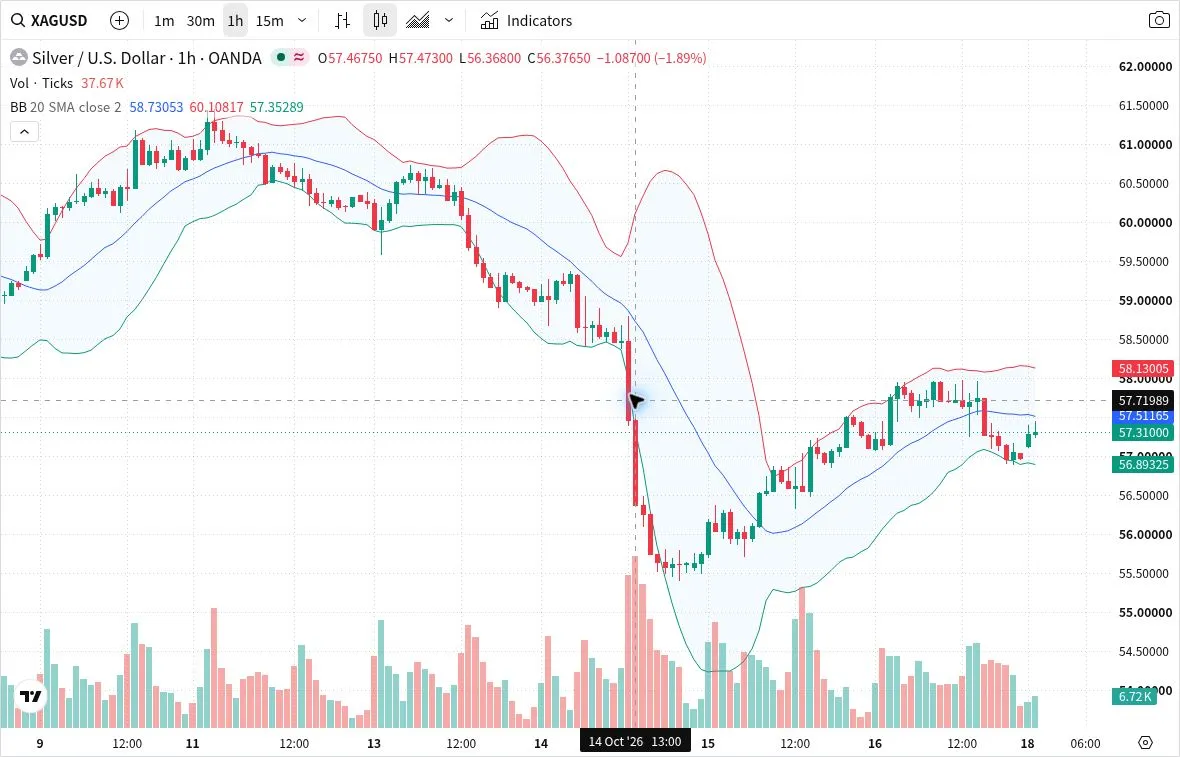
14:00 Common confirmation: 1-hour chart. October 14, 2026 at 13:00 (1-hour chart, 14:00 confirmed). BB upper $60.10817, BB lower $57.35289. A common confirmation point with the next 15-minute bar.Chart: TradingView(UTC · Click the image to enlarge)
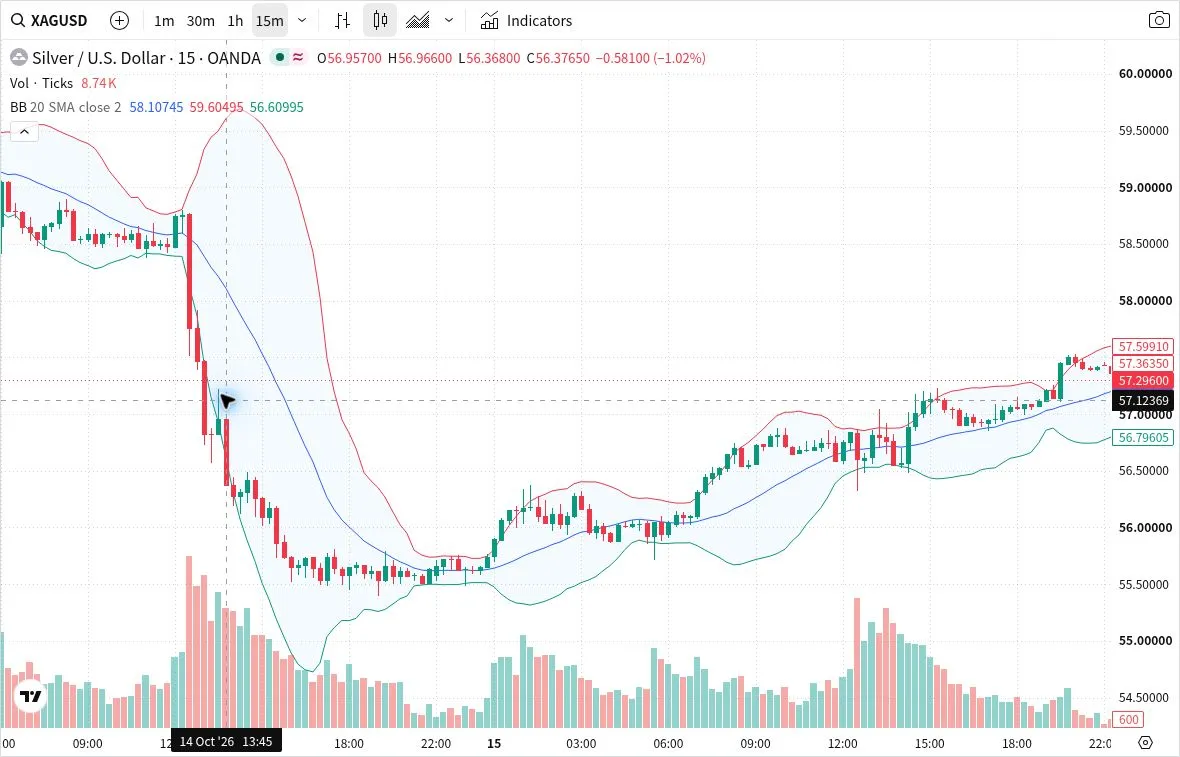
14:00 Common confirmation: 15-minute chart. October 14, 2026 at 13:45 (15-minute chart, 14:00 confirmed). Close at $56.37650, BB upper $59.60495, BB lower $56.60995. Check the price decline and the pair’s condition separately.Chart: TradingView(UTC · Click the image to enlarge)
As the price falls, review the level at which profits are protected
The subsequent 17:00–17:15 bars closed at $55.53250. This is lower than the previous 16:45 close of $55.63900, and the price decline continues.
Meanwhile, the BB upper bound fell from $58.42793 to $58.02850, and the BB lower bound rose from $54.72532 to $54.80335. By 17:15, you can see the 15-minute band has moved inward.
If you were holding a short, confirm the planned profit-taking condition or the most recent high near a retracement. Decide whether to adjust your exposure or protect profits. Even as the price continues to fall, you can verify decisions triggered by the short-term contraction.
This bar’s close is below the central line of $56.41593. Do not switch to buy solely on contraction; compare with the conditions for continuing the short. Use this moment as a signal to consider profit protection during a decline.
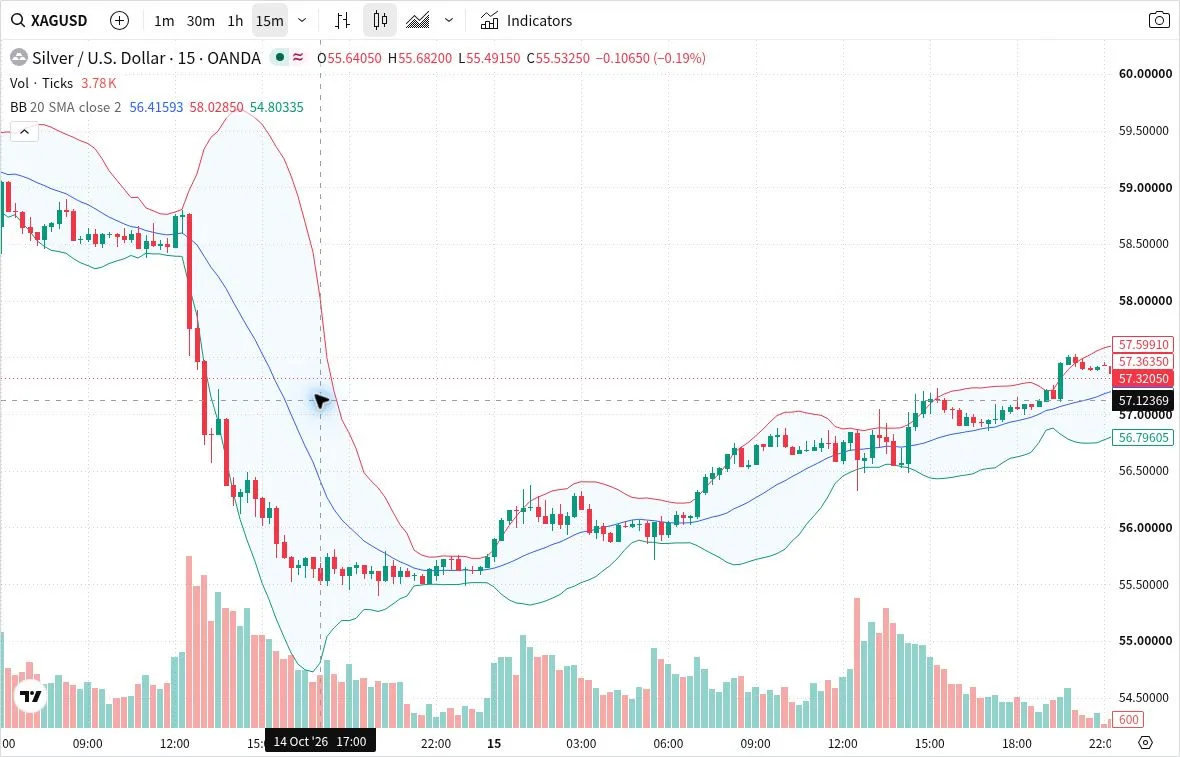
Considering profit protection during a decline. October 14, 2026 at 17:00 (15-minute bar, 17:15 confirmed). Close at $55.53250 is below the BB center line of $56.41593. Compare BB upper $58.02850 and lower $54.80335 with the state of the previous bar.Chart: TradingView(UTC · Click the image to enlarge)
Deciding to chase suggests and protecting the shorts you hold
This pair expansion was confirmed at the breakout’s 75-minute-later bar. From here, assess whether further selling is possible in concert with price position, and while holding, also monitor the short-term contraction. When you separate the conditions for entry and profit protection, you can still use BB in your judgment after a price move.
With BB Watch, you can compare the BB changes of multiple timeframes that you select for your method in the same window. If you want to track changes from the pair expansion through the holding period on the short-term side, you can check the product page for display and usage.
View BB Watch display and usage
BB Watch is currently paused from sale due to bug verification.
Choose a pair according to the wave you target and your method. For a 4-hour wave, consider 1-hour × 15-minute bars; for a 15-minute wave, 5-minute × 1-minute bars, and so on. It is not a fixed combination. If only the lower timeframe expands, separately verify the changes in the other timeframe and the price position.
Observational conditions
The target is OANDA:XAGUSD on October 14, 2026, using the 1-hour and 15-minute charts. Price is in USD per troy ounce. BB period 20, SMA, close, and standard deviation 2. Times are UTC; Japan time adds 9 hours. The bar times are start times; H1 confirms after 1 hour, M15 confirms after 15 minutes.
The breakout is at 12:45, the pair comparison uses 14:00, and the contraction comparison uses the confirmed value at 17:15. The exact moment when the expansion begins intraday is not measured, and the BB Watch signal time is not used as a universal trading condition. The horizontal dashed line in the image is a crosshair, not a support line.
This is a retrospective using actual TradingView charts. The right side of the image also contains later bars, but for each stage only the confirmed values at that time are used in the explanation. This does not represent actual trading or profits. Trading involves the possibility of loss.
Chart provided by TradingView. The instrument is OANDA:XAGUSD, display time is UTC.
TradingView