

Targeting a breakout of BTC’s resistance high. Review of the pair’s BB expansion and the conditions for continuing to buy
If you are considering buying after breaking a high, follow the breakout price afterward as well. The place used as the basis for the setup also serves as a signal to review your position.
On BTC as of October 18, 2026, at the moment of confirmation 15 minutes after breaking the retrace high, we could confirm the BB widening for both the 1-hour and 15-minute charts. We will look from the moment of considering a buy to when the price cannot hold the breakout level anymore.
Use the previously reached high as a mark for considering buys
The 15-minute chart at 03:45 rose to $81,963 and closed at $81,848. It subsequently pulled back downward. This high will be used as a localized resistance to confirm on the next upside breakout.
The 09:30–09:45 bar closed at $82,082, beating the high on the close. At 09:45 you can confirm the price-side basis that “the retrace high we were watching was broken.” Next, we illuminate the BBs of the time frame chosen to align with the wave we are aiming for.
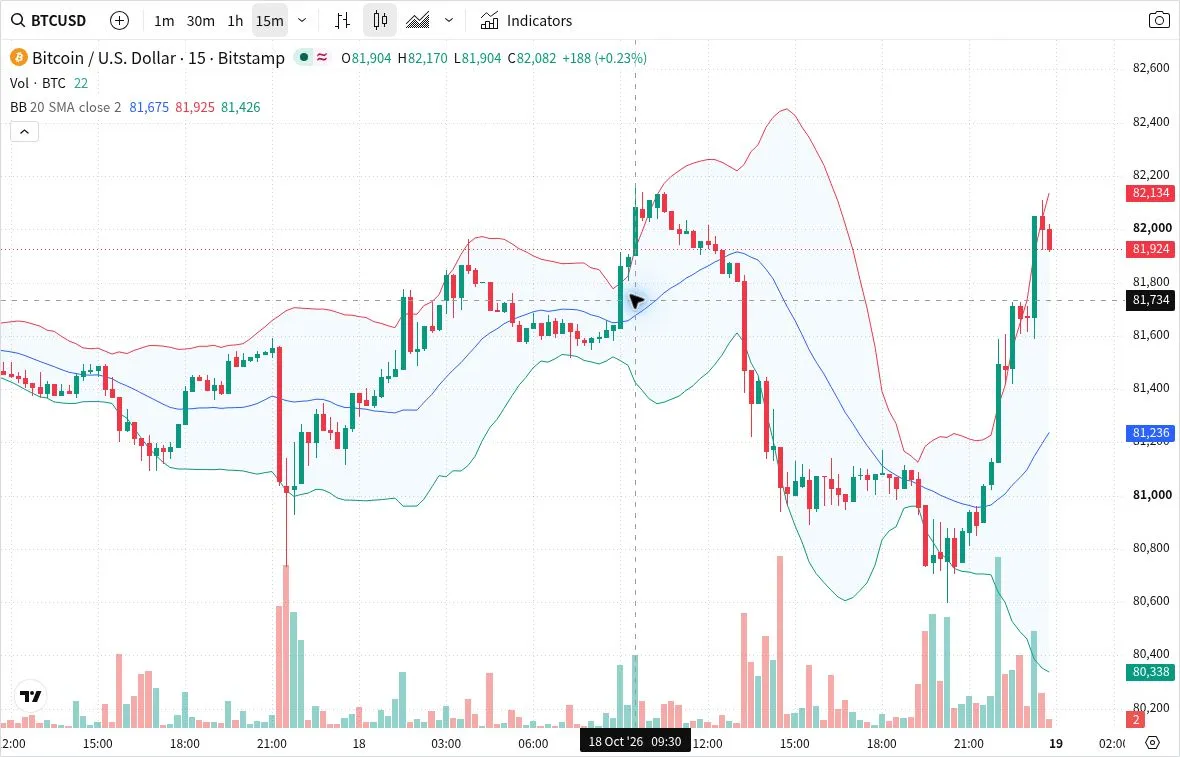
The moment the retrace high was broken. 2026-10-18 09:30 bar (15-minute chart, 09:45 confirmation). Close at $82,082. We confirm the moment when the retrace high we previously identified was broken.Chart: TradingView(UTC・Click the image to enlarge)
15 minutes after breakout, confirm the pair’s expansion
At 10:00, the 09:00 bar of the 1-hour chart and the 09:45 bar of the 15-minute chart were confirmed. This is 15 minutes after confirming the breakout at 09:45.
The upper BB on the hourly chart rose from $81,865 to $81,969. The lower band fell from $81,067 to $81,029. On the 15-minute chart, the upper band rose from $81,925 to $81,990, and the lower band fell from $81,426 to $81,396. This is a comparison with the immediately preceding bars on each time frame.
At this common confirmation time, the pair’s upper and lower bands are expanding outward. The close is $82,045, which also surpasses the mark at $81,963. After the breakout of resistance and the widening of the pair, you can consider buying.
If you were to act from here, there is a distance of $82 to the breakout high. We compare the potential to reach higher resistance with the distance to exit. If it fits your plan, consider buying; otherwise, wait for the next configuration. Looking at price position after confirming the expansion makes the decision more concrete.
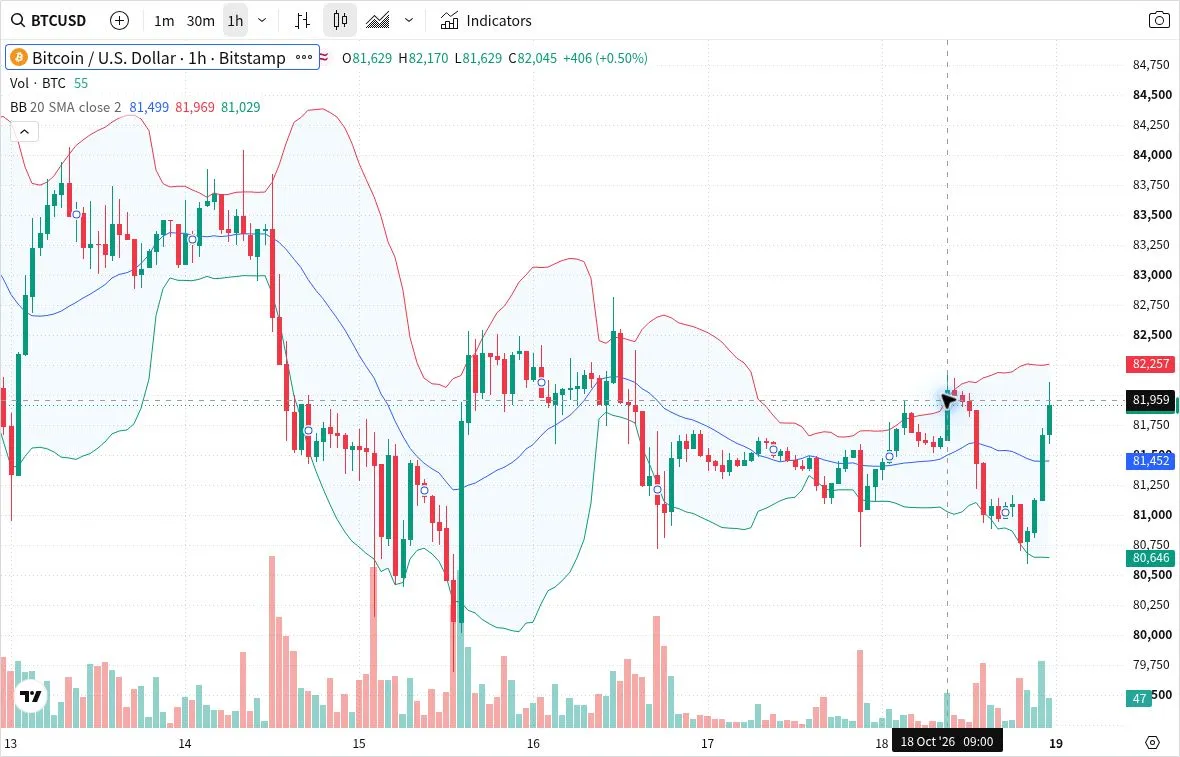
Common confirmation at 10:00: 1 hour chart. 2026-10-18 09:00 bar (1-hour, 10:00 confirmation). BB upper $81,969, lower $81,029. The same confirmation state as the next 15-minute bar.Chart: TradingView(UTC・Click the image to enlarge)
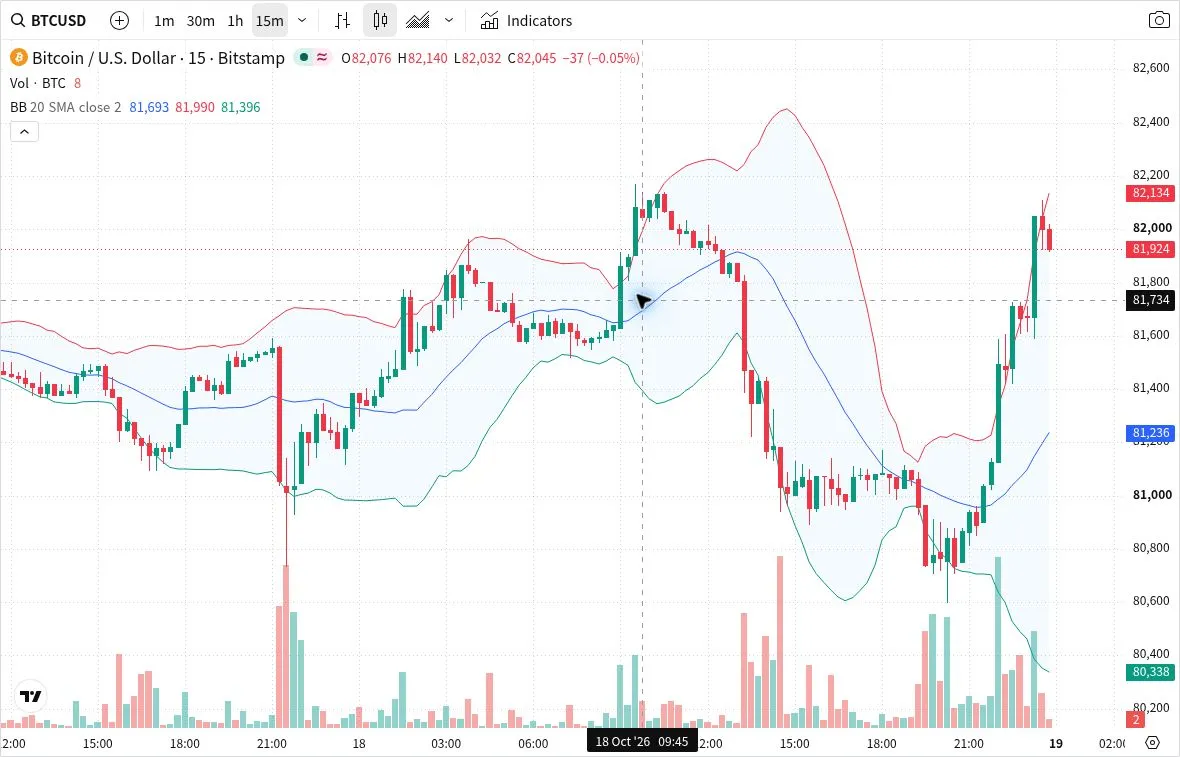
10:00 Common confirmation: 15-minute chart. 2026-10-18 09:45 bar (15-minute chart, 10:00 confirmation). BB upper $81,990, lower $81,396. The close of $82,045 is above the retrace high used as a reference.Chart: TradingView(UTC・Click the image to enlarge)
Keep an eye on the breakout high while holding
The subsequent 10:15 bar closed at $82,131. At the 10:30 confirmation, the price remains above the breakout high. If you were holding a buy, this is the stage to compare with your planned profit taking conditions and the nearest swing low. Consider whether to continue holding or to reassess where to place the exit to safeguard profits.
Meanwhile, the 11:45 bar closed at $81,955. By 12:00 you can confirm that it dropped below the mark of $81,963. The close of this bar was above the BB middle line at $81,847. You do not have to wait for the middle line break to meet the condition of wanting the breakout high to stay above.
Compared with the 10:00 close of $82,045, the 12:00 close was $81,955. If you assume buying and settling at these two points, the price difference is negative. A rise in between does not in itself guarantee profit protection. Decide profit protection and exit conditions before entering, and use only the expansion you saw at entry to justify holding.
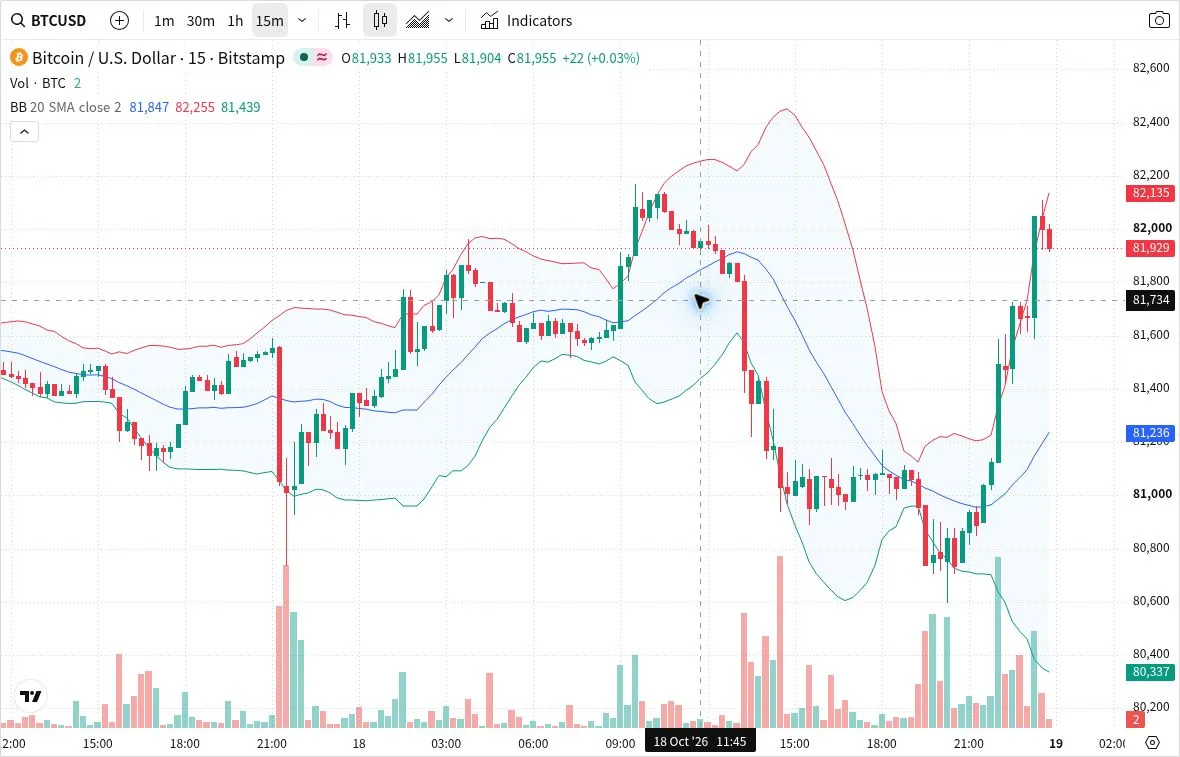
Are you maintaining the breakout level? 2026-10-18 11:45 bar (15-minute, 12:00 confirmation). Close at $81,955. While it fell below the retrace high, it remains above BB middle line at $81,847.Chart: TradingView(UTC・Click the image to enlarge)
Align price marks with the chosen pair
In this example, 15 minutes after confirming the retrace high, the pair’s BB expansion was confirmed on the confirmation bar. At that point, consider buying and, while holding, monitor whether the breakout level is still being held. By defining entrance and holding conditions, you can more easily incorporate BB changes into actual judgment.
BB Watch allows you to view BB changes of multiple timeframes chosen to fit your method in the same window. This is how to use or display the tool when you want to verify the pair’s changes while confirming price marks on the chart.
View BB Watch display and how to use
BB Watch is currently paused for sale due to testing for issues.
Observation conditions
The subject is BITSTAMP:BTCUSD on October 18, 2026, the 1-hour and 15-minute charts. Prices are in US dollars, with the chart’s integer values shown. BB uses a period of 20, SMA, close, and standard deviation 2. Times are in UTC; Japan time is UTC plus 9 hours. The bar times reflect their start times; H1 confirms after 1 hour, M15 after 15 minutes.
Breakout is at 09:45, pair comparison at 10:00, and holding review at the 10:30 and 12:00 confirmations. The moment when both expansions start within market hours or when BB Watch signals are not measured. The 4-hour wave verification is outside the scope as well.
This is a retrospective using a real TradingView chart. The right side of the image contains later bars, but only the confirmed values at each decision point are used in the explanations. It is not actual trading results. Trading involves the possibility of losses.
Chart provided by TradingView. Ticker is BITSTAMP:BTCUSD, display time is UTC.
TradingView
We select pairs according to the wave and method being targeted. For example, for a 4-hour wave, you might view it as 1-hour × 15-minute; for a 15-minute wave, as 5-minute × 1-minute. The combination used here is not a fixed correct answer. When only the lower time frame is expanding, confirm the breakout and the other changes separately. Waiting for the bar to close is not a universal trading condition. The horizontal line in the image is a crosshair, not a resistance line.