
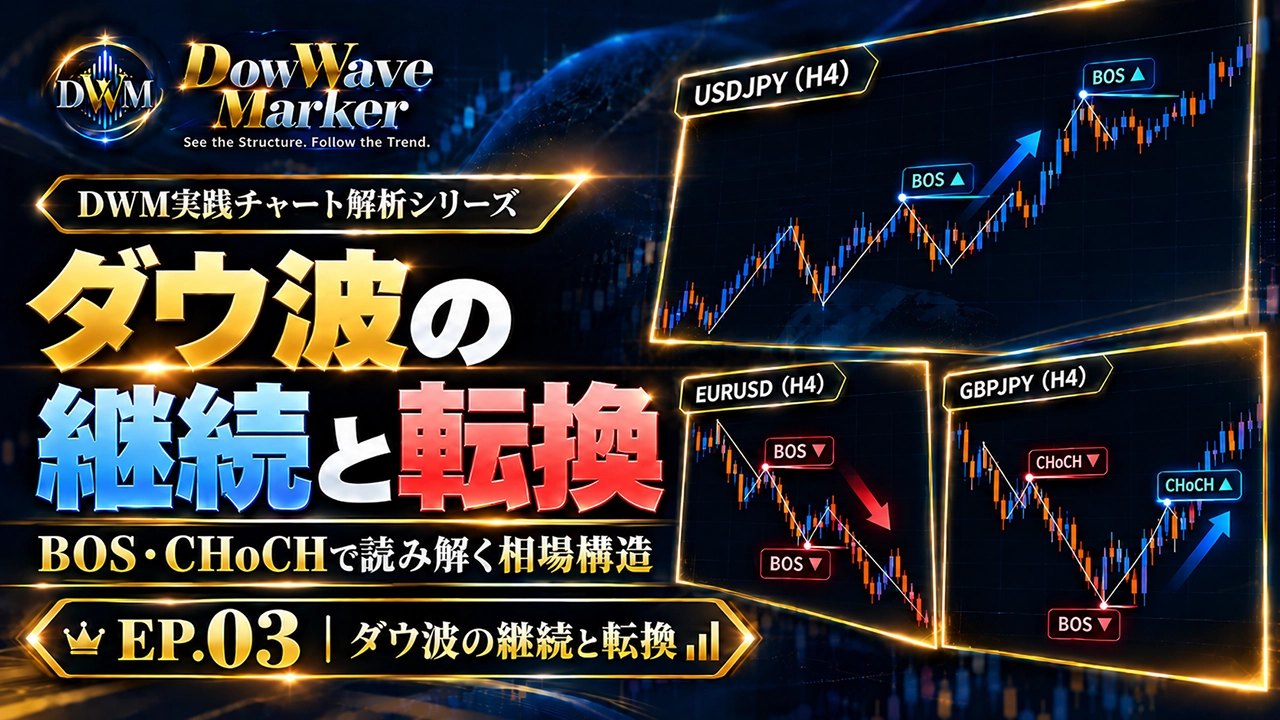
How to discern the continuation and turning points of the Dow Wave? Explaining CHoCH and BOS with 5 charts【DWM Practical Chart Analysis EP.03】
DOWWAVE MARKER | DWM Practical Chart Analysis Series EP.03
How to identify the continuation and turning points of the Dow waves?
Understanding market structure changes through BOS and CHoCH
From the continuation of uptrends and downtrends to reversals after CHoCH and direction changes of BOS. Using five charts, we practically interpret the structure of Dow waves.
Is the trend continuing? Or is a reversal beginning?
In Dow theory, market structure is captured by the sequence of higher highs and higher lows and lower highs and lower lows.
But on actual charts, multiple waves form as prices move up and down, so.The boundary between trend continuation and turning points can be hard to discern in some scenes.
DowWave Marker(DWM)is an indicator that visualizes the swing structure based on Dow theory, making it easier to grasp structural changes or updates via CHoCH and BOS.
This time, we will use five charts of USDJPY, GBPAUD, and GOLD to compare cases of trend continuation with cases where the structure changes.
What matters is not to decide trades solely from the display of CHoCH and BOS. It is to read how the high and low structure has changed around the appearance of the signals.
DWM PRACTICAL CHART ANALYSIS / EP.03
Watch the video: Dow wave continuation and turning
Comparing candlestick charts without DWM structure display to the DWM structure display, we explain trend continuation through BOS and the after-CHoCH developments.

After watching the video, you can revisit the points with the chart comparisons below.
01 / MARKET STRUCTURE
Continuation and turning of trends in Dow theory
In Dow theory, an uptrend is characterized by rising highs and higher lows, and a downtrend by falling highs and lower lows.
However, a temporary price drop does not mean an uptrend has ended.
Conversely, a strong rally within a downtrend does not by itself indicate a reversal of the downtrend.
What to pay attention to is,which swing highs and lows are being updated, and which levels are being maintained.
Two structural information you can confirm with DWM
BOS(Break of Structure)
Display to capture updates in swing structure. It serves as evidence to evaluate trend continuation.
CHoCH(Change of Character)
Display to capture changes in the market structure in a direction different from the traditional one. It provides material to consider a possible turning point.
Neither BOS nor CHoCH guarantees future price moves.
It is important to verify the signal along with the price action before and after it.
02 / UPTREND CONTINUATION
USDJPY・1-hour: Continuation of the uptrend
First, we look at USDJPY on the 1-hour chart.
First,we will view a chart focused on candlesticks without DWM structure display.Then we will add the DWM structure display.
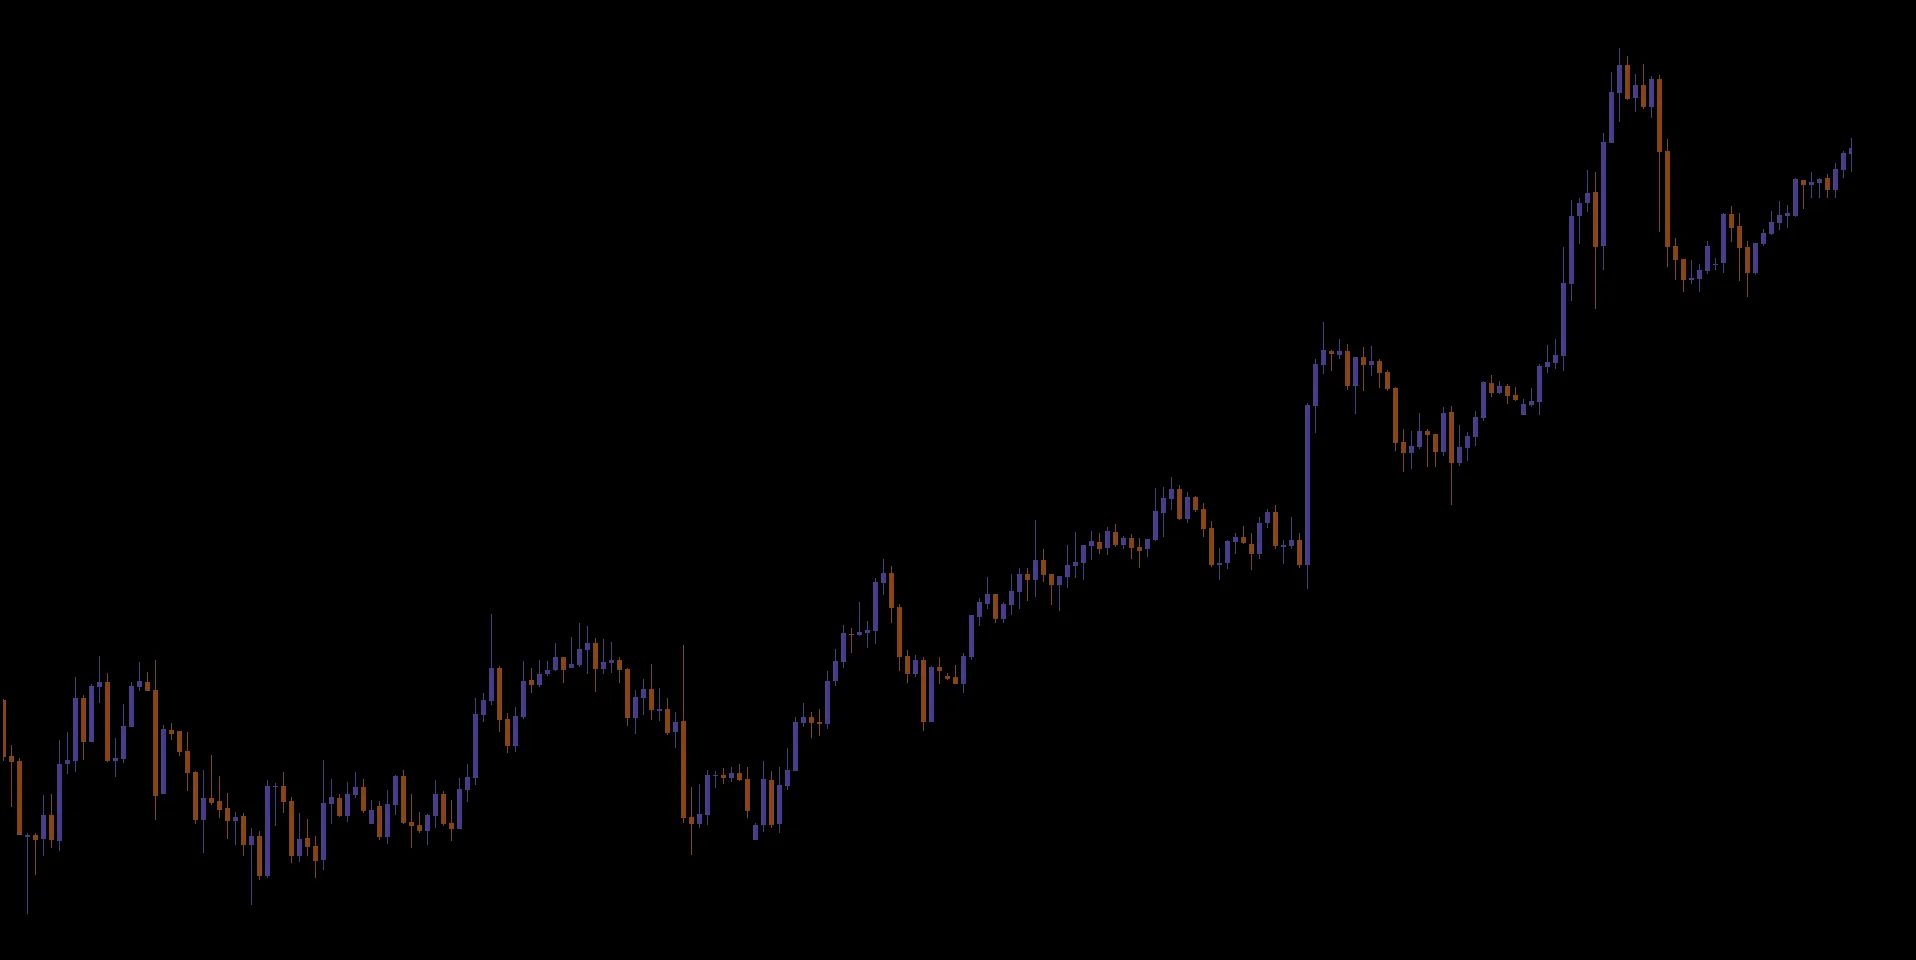
Looking at the candlesticks, the price dips many times while advancing.
Nevertheless, as long as the updates of high and low are maintained, the upward structure can still be regarded as continuing.
Structure update indicated by BOS▲
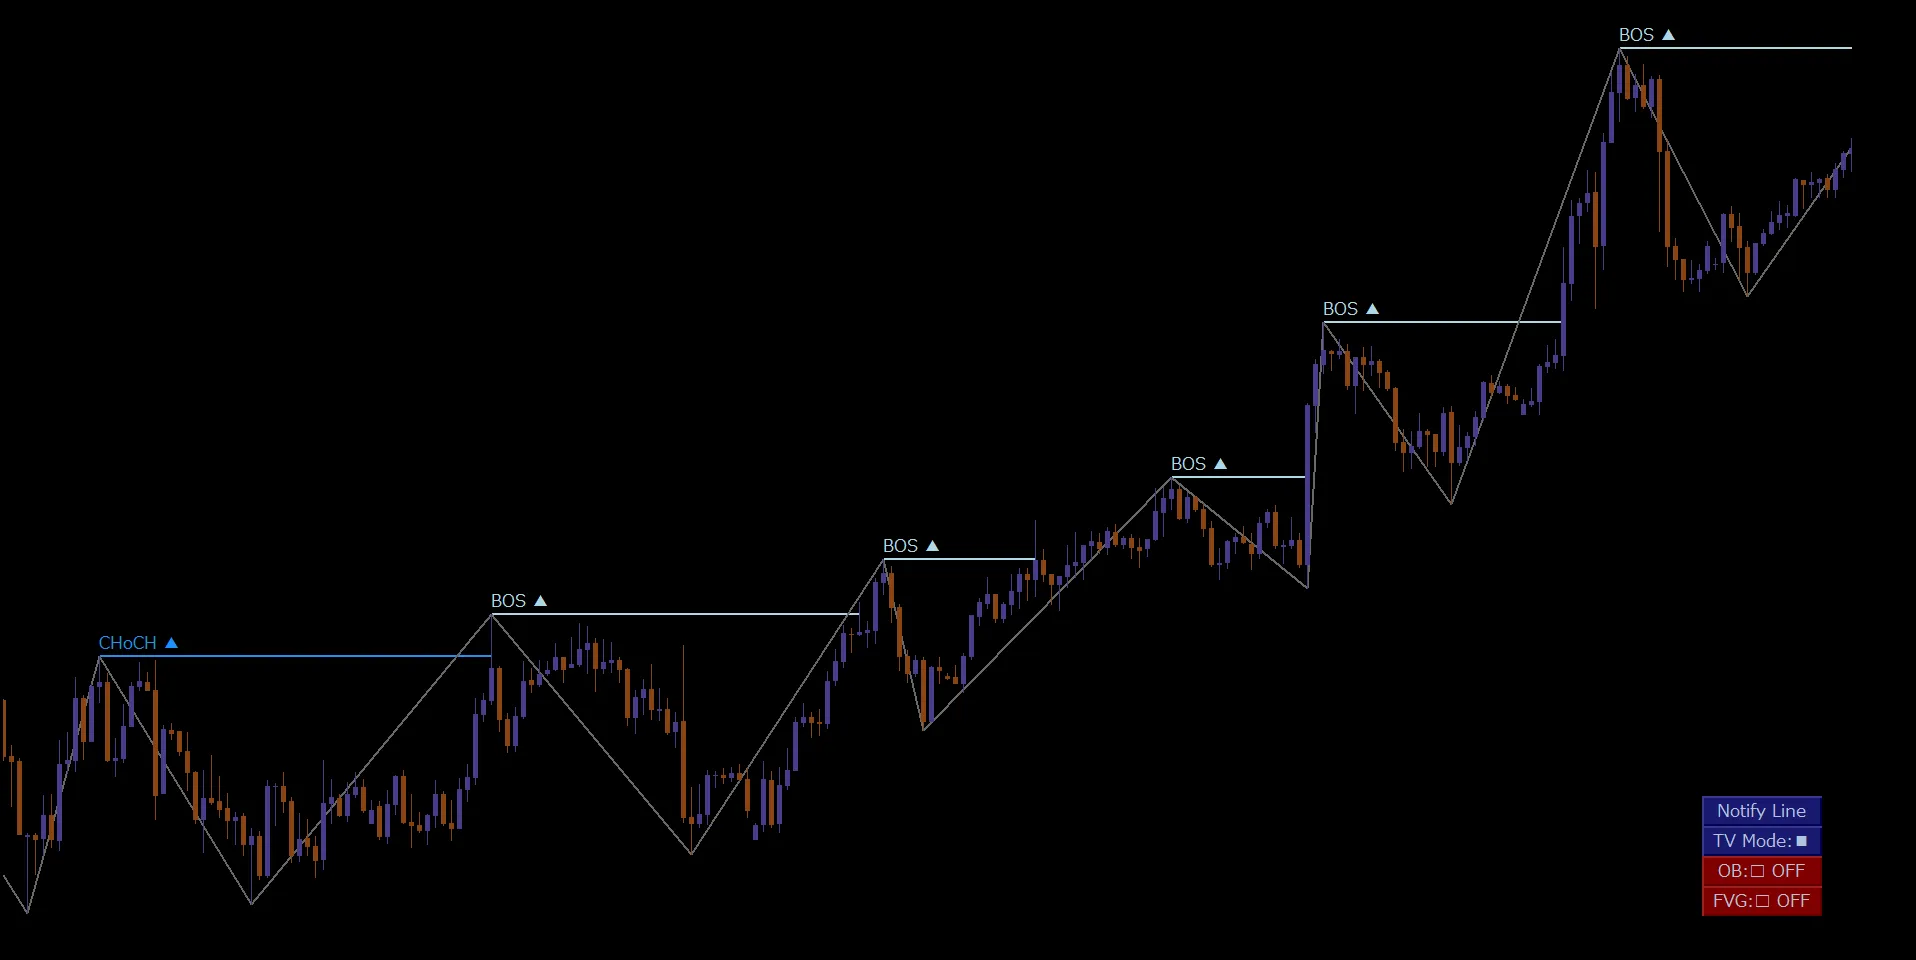
DWMshows a Dow wave that connects CHoCH▲ to multiple BOS▲, confirming the structure.
What matters here is not that BOS▲ appeared alone.
It is to view the pullbacks formed between BOS and the subsequent updates of new highs and lows.
BOS▲ is a clue to reading the upward structure. However, this does not mean you should buy immediately after BOS appears.
03 / DOWNTREND CONTINUATION
GBPAUD・4-hour: Continuation of the downtrend
Next is GBPAUD on the 4-hour chart.
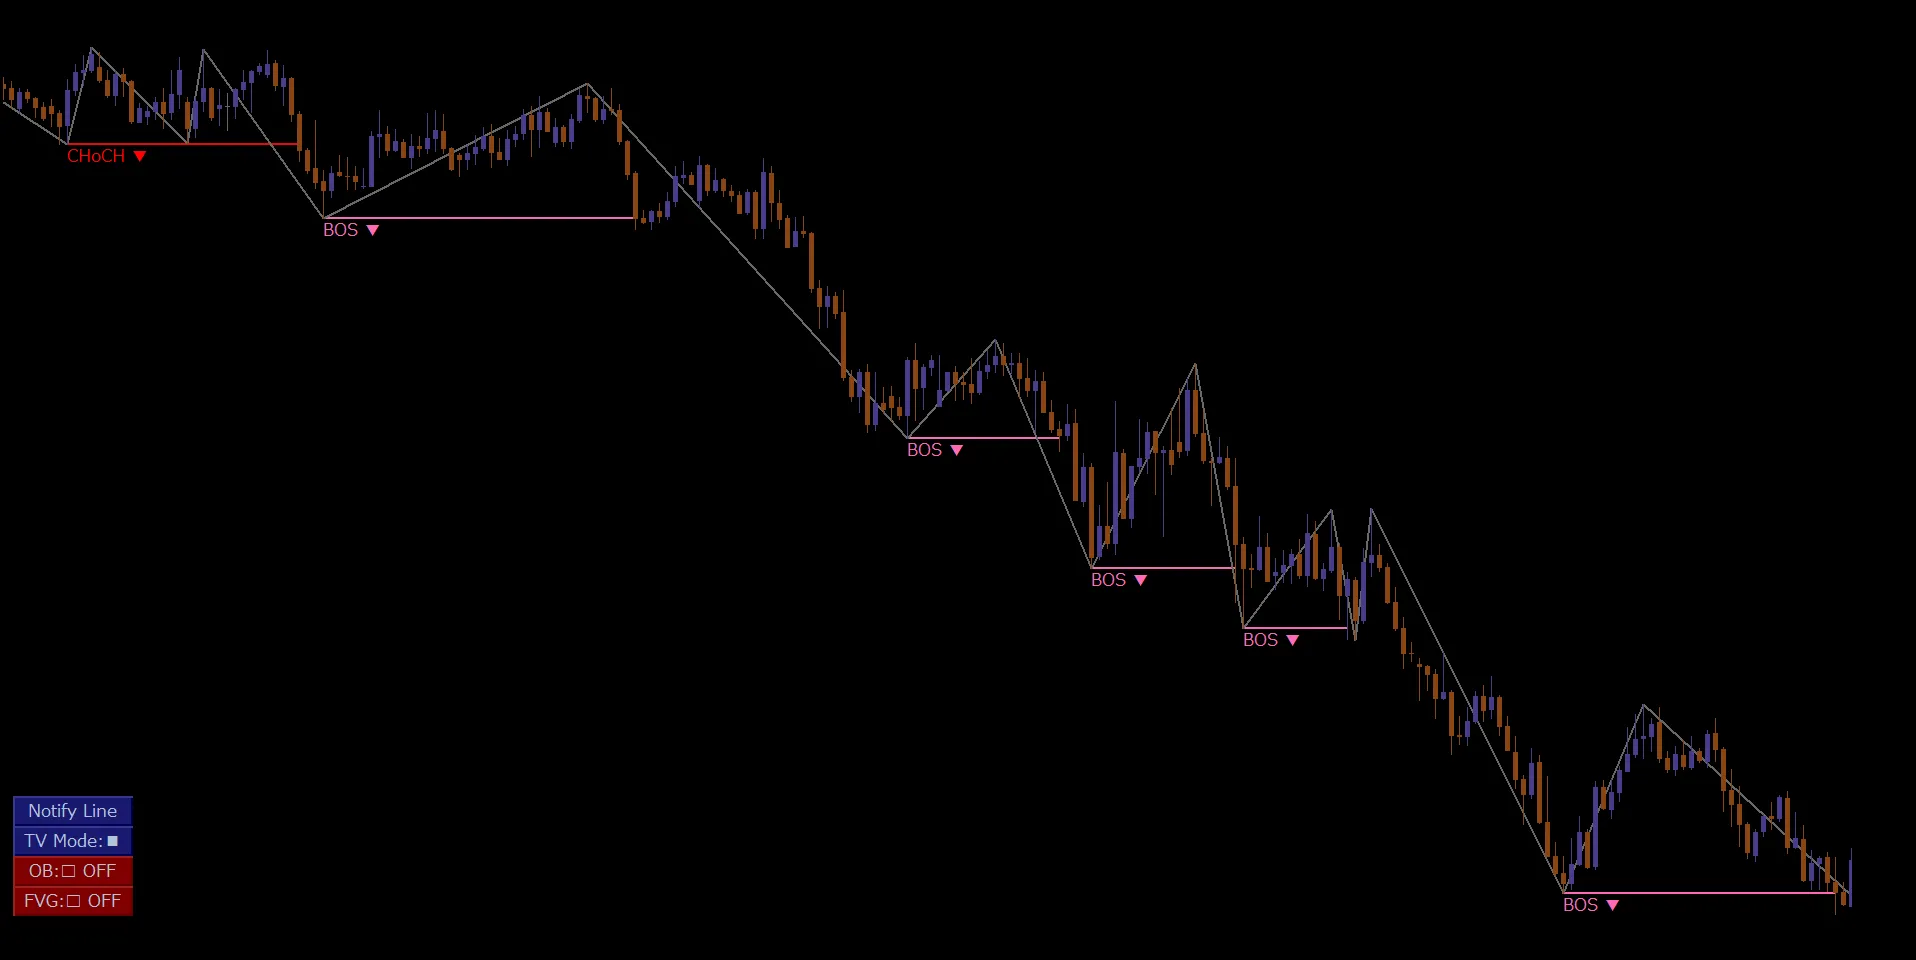
In this chart, after CHoCH▼, there are multiple BOS▼ in the downward direction.
Even if there is a temporary rise in price, if the high-lows continue to be lowered, the downward structure is considered to be maintained.
In the previous USDJPY example we confirmed BOS▲ in the upward direction, but the idea is the same.
What matters is not the temporary ups and downs of candles, butwhich swing highs and lows are being updated in which direction.
04 / STRUCTURAL CHANGE
GBPAUD・15-minute: Structural change from down to up
From here, we will verify a case where the structure changes rather than continuing the trend.
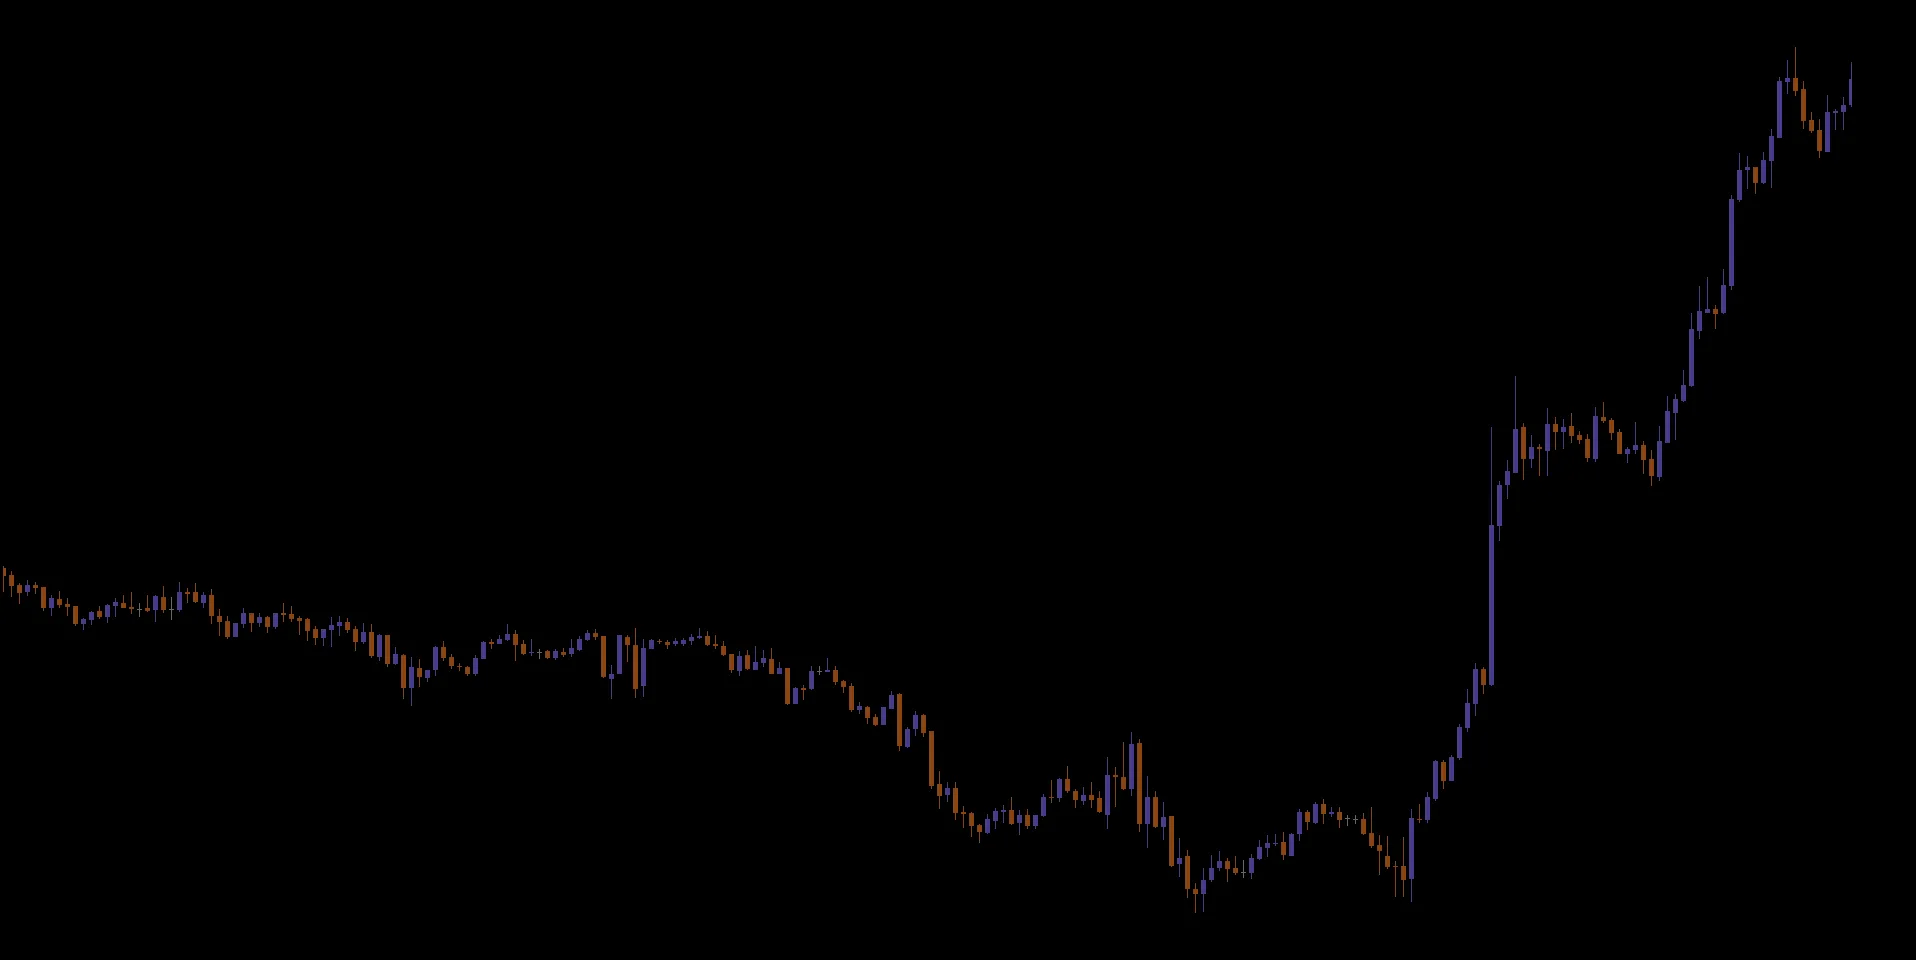
However, it is often hard to determine at what stage the market structure actually changes just from price action mid-move.
CHoCH▲ to BOS▲
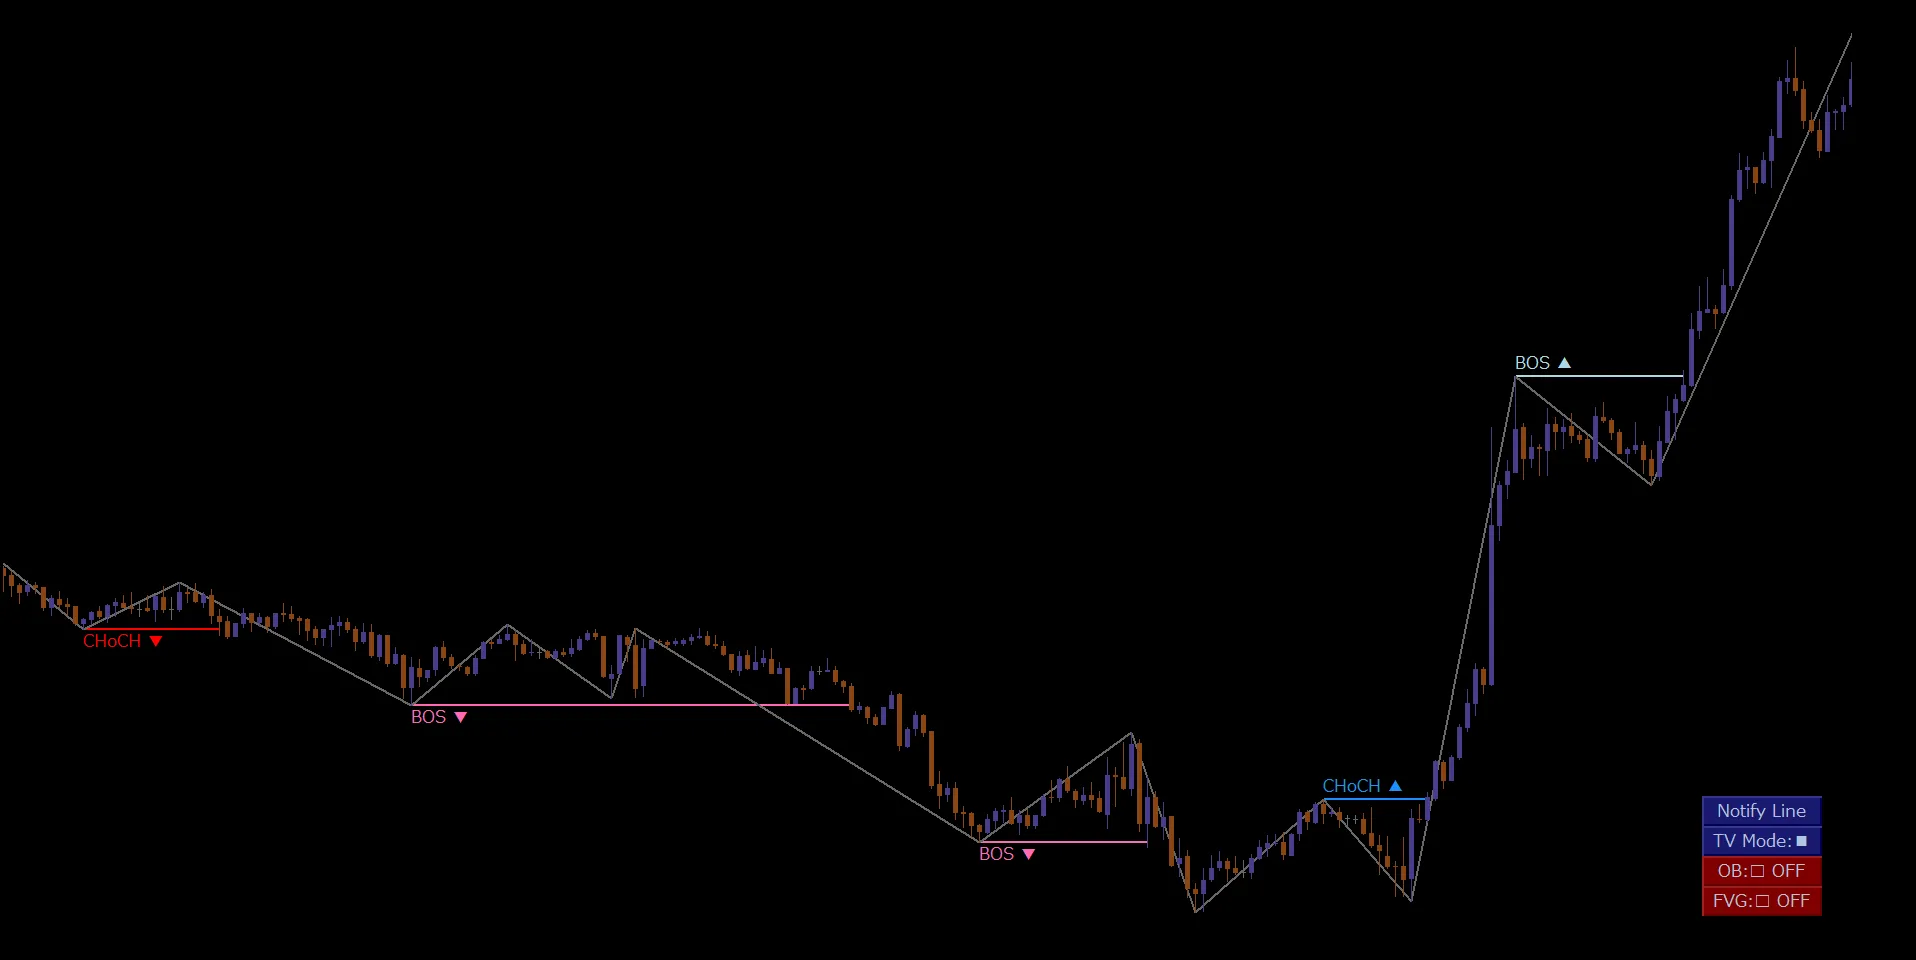
DWMshows BOS▼ in the downward direction followed by CHoCH▲, and subsequently BOS▲ in the upward direction.
Note that CHoCH▲ does not automatically imply an immediate straight-up rise afterward.
Even if CHoCH indicates a change in previous structure, you need to confirm further pullbacks and new highs and lows to determine whether the upward structure takes hold.
CHoCH is a clue to structural change. It does not guarantee the establishment of the opposite trend or an immediate one-way price move.
05 / CHoCH AND PULLBACK
USDJPY・4-hour: Price retraces after CHoCH
After CHoCH is displayed, there are cases where the price does not move in the expected direction.
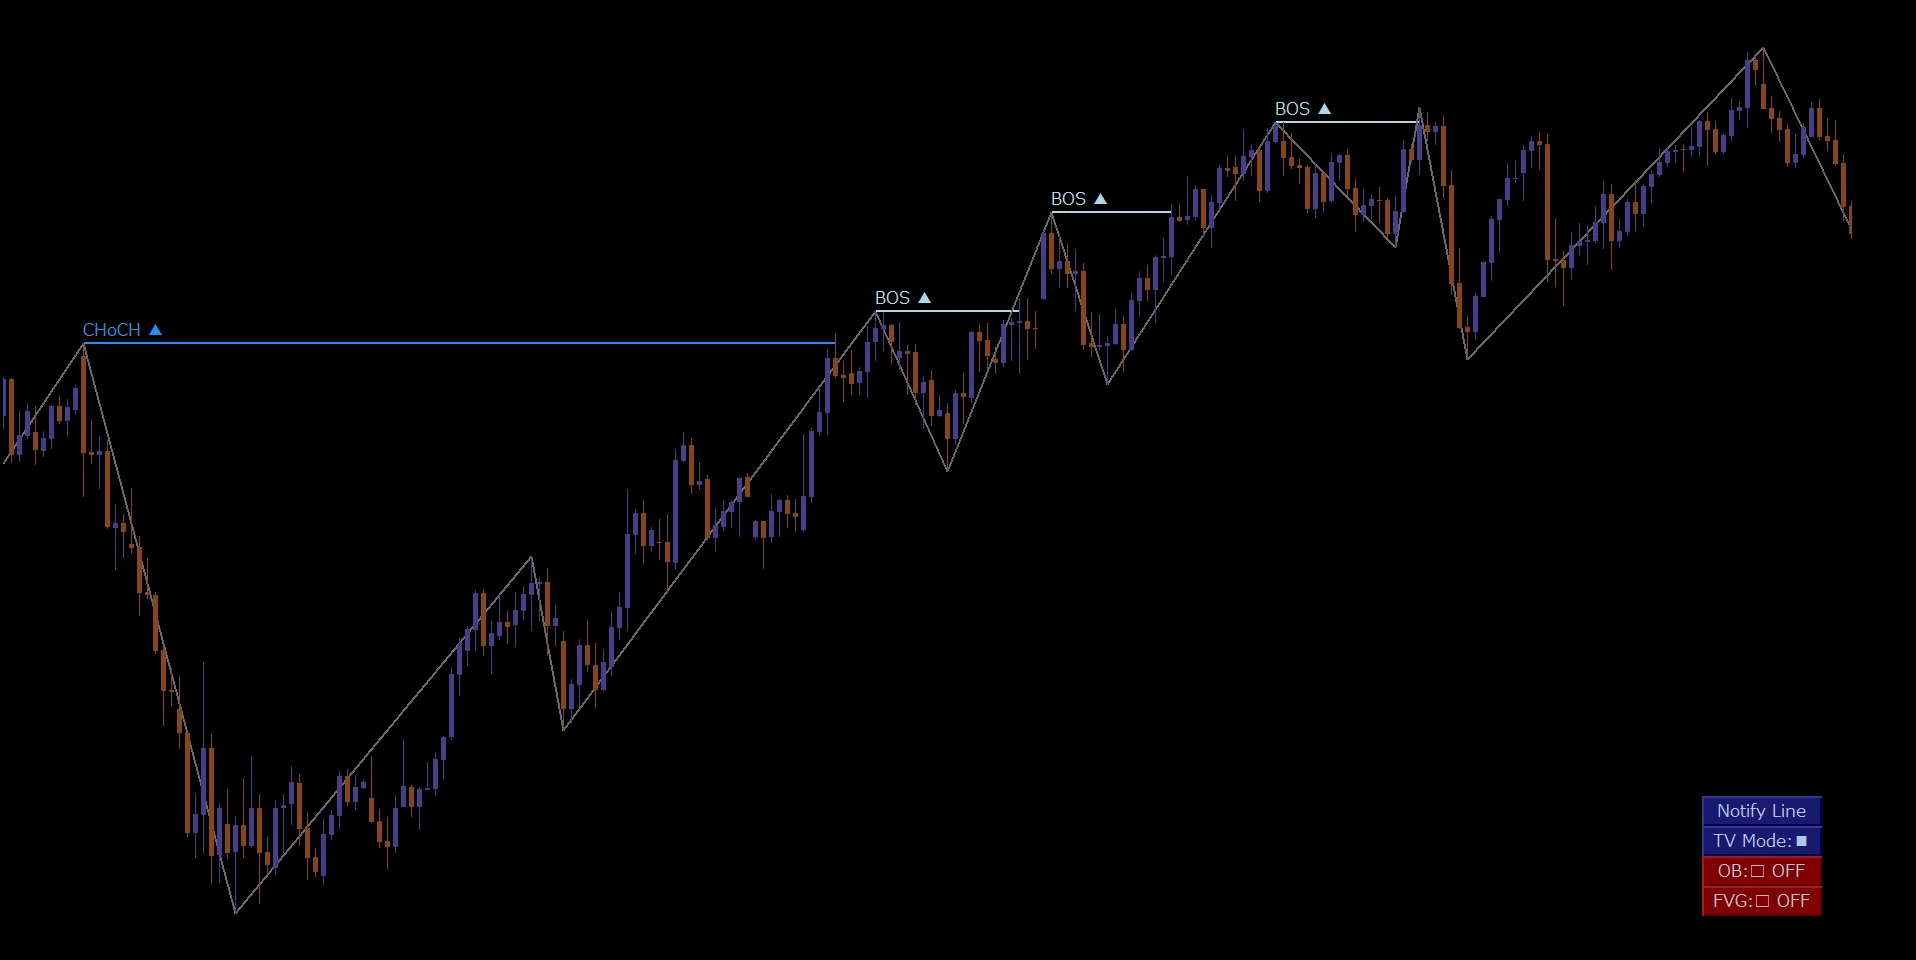
In this chart, after CHoCH▲, the price drops significantly, and during the subsequent recovery phase, several BOS▲ in the upward direction are confirmed.
If you had treated CHoCH▲ as a buy signal, you might have been unable to respond to the large drop that followed.
What is important here is not the quality of the signal itself.
Confirming the structural change and deciding the optimal trading timing are two separate things.
By checking the CHoCH position, the latest highs and lows, the room for pullbacks, and the relationship with higher timeframe positions, you can assess the market environment more cautiously.
06 / BOS DIRECTION CHANGE
GOLD・5-minute: Direction change of BOS without CHoCH
There is another case to examine regarding the relationship between CHoCH and BOS.
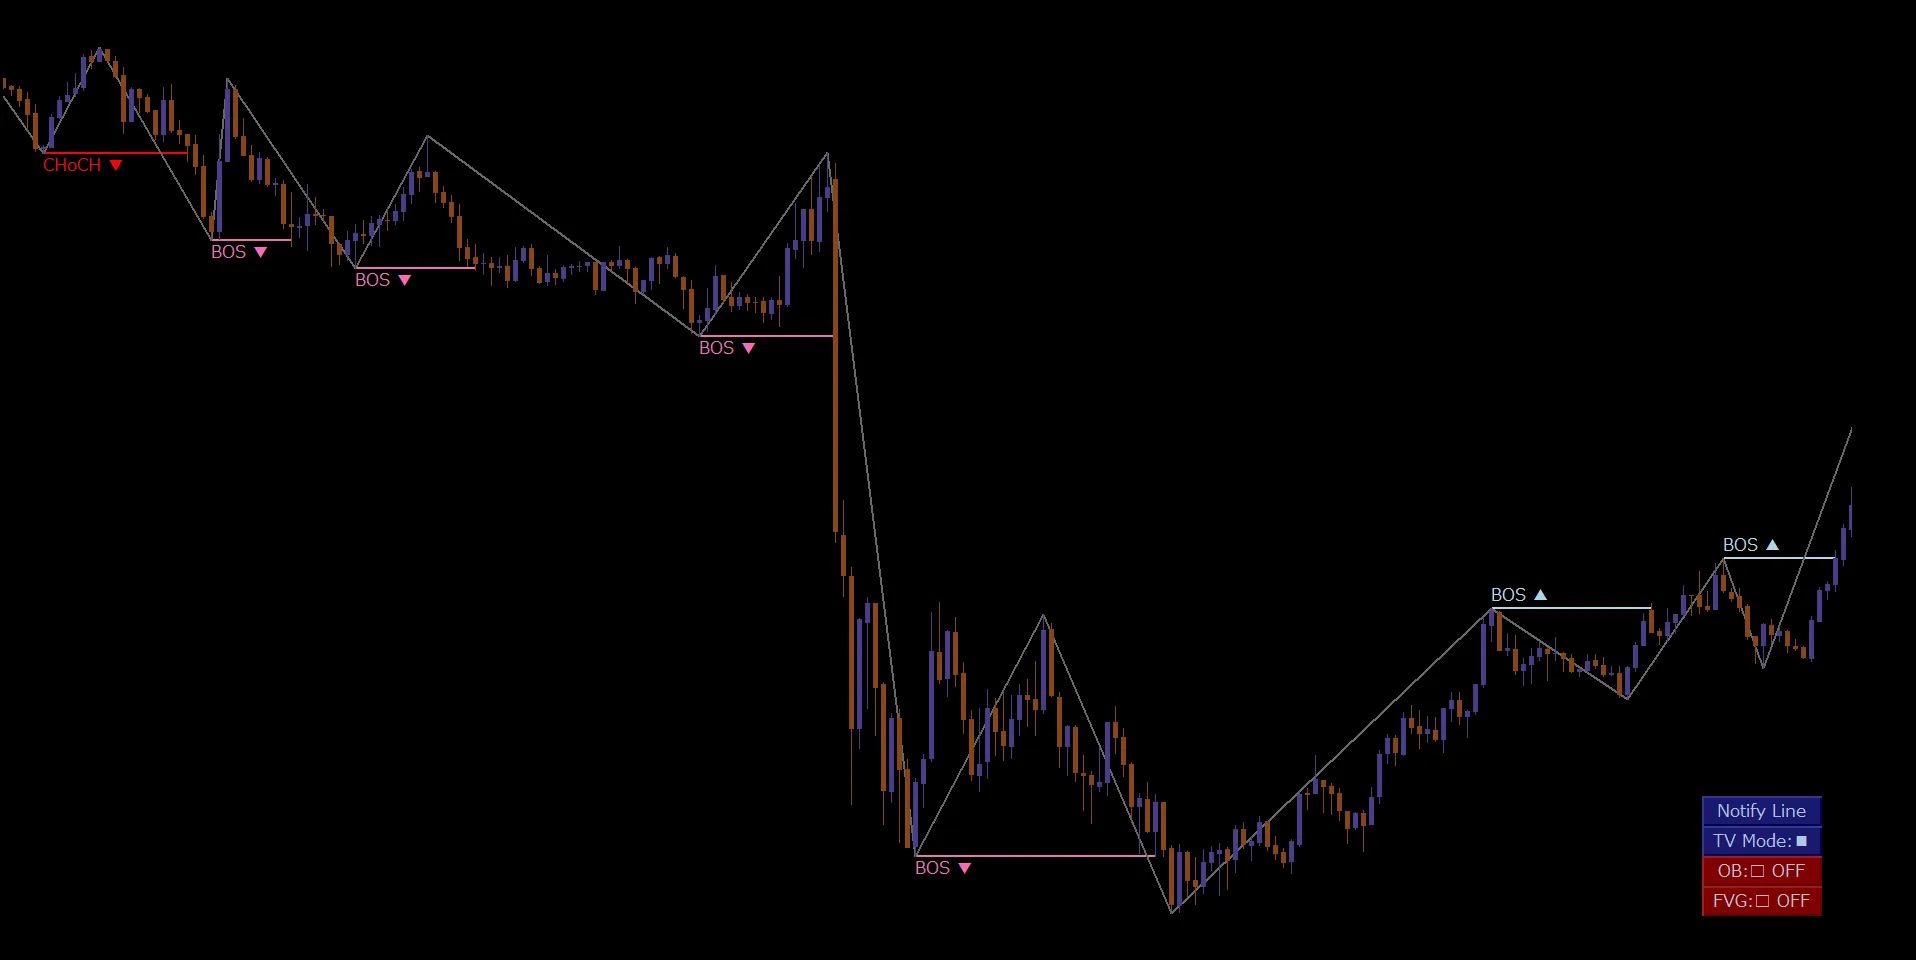
In this chart, after BOS▼ in the downward direction, BOS▲ in the upward direction appears.
What to note is that CHoCH▲ is not observed in between.
In DWM, signals do not necessarily appear in the fixed order of “CHoCH → BOS.”
Therefore, judging solely on the presence or absence of CHoCH may fail to accurately capture the actual Dow wave structure that has formed.
Rather than thinking of signal appearance order rigidly, it is important to check which highs and lows are currently being updated.
07 / PRACTICAL VIEW
Common points seen across five charts
Thus far we have examined cases of both upward and downward trend continuation and structural changes in the market.
A common theme across all cases is that you should not judge CHoCH or BOS in isolation, but rather confirm the overall flow of the Dow waves.
When evaluating the trend, check which swing is being updated.
Where in the structure is the update confirmed, and how does the subsequent pullback fit?
Even if a structural change is confirmed, do not rush to declare the opposite trend established.
Don’t assume CHoCH precedes BOS; verify actual structure.
Don’t rely on a single signal; also check subsequent swing formation and surrounding market conditions.
08 / EXPANDED VIEW
Combining Dow waves with environmental recognition information
Even if you can understand market structure via CHoCH and BOS, that alone might not be enough for trading decisions.
DWMallows you to visualize Dow waves and combine them with higher-timeframe moving averages, FVG, Order Blocks, Pivots, and intraday highs/lows.
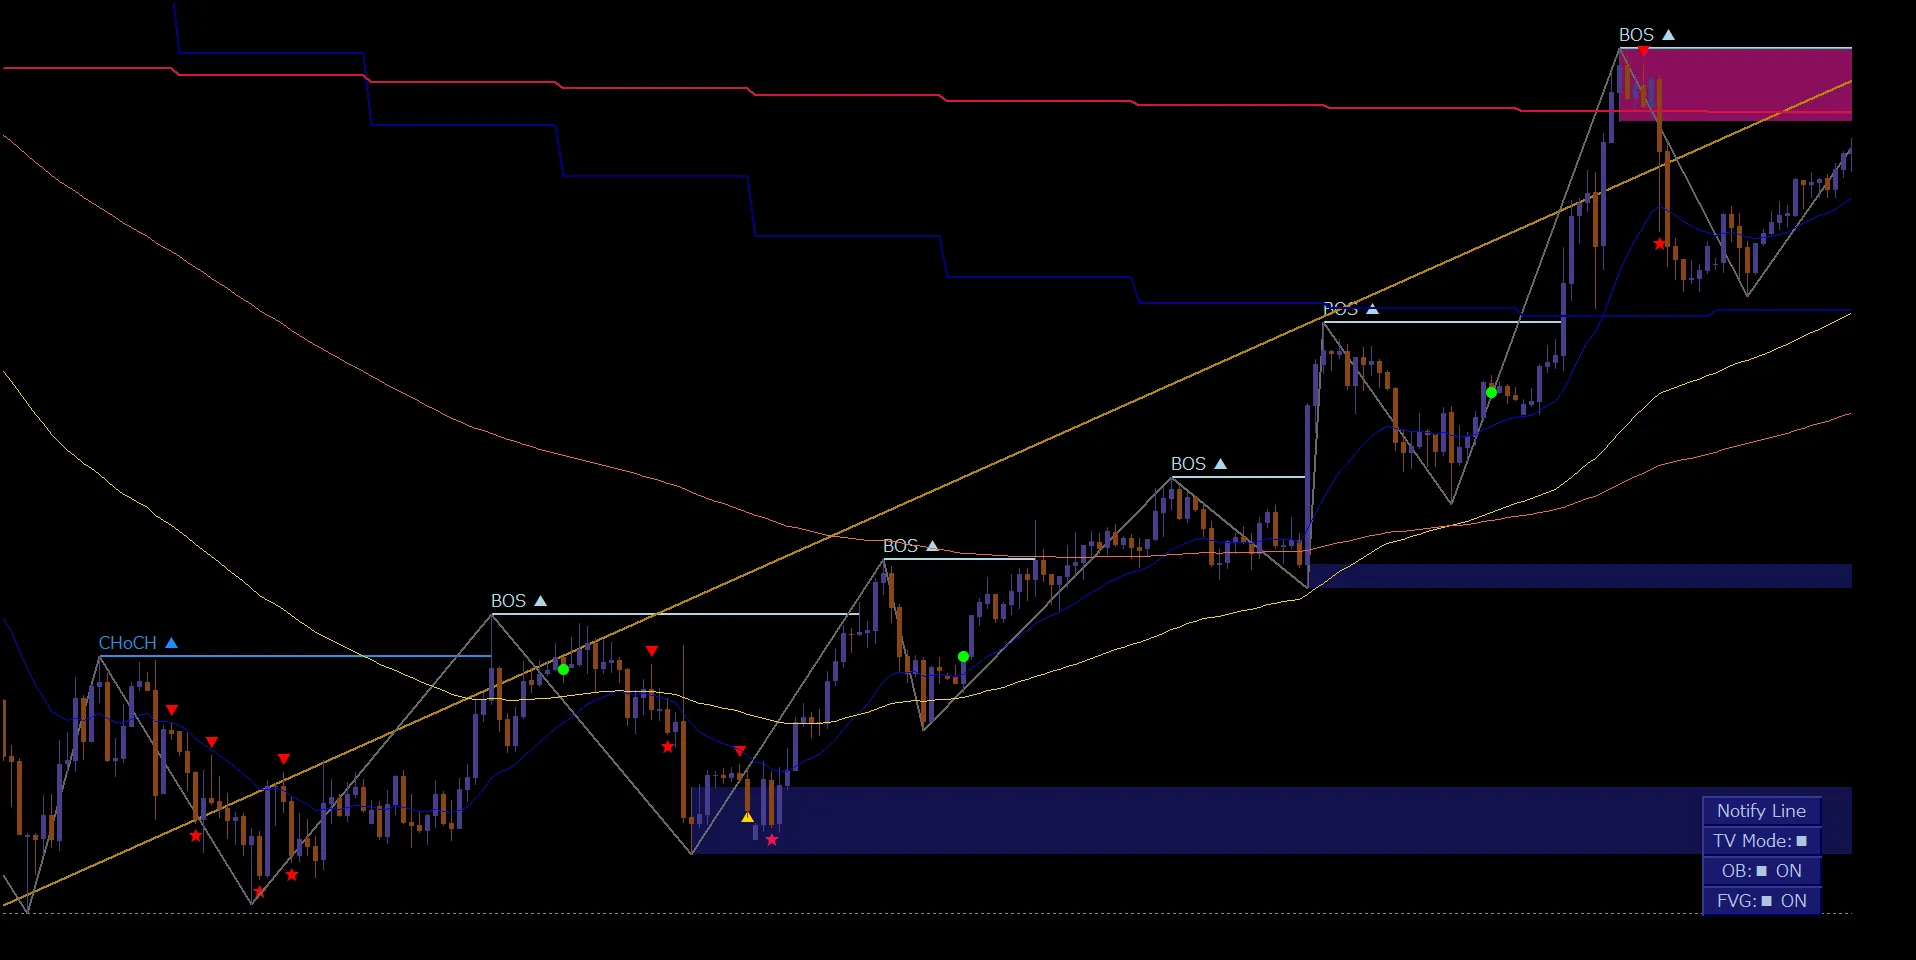
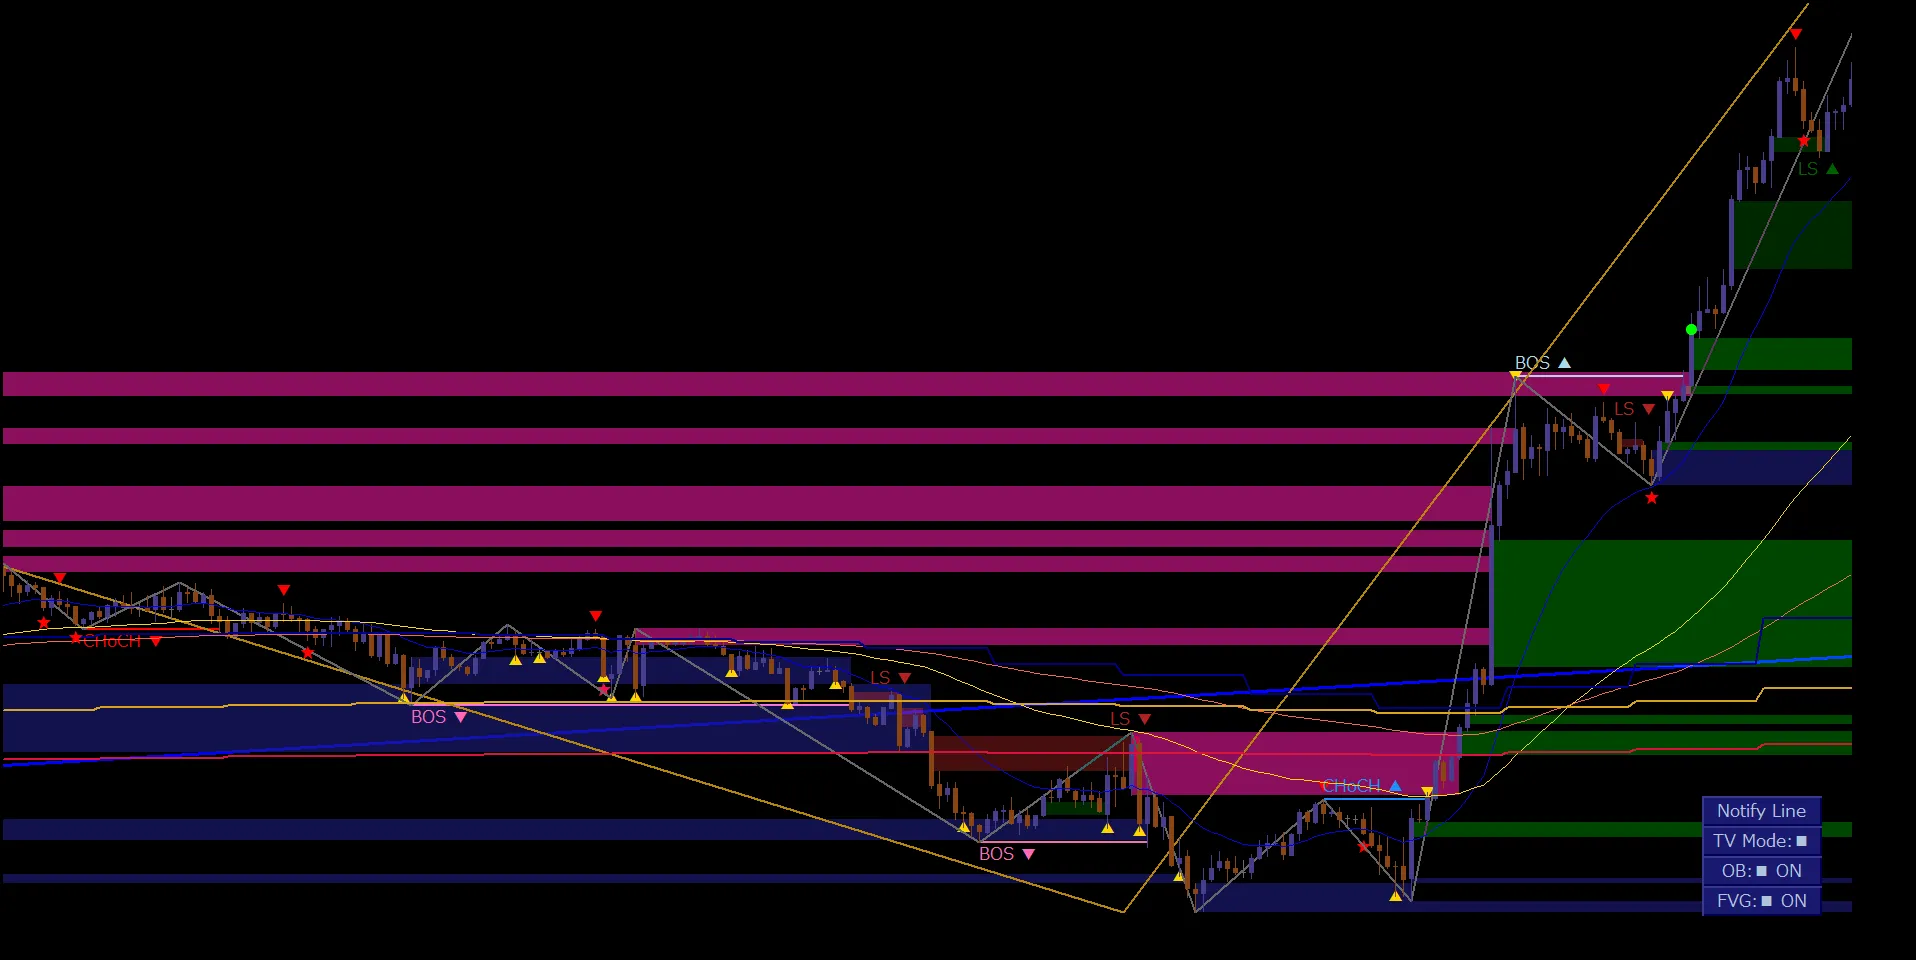
For example, even if an upward BOS▲ is confirmed, if there is a price zone just above that could act as resistance on a higher timeframe, be cautious about assuming only upward continuation.
Conversely, when a pullback occurs, examining the relationship with moving averages and previous reaction zones helps organize the next levels to watch.
However, having too much information displayed is not necessarily better.
Select the information you need according to your analysis purpose and consider it in conjunction with the Dow wave structure..
NextDWMPractical Chart Analysis Series will cover how to use FVG and Order Blocks.
09 / FREE TRIAL
View a 14-day free trial to check your own charts
All five cases introduced here are analyses based on past charts.
With the stocks and timeframes you usually analyze, check what kind of Dow waves form and where CHoCH and BOS appear. Please verify on actual charts.
MT4 / MT5 compatible — trial all features of the SMC integrated model
DowWave Marker
14-day free trial
10 / SUMMARY
Summary: Read the Dow wave structure, not just the signals
In these five charts, we confirmed upward and downward structural updates via BOS, reversals after CHoCH, and BOS changes without CHoCH.
What is common across these is not treating CHoCH or BOS as mere trading signals, but interpreting them as information to read the market structure.
To understand the continuation and turning of Dow waves, you need to verify the updates in highs and lows, the location of signals, and the subsequent price movements together.
DWMis a tool that visually organizes these market structures to support environment recognition in discretionary trading.
See the Structure. Follow the Trend.
Look at the market structure, wait for pullbacks, and capture the resumption of the trend.