
Daily Nikkei 225: 2026/10/20
Tools for analysis detail link
* We have steadily received high praise.
■ Newly developed performance + Indicator DAVID (David)
https://www.gogojungle.co.jp/tools/indicators/73936?via=users_products
■ Masterful Trendline Drawing Indicator “The Sword Unmatched”
https://www.gogojungle.co.jp/tools/indicators/54499?via=users_products
■ Indicator Pack MT4/5 version, monthly subscription
“Tenka musou” Synchro System
https://www.gogojungle.co.jp/tools/indicators/50319
“David” Synchro System
https://www.gogojungle.co.jp/tools/indicators/73939?via=users_products
Review version – Ultimate Synchro System Monthly
https://www.gogojungle.co.jp/tools/ebooks/50353
Below: Current Analysis Articles
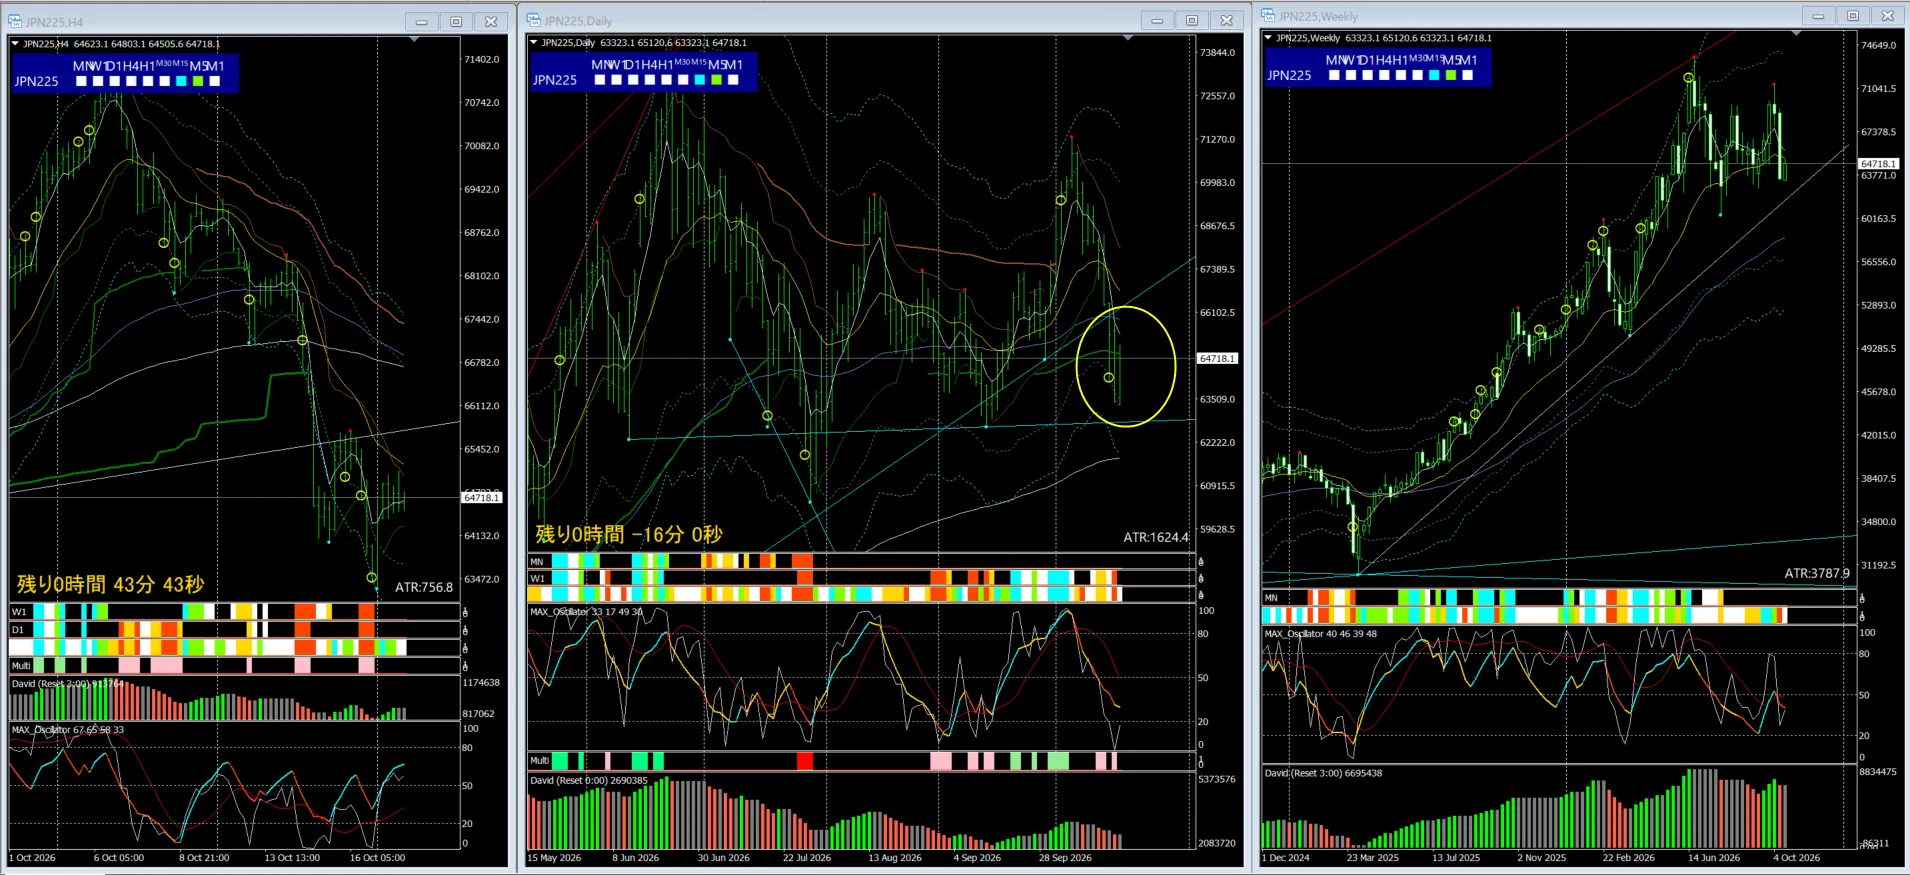
One-liner:Downward trend
Daily Chart:MAX Oscillator: Sync Band“Neutral”
4-Hour Chart“Neutral”SignalSuggest
Weekly Chart “Neutral”SignalSuggest
※Short-term downward trend
Weekly lower signal off
In the short term, after some retracement
From the MAX Oscillator on the daily chart, the downward trend is continuing
Until the 4-hour chart Dow Theory highs and lows start to rise, a bearish outlook remains reasonable
Daily lower resistance and weekly wedge lower bound resistance are approaching; will they hold?
Price movement can become extremely volatile depending on the time of day
If you think it's dangerous, it might be better to exit quickly, and manage risk as well
Caution remains necessary.
Don't ignore near-term, and stay flexible to short-term waves
Be fully cautious of sudden drastic changes!
※ Notes
Volatility is quite high, so be careful with capital management.
Notes
Original indicator provides aCurrent analysis commentaryand does not guarantee future movements.
It does not recommend buying/selling, nor guarantee future movements.