

[Procedure to rearrange losses by number] Find the same pattern before one big defeat
In weekend reflections, aren’t you always replaying the biggest loss just once?
Enlarge that chart and review where you entered many times.
Even though there are many words of reflection, the account still drops by about the same amount the next week, doesn’t it?
When reviewing doesn’t change the way you lose, where should you look?
Good evening!
This is Masashi^^
This time, I’ll talk about where to look in a retrospective.
More than what you look at, it’s about the order in which you look.
What I decide for myself is to look at the small losses that recur weekly before the big one loss.
For that, I rearrange the records not by amount, but by how many times the same shape appeared.
✅ The Weekend When I Only Expanded One Big Loss
In the past, my weekend reflections were all about examining the big loss.
From the records, I’d find the largest loss and open that chart.
Where was I on the higher timeframes, and how did it move on the lower timeframes?
I would bounce back and forth, zooming into the entry point.
There were weekends where I spent nearly an hour on a single trade (;'∀')
The more I looked, the more reflective words surfaced.
・I was impatient
・I couldn’t wait
・The entry location was bad
Every week, these words lined up in my notes.
✅ I looked at the one I suffered the most for the longest
? Weekend at that time: 【Open/expand the biggest loss/Write reflective words】
? A Reflected Loss Often Does Not Appear the Following Week
The next week's records were puzzling.
That big loss, which I reflected on so much, usually didn’t appear the following week.
Nevertheless, the rate at which my account decreased didn’t change much.
Even without a big loss, I was getting shaved down by about the same amount.
Back then, I would sum it up in one sentence:“It was up and down.”This is a common way to summarize when reflecting, but it was exactly my case as well.
Looking at a big loss isn’t wrong.
However, that alone didn’t reveal the reason for weekly decreases.
✅ A big loss often does not recur in the same form the next week.
? What recurs weekly are small losses that stand out less than the big one.
? When Arranged by Frequency, the Same Shape Appeared
One weekend, I happened to try a different way of arranging the records.
Not by amount, but by grouping those with similar entry shapes together.
Then, although each loss was small, the same shape losses appeared many times in a week!
The time of day was similar. The entry location was similar.
Looking on the higher timeframes, it was roughly in the middle of walls from one to another.
So I touched the smaller movements on the lower timeframes and entered there.
Even when I went back to the previous week, the same bundle was always on top.
It wasn’t a matter of luck for a single week; it had been a pattern in my workflow all along.
✅ The account was shaved by a repetition of the same nameless shape.
? The assembled shape: 【Noon light period/touched in the middle of the upper-timeframe walls】
? Why Small Losses Are Hard to See
Why couldn’t I notice such a clear pattern?
The reason was that each loss amount was small, and my eyes didn’t stop at the records.
Painful memories stay the strongest.
Small losses are forgotten within the day and overwritten by another loss the next day.
Even if recorded, I would read them as slightly different each time.
Nameless, they remained buried in isolation.
Oh, to be more precise, the small losses themselves aren’t bad.
The problem is that I didn’t realize they were repeating in the same shape.
✅ Nameless losses get buried in separate places in the records.
⚠ When read one by one, they seem like a random occurrence, but when viewed in bundles, they look like a “usual shape.”
? Look in the Same Order as Household Budget Review
This is somewhat similar to reviewing household finances.
When reviewing finances, you tend to focus on a single large purchase.
But what actually affects you are the regular expenses that come out every month.
It’s faster to look at the bigger items that recur rather than recording everything in detail.
The same approach applies to trading records.
A one-time big loss doesn’t appear every week.
But the same-shaped small losses appear next week as long as your procedure doesn’t change.
✅ Look first at the losses that recur every week.
? Order of viewing: 【First the recurring shapes/Separate big one-off losses】
? Write Only the Losing Trades in One Line
What you do is very simple.
First, write down only the trades you lost on that week.
Amount isn’t necessary to write.
In fact, not writing amounts helps prevent being drawn to a big single loss.
What you write are only three things:
・entry time
・location on the higher timeframe
・the lower-timeframe movement that triggered the entry
When written in one line, it looks like this.
【Noon-ish/in the middle of the upper-timeframe walls/entered after seeing a small extension on the lower timeframe】
✅ Not writing amounts prevents being drawn to a big one.
? Three things to write: time, upper-timeframe location, lower-timeframe trigger. No long sentences needed.
✔ Bundle Similar Lines and Count Them by Frequency
Looking at the written lines, bundle similar ones together.
They don’t have to be exactly the same.
If the time and location are close, put them in the same bundle.
Once bundles are formed, count how many times each occurred and sort by frequency.
There is one thing to be careful about here.
During counting, you may want to repartition this one occurrence into a different shape.
Starting repartitioning makes it never end.
If you’re unsure, leave the uncertain lines aside for now.
✅ When arranged by amount you see a single loss; when arranged by frequency you see your own process.
✔ If you’re unsure, place them sideways. Decide this first and you won’t stall.
? Give a Name to the Most Frequent Form
When you find the shape that occurred the most, give it a one-line name.
The name I gave was 【Noon light period/touched in the middle of the upper-timeframe walls】.
Next time the same shape appears, it’s important to be able to recall it quickly in front of the screen.
What happens when you name it?
It makes the scattered losses appear as a single cluster.
Until then, after every loss I thought,“Just a coincidence”I would think.
Once named, I began to realize,“Ah, this shape again”and noticed it.
However, I won’t decide how to fix it here yet.
Find it and name it. That’s enough for this week.
✅ Naming helps you compare how many times the same shape occurred week by week.
? The length of the name should be something you can recall in a moment in front of the screen.
⚠ A Violated Rule: Put It in a Separate Section
I’ll break the flow here a bit.
This isn’t saying you don’t need to look at big losses.
Among big losses, there are items that should be treated separately from recurring small losses.
A trade where you broke your own rule.
・You bet bigger than usual
・You did not place the stop loss you were supposed to
・You moved the stop loss further away
Such a trade isn’t about shape; it’s about breaking a promise to protect the account.
Therefore, it’s not included in the frequency bundles and is written in a separate line.
If I were you,【Rule-violation/Moved the stop loss】and I would only write what was violated.
Conversely, a big loss that occurred within the rules happened because the stop loss worked as an expected cost.
Even if the amount looks large, there’s no need to rewatch that one loss for hours.
✅ Treat a violated-rule loss separately; evaluate losses within the rules by frequency.
⚠ When writing in a separate section, only note what was broken. Do not write excuses for the reasons.
⭕ Small stop-loss costs can be within expectations?
When I bring this up, people often ask this:
Small losses are stop-losses too, so aren’t they just costs within expectations?
That’s true, each individual stop loss is a cost within expectations.
If it happened where you placed it, there’s nothing wrong with that.
But if the same shape shows up repeatedly, the story changes a little.
It might be a cost you’re paying in a place you didn’t need to enter.
Paying a cost itself isn’t a problem.
What to review is where you’re paying it.
If a week has too few records to bundle, try laying out two or three weeks together.
✅ The review is about where you’re paying, not whether you stopped the loss.
⭕ For fewer counts, you don’t have to name everything yet.
? When a Name Appears, You Can Notice Before Entering
Once a shape has a name, something changes.
When you feel you might enter with that shape, you become aware before placing the order.
Before, you would only realize after entering“There it is again”when reviewing the record.
Now, at the moment you realize you’re in the middle of a wall on the higher timeframe, the name comes to mind first.
Of course, you won’t be stopped every time.
There are days when you still enter even after realizing… w
Still, you can now record the number of times you realize it.
Continuing this check alone every time takes a bit of effort until you’re used to it.
If you lay out price positions in a visible way, it’s easier to compare with your own records.
However, tools do not perform the judgment for you.
✅ The place you notice shifts from after entry to before entry.
? Naming a shape and deciding whether to enter are still up to you.
? GOLD Special Drug has been featured^^
If you want to organize from the basis of judgment, check the content and its limits.
? Summary: Look at Repeating Shapes Before the Big Loss
In reflections, it’s easy to focus on the single biggest loss.
But what chips away at your account is often small losses that repeat in the same shape every week.
Therefore, records are rearranged not by the size of the amount but by how many times the same shape appeared.
Write only the losing trades, bundle similar lines, and sort by frequency.
Give the shape that rises to the top a one-line name.
A big loss that violated rules is written in a separate section and treated separately from frequency counts.
This weekend, start by writing out a week's worth of losses and name the most frequent shape^^
What and where that named shape breaks after entry.
I’ll write about that in the next article again.
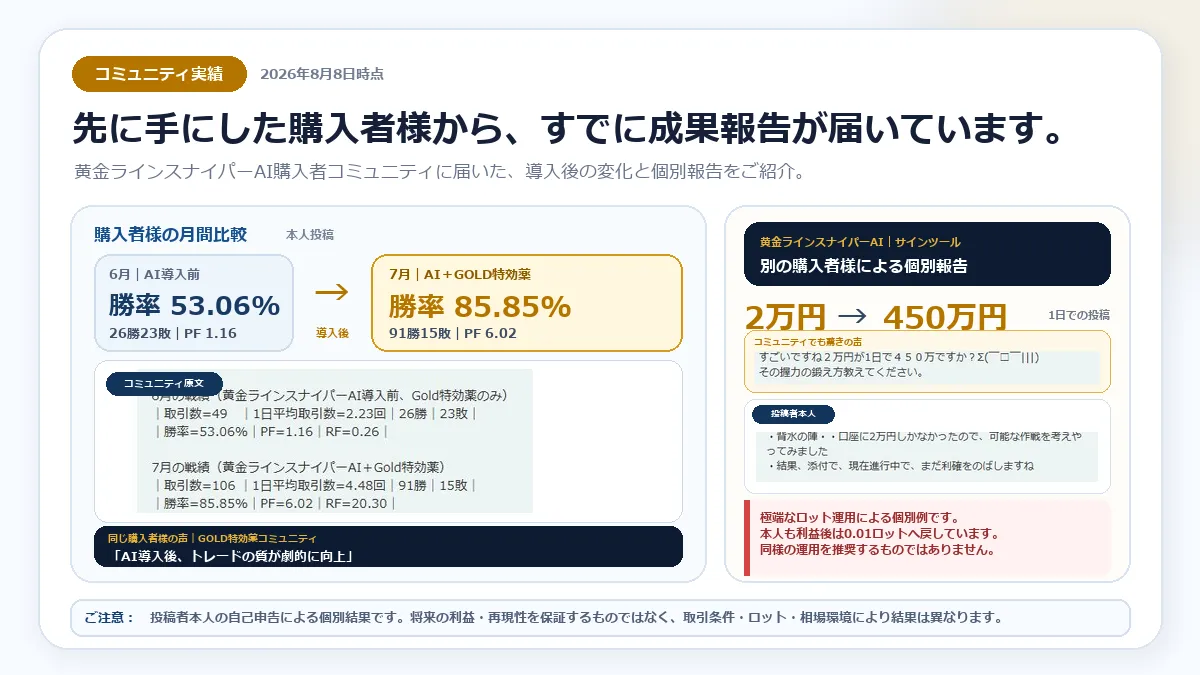
For those who want more materials comparing their own records and price positions, GOLD Line Sniper AI is also an option.
It does not decide which shape is most frequent or whether you enter instead of someone else.
Use it with the understanding of its content and limits, and make your own final decision.
✅ Next weekend, arrange by frequency instead of amount.
? Weekend one-liner: 【Only write losses/Bundle by shape/Name the most frequent shape】
View details of GOLD Line Sniper AI
Thank you again for reading to the end today^^