
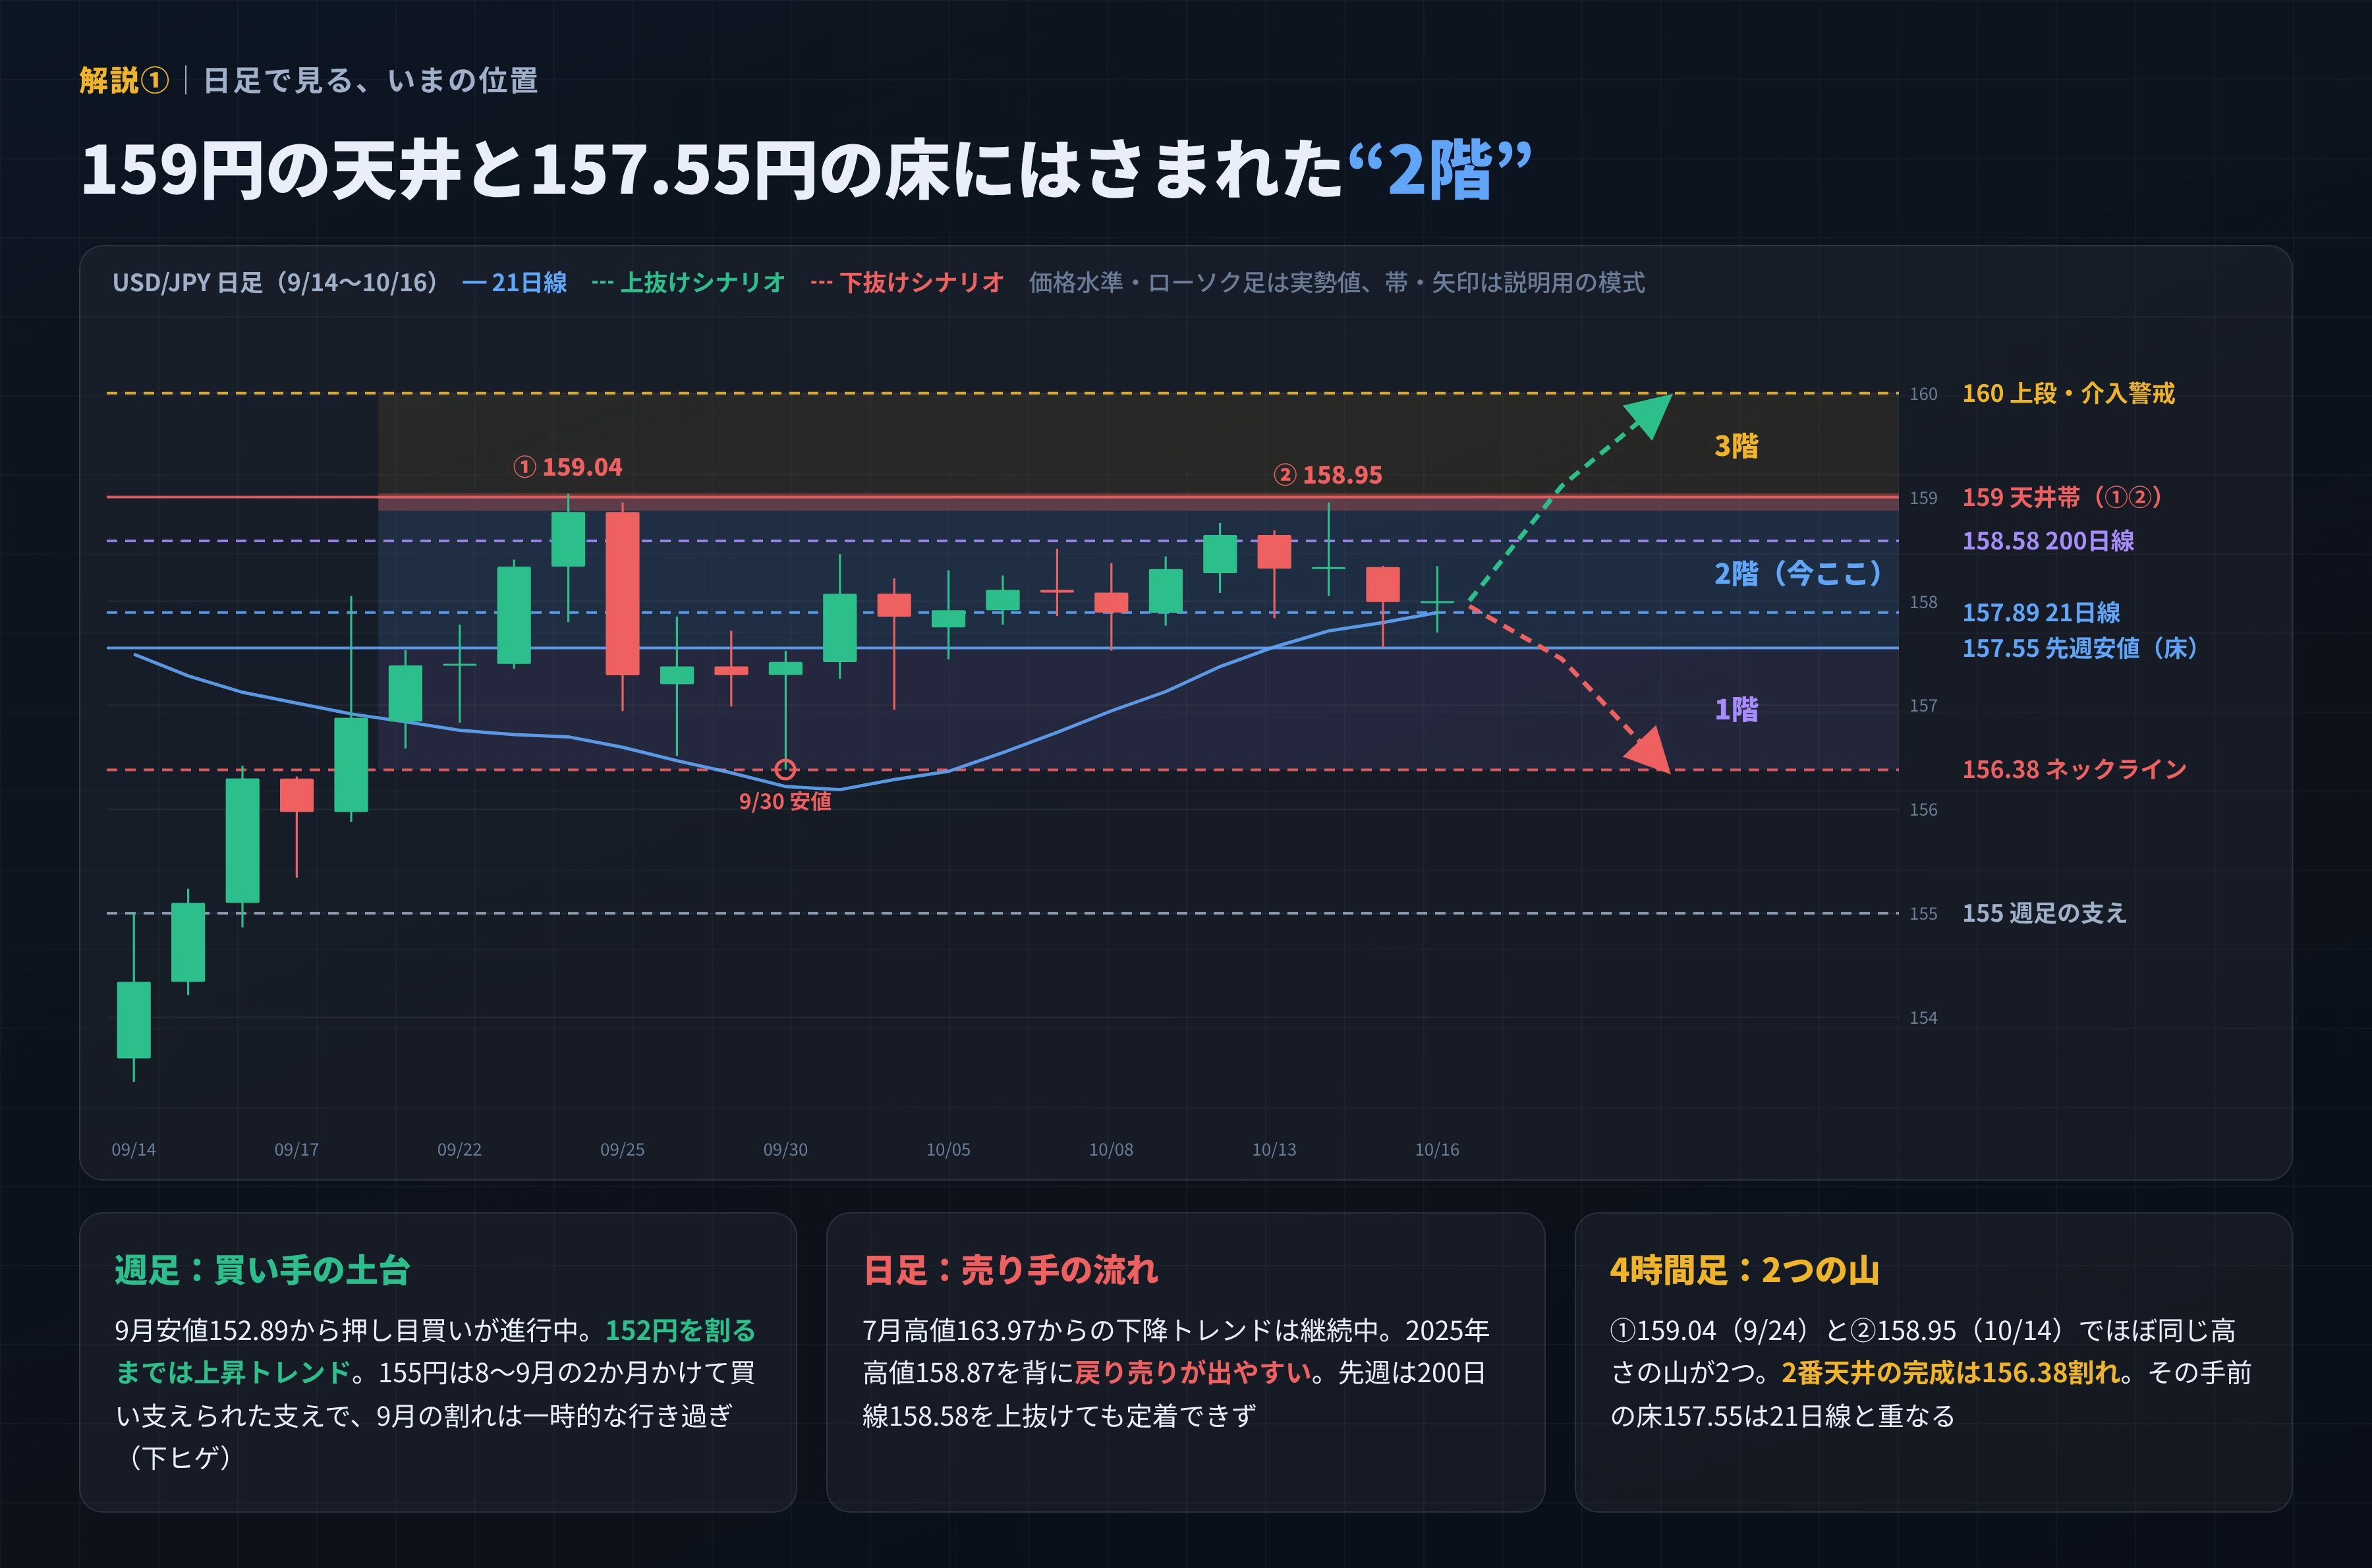
The ceiling of 159 yen (the second top on the 4-hour chart) and the floor of 157.55 yen (last week's low + the daily moving average) are squeezed in between.
159 yen ceiling (second ceiling on the 4-hour chart) and a floor at 157.55 yen (last week's low + 21-day moving average) are sandwiched
in the “second floor,” where selling and buying are balanced.
If either breaks through, target the “edge of the next floor” on the side that broke.
This week's focus
・Will the second ceiling on the 4-hour chart be completed and drop from last week's low to the low of three weeks ago (156.38 yen)
・Supported by the daily moving average (21-day line), will it test 159 yen again
Stance
・We will not move around at the middle of the second floor (around 158 yen)
・After reaching the ceiling (around 159 yen) or floor (around 157.55 yen), wait for the 1-hour signal
━━━━━━━━━━━━━━━━━━━━━━━━━━━━━━━━━━━━━━━━
■ What happened last week (10/12–10/16)
━━━━━━━━━━━━━━━━━━━━━━━━━━━━━━━━━━━━━━━━
Date Open High Low Close
────────────────────────────
10/12 158.27 158.75 158.08 158.64
10/13 158.64 158.68 157.84 158.31
10/14 158.32 158.95 158.05 158.33
10/15 158.33 158.34 157.55 157.99
10/16 157.99 158.34 157.70 157.99
(Pound Sterling Live daily chart. The close on 10/16 is the NY close)
10/12 (Mon) Tokyo market closed. With oil prices rising, it rose to 158.75 yen, briefly breaking above the 200-day line (158.58 yen) but failed to stay.
10/13 (Tue) It was reported that the Bank of Japan would likely hold rates in October, pushing back to 157.84 yen.
10/14 (Wed) US September CPI came in higher than expected, rising to 158.95 yen (last week's high). This became a second peak.
10/15 (Thu) It fell below the 158.08 yen low on the 12th to 157.55 yen (last week's low). It halted near the 21-day line.
10/16 (Fri) Chair Powell of the Fed said policy decisions would not be made in advance, lowering the probability of a rate hike at the October FOMC.
After dipping to 157.70 yen, it recovered to 158.34 yen due to rising oil, ending at 157.99 yen.
10/19 (Mon) Tokyo time: 157.70–158.13 yen. With declines in US long-term yields and ahead of the US midterms, activity was subdued, around 158.10 yen in the afternoon.
━━━━━━━━━━━━━━━━━━━━━━━━━━━━━━━━━━━━━━━━
■ View by timeframe
━━━━━━━━━━━━━━━━━━━━━━━━━━━━━━━━━━━━━━━━
Weekly chart (foundation for buyers)
・From the September low of 152.89 yen, a pullback is ongoing. Upward trend remains until it falls below 152 yen
・155 yen was the support strengthened over two months (8–9月). It temporarily breached in September but that was excessive (long lower wick)
Daily chart (seller’s flow)
・Downward trend from July high of 163.97 yen continues for now
・With the 2025 high at 158.87 yen behind it, position where selling on rallies occurs
・Last week, supported near the low by the daily moving average, and buying recovered in the latter half
4-hour chart (two peaks)
・Peak ① 159.04 yen (9/24) and Peak ② 158.95 yen (10/14), nearly the same height forming a double top
・Valley between the two peaks, the 156.38 yen low (9/30) is the neckline
・If the neckline is broken, the second top is considered “completed”; if it breaks above 159 yen, it’s a “collapse”
1-hour chart (signals)
・Sell signal: lower highs, a second top near 159 yen on the 1-hour chart
・Buy signal: failure of rally selling from the ceiling
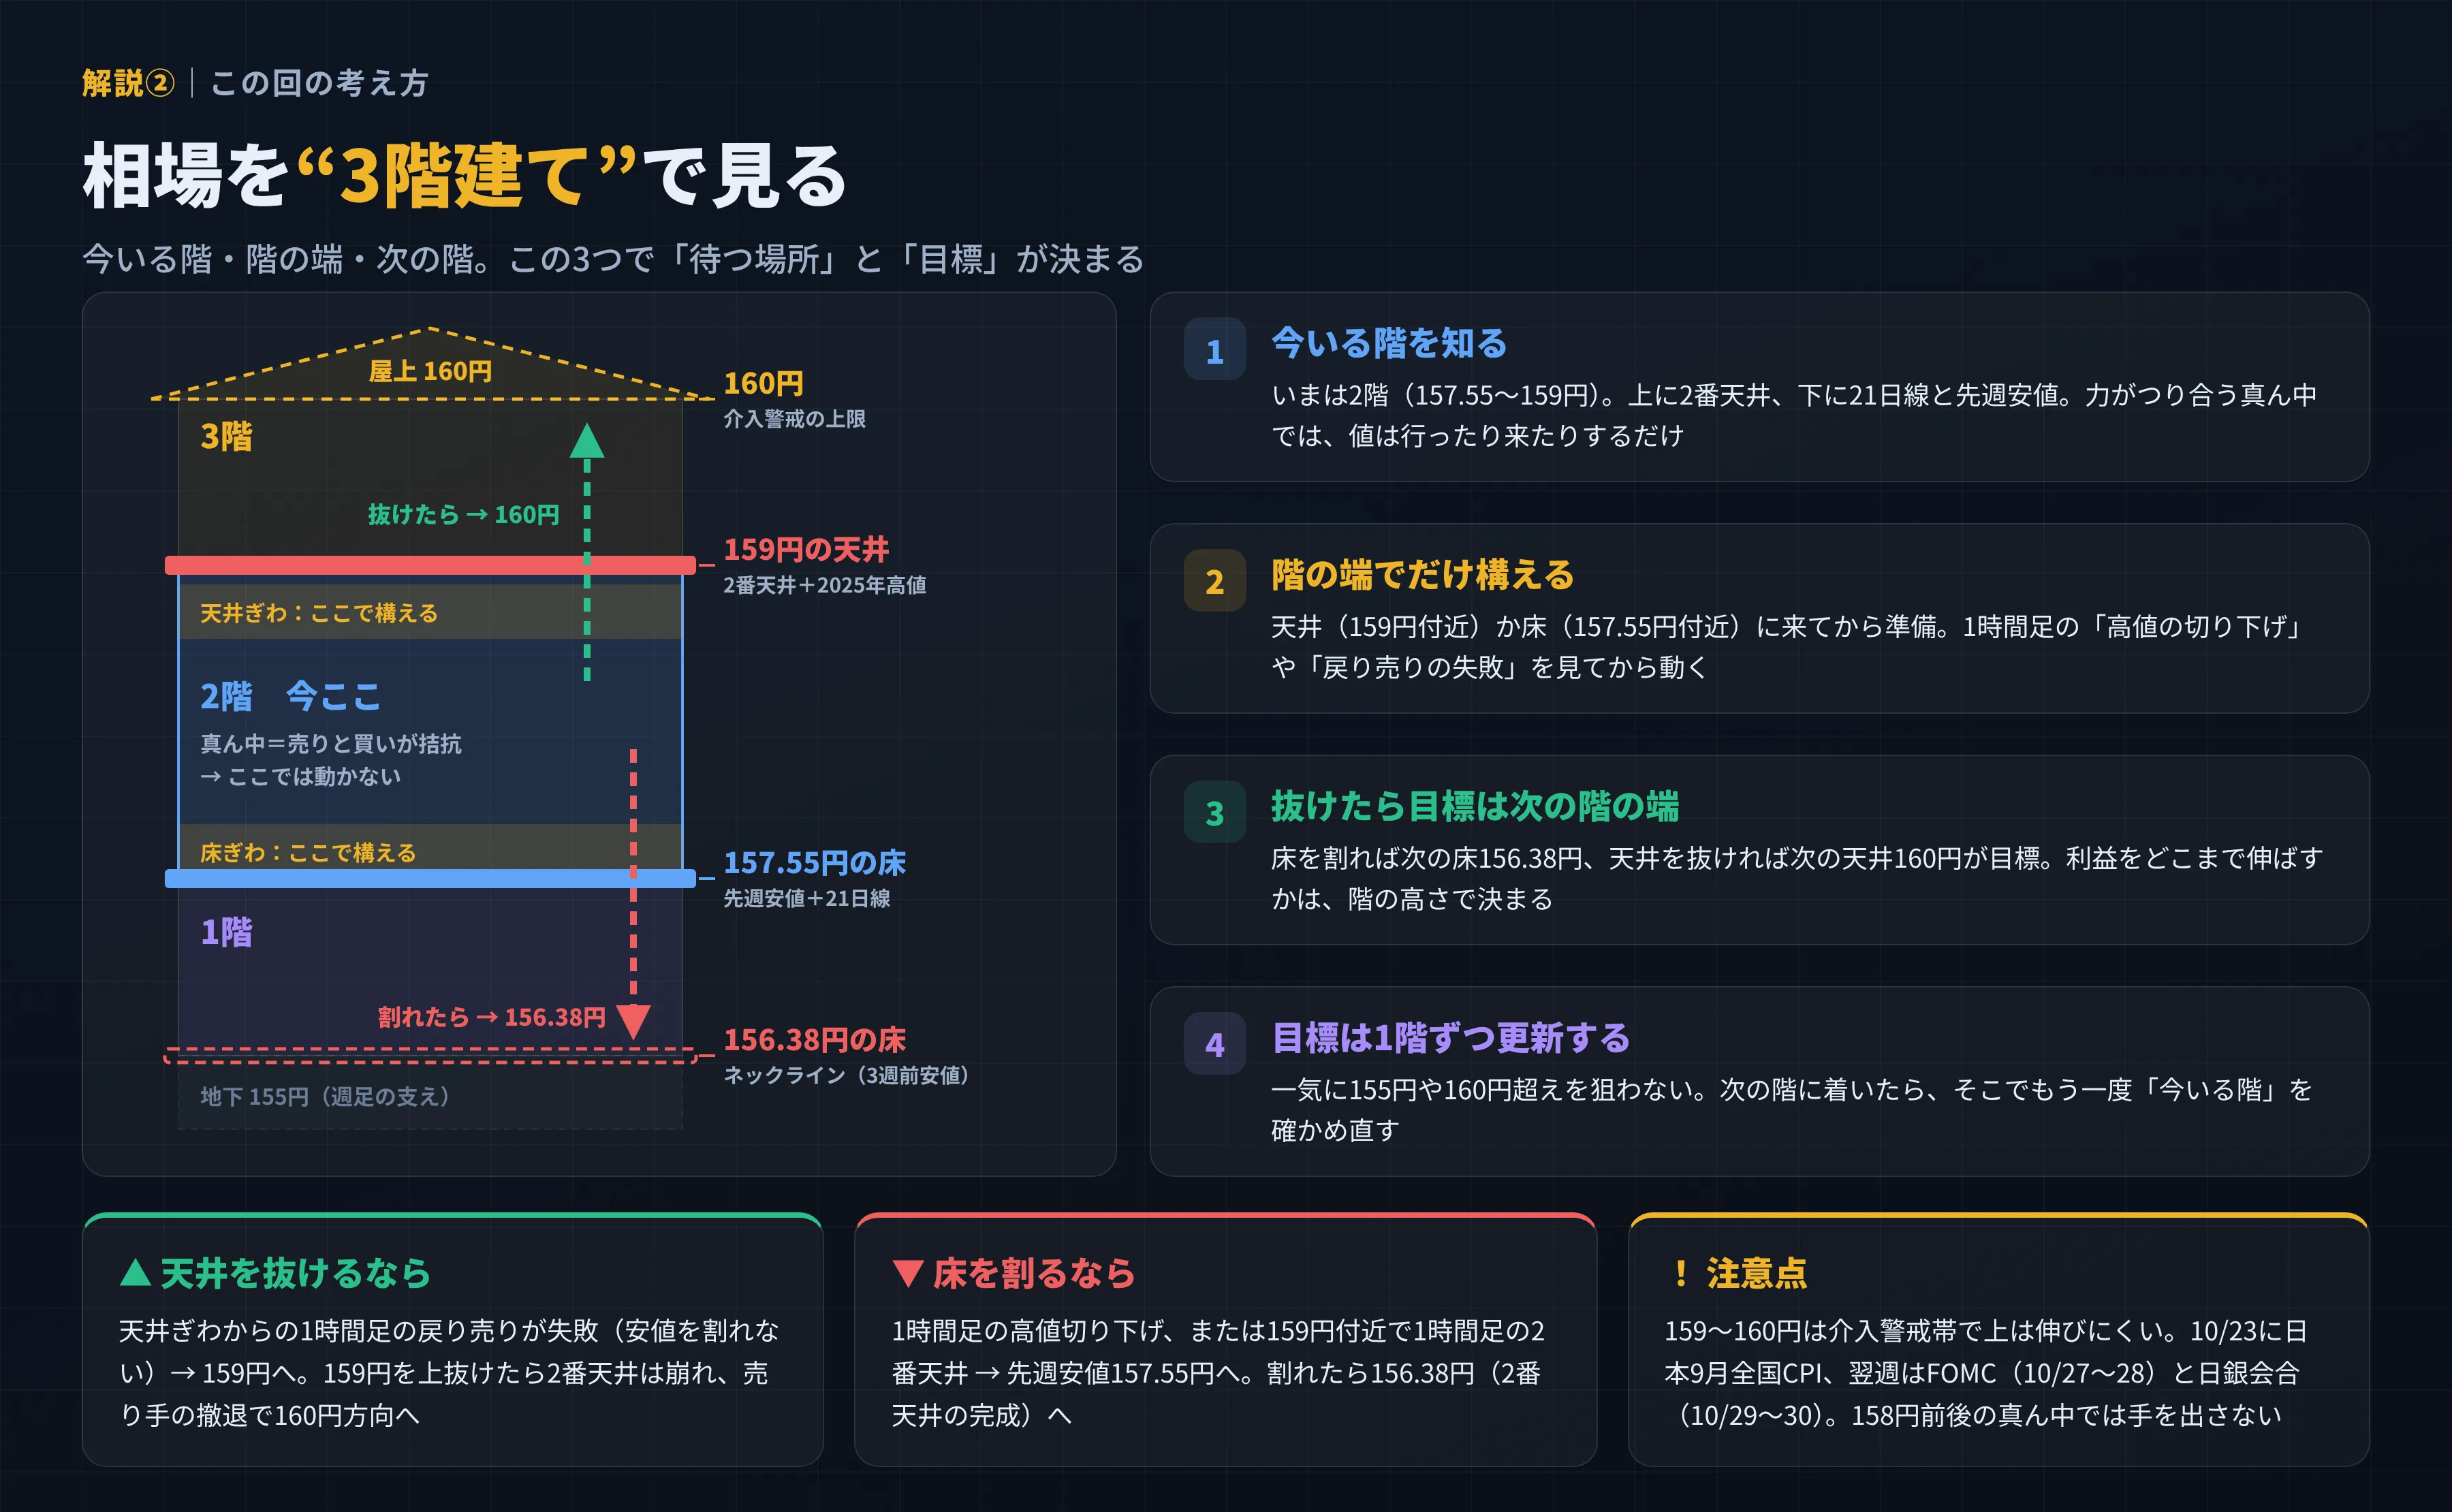
/ ̄ ̄ ̄ ̄ ̄ ̄\ roof 160 yen (risk of intervention)
┌──────────┐
│ 3rd floor │
━━━━━━┿━━━━━━━━━━┿━ 159 yen ceiling (second top + 2025 high)
│ Ceiling edge: prepare │
│ 2nd floor: here now | middle = selling and buying are balanced → no movement
│ Floor edge: prepare │
━━━━━━┿━━━━━━━━━━┿━ 157.55 yen floor (last week's low + 21-day line)
│ 1st floor │
-----┼----------┼- 156.38 yen floor (neckline = 3 weeks ago low)
└──────────┘
地下 155 yen (weekly support)
1. Know the floor you are on
Right now we are on the 2nd floor (157.55–159 yen). Above is the second ceiling, below is the 21-day line and last week's low.
When forces balance in the middle, prices tend to move sideways without a clear direction.
2. Only position at the edges of a floor
Prepare after reaching the ceiling (around 159 yen) or floor (around 157.55 yen).
Move only after seeing signals such as “lower highs” on the 1-hour chart or failure of rally selling.
3. If broken, target the edge of the next floor
If the floor breaks, target 156.38 yen (three weeks ago low); if the ceiling is broken, target the next ceiling at 160 yen.
How far to extend profits is determined by the height of that floor.
4. Update targets floor by floor
Do not aim for a quick break beyond 155 or 160 yen. When arriving at the next floor,
reconfirm the “current floor” again.
━━━━━━━━━━━━━━━━━━━━━━━━━━━━━━━━━━━━━━━━
■ This week's scenario
━━━━━━━━━━━━━━━━━━━━━━━━━━━━━━━━━━━━━━━━
▲ If the ceiling is broken (bullish side)
Failing to clear the 1-hour chart rally from the ceiling (cannot break the low) → move toward 159 yen.
If 159 yen is broken to the upside, the 4-hour chart second top will deteriorate, and sellers retreat, making a move toward 160 yen likely.
▼ If the floor is broken (bearish side)
1-hour chart shows lower highs → toward last week's low of 157.55 yen.
Or return toward around 159 yen and form a second top on the 1-hour chart → toward last week's low.
If 157.55 yen is breached, toward the three weeks ago low 156.38 yen (completion of the second top).
! Important points
・159–160 yen is an area to watch for intervention. The upside tends to be limited
・Friday 10/23: Japan’s September nationwide CPI. Next week FOMC (10/27–28) and Bank of Japan meeting (10/29–30)
・Do not enter near the middle of the second floor around 158 yen
━━━━━━━━━━━━━━━━━━━━━━━━━━━━━━━━━━━━━━━━
■ Price level list (as of 10/16)
━━━━━━━━━━━━━━━━━━━━━━━━━━━━━━━━━━━━━━━━
160.00 yen Top level, major figure, intervention alert
159.47 yen 100-day moving average
159.04 yen Peak ① (9/24 high)
158.95 yen Peak ②, last week's high (10/14)
158.87 yen 2025 high
158.58 yen 200-day moving average
157.99 yen Last week's close
157.89 yen 21-day moving average
157.70 yen 10/16 low, 10/19 Tokyo low
157.55 yen Last week's low (floor of the 2nd floor)
157.50 yen 25-day moving average
156.38 yen Three weeks ago low (9/30) = neckline
155.00 yen Weekly support
152.89 yen September low
152.00 yen Weekly rising-trend defense line
━━━━━━━━━━━━━━━━━━━━━━━━━━━━━━━━━━━━━━━━
■ Notes
━━━━━━━━━━━━━━━━━━━━━━━━━━━━━━━━━━━━━━━━
This document is an instructional explanation for learning purposes and does not constitute investment advice.
Price levels are based on publicly available data. The bands and arrows in the diagram are illustrative for explanation.
Please make your investment decisions at your own risk.